
Summarize this page with:
Every marketer running TikTok Ads wants to know the same thing: Is my campaign actually performing or just spending?
The answer isn’t in your dashboard. It’s in how your metrics compare against the rest of your industry.
We looked at data from 2500+ advertisers who track and measure TikTok Ads performance on our reporting platform. Some industries converted at surprisingly higher rates. A few spent heavily but struggled to translate traffic into results.
The findings also challenge common assumptions about TikTok Ads performance. Some of the strongest conversion rates did not come from entertainment or fashion categories, but from industries like Primary Sector, Convenience Services, and Telecommunications.
That’s what benchmarks do. They surface what you wouldn’t see on your own.
By the end of this blog, you’ll know:
- 2025 TikTok Ads benchmarks across key metrics like CTR, CPC, CPA, conversions, and conversion rate.
- Industry-wise performance trends to see how your category compares.
- Practical ways to use these benchmarks to optimize your campaigns
- How to plan for your next TikTok Ads campaign?
Key Takeaways From 2025 TikTok Ads Benchmark Data
Analyzed across 28 industries, the benchmark data reveals sharp differences in traffic costs, engagement efficiency, and conversion performance across TikTok Ads.
Transport Domintes Ad Spend
Transport recorded the highest median spend at $9321.91, which is 2.4x the next highest industry, Media & Content ($3887.93). Internet Finance ($3201.76), Food & Drinks ($3058.56) and Games ($2999.91) round out the top 5 five spenders. The gap points to significantly higher competition and acquisition spending in the Transport industry compared to most other sectors on TikTok Ads.
Convenience Services Balanced Scale with Profitability
Convenience Services combined a $0.14 CPA with a 10.53% conversion rate and 2,008.5 median conversions; one of the few categories delivering low acquisition cost, strong efficiency, and meaningful volume simultaneously.
Travel Faced the Highest Acquisition Costs
Travel recorded the highest CPA in the dataset at $66.54, alongside a high CPC ($0.98) and a weak 1.04% conversion rate – pointing to efficiency problems across the entire acquisition funnel.
Low Conversion Industries Struggled Despite Reach
Travel (1.04%), Chemicals & Energy (1.65%), Clothing & Accessories (1.96%), and Consumer Electronics (2.05%) converted poorly, suggesting weaker post-click alignment or longer buying journeys.
Why TikTok Ads Benchmarks Matter for Your Business?
Now that we’ve looked at the numbers, the next question is how to use them. Here’s why TikTok advertising benchmarks matter for your business.
1. Identify Cost vs Conversion Problems
TikTok generated an estimated $23 billion in revenue in 2024, with 77% coming from advertising. More brands are competing in the same auction environment than ever before.
That competition changes how you should read your numbers. If your CPC is increasing, the issue could be market competition, audience saturation, or weaker creative relevance. If your CPA is rising while CPC stays stable, the real problem is often friction in conversion after the click.
TikTok Ads benchmarks help separate traffic cost problems from conversion efficiency problems, so you optimize the right lever first.
2. Massive User Scale Emphasizes Importance of Context
TikTok reached 1.9 billion active users globally and has been downloaded over five billion times. At that scale, metrics like impressions and clicks can look impressive without necessarily driving business outcomes. TikTok Ads Benchmarks help answer questions like:
- Is your CTR competitive for your industry?
- Is your CPC efficient compared to similar advertisers?
- Is your conversion rate strong enough to justify scale?
Without proper benchmarking, large volumes can weaken your advertising performance.
3. Benchmarks Protect Budget Allocation Decisions
When performance drops, many advertisers respond by increasing their spend, refreshing creatives or changing bids without knowing the root cause. Benchmarks provide a smarter filter:
- If you have low CPC but high CPA, fix the conversion flow.
- If your CTR is weaker than your competitors', improve your hooks and visual messaging.
- If your key TikTok ad KPIs lag the industry benchmark, reconsider audience strategy or channel mix.
4. Global Reach Does Not Mean Every Industry Wins Equally
TikTok’s largest audience is in Asia-Pacific, while Douyin accounts for another 766 million active users in China.
This shows enormous platform reach, but reach alone does not guarantee efficient acquisition for every business model. Some industries naturally perform better in TikTok’s fast scroll, discovery-led environment. Others face longer trust cycles or slower purchase decisions.
Benchmarks help you determine whether your industry is operating in a favorable environment or struggling to adapt to platform behavior.
What TikTok Ads Benchmarks Are We Comparing?
Before diving into industry results, here is what each metric measures and why it matters for evaluating your TikTok Ads performance. All figures used represent median values, meaning they reflect the typical midpoint across advertisers, not averages skewed by the highest spenders.
TikTok Ads Benchmarks by Industry
Now that we’ve defined the key metrics, next, let’s visualize the industry-level breakdown. This analysis period typically runs from January 1 to December 31st 2025.
TikTok Ads Median Spend
Median spend reveals how competitively each industry approaches TikTok advertising. Transport stands as a clear outlier ($9322), spending more than double that of the next-highest industry. Media & Content ($3887), Internet Finance ($3201), Food & Drinks ($3058), and Games ($2999.9) form a distinct second tier, all clustering between $3000 – $3900.
The Finance sector is worth noting separately. Traditional Finance ($1662) and Internet Finance ($3201) may seem similar, but Internet Finance spends nearly twice as much. It shows the adoption of digital acquisition strategies targeting a younger, platform-native audience.
Low spend doesn't mean low intent. Convenience Services is one of the smallest spenders ($273.7) in the dataset, yet it has a strong conversion rate (10.53%). This is a reminder that budget size and campaign efficiency don’t always go hand in hand.
TikTok Ads Median CPC
Median CPC reveals where competition is most intense and where advertisers are paying a premium just to reach their audience.
Utility Software leads at $1.22, followed by Professional Services ($1.04), Electronics & Electrical ($0.98) and Travel ($0.976). These are all categories where users research extensively before clicking, indicating high consideration cycles. Telecommunications pays a relatively high CPC of $0.72 despite generating the platform’s highest click volume, suggesting strong competitive bidding even at scale.
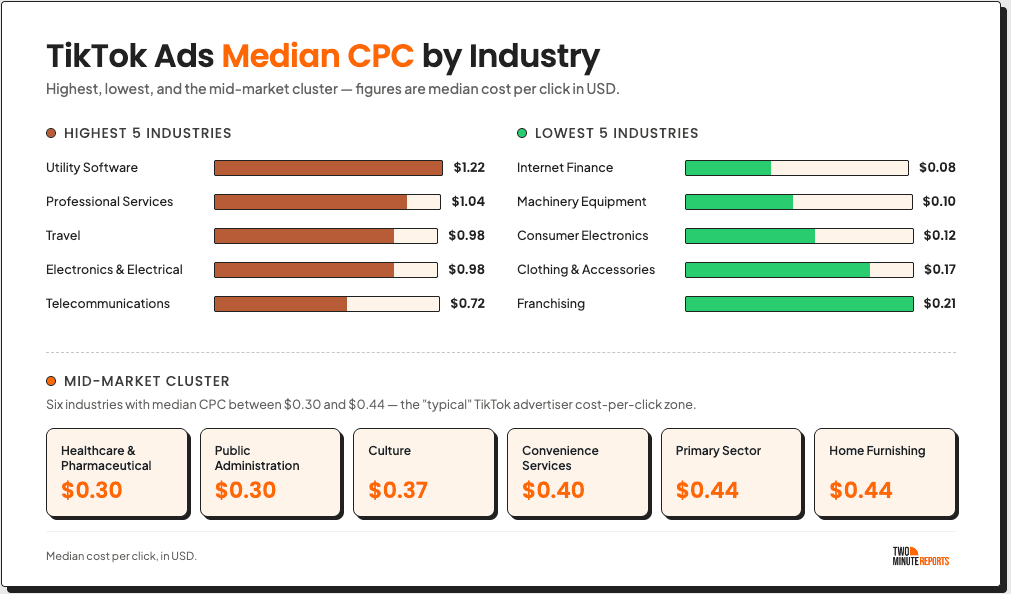

Internet Finance posts the lowest CPC in the dataset at just $0.08, combined with its 28K median clicks. It's one of the few categories generating both volume and efficiency simultaneously.
Machinery Equipment ($0.10), Consumer Electronics ($0.12), and Clothing & Accessories ($0.17) also sit well below $0.20, where audience overlap, and lower bid competition keep costs in check.
The spread between the highest and lowest CPC is 15.6x; a reminder that platform-level averages mean very little without industry context.
TikTok Ads Median CTR
Consumer Electronics leads with 2.59% CTR, which is roughly 60% higher than Transport (1.62%), the next closest category. This gap is significant. It suggests that product-focused, visually appealing goods have a natural advantage in TikTok’s scroll-driven format.


Internet Finance rounds out the top three at 1.36%, making it one of the dataset's more surprising performers given the complexity of financial products. Travel posts the lower CTR at 0.22%, followed by Telecommunications (0.26%) and Real Estate (0.31%). These are high-consideration categories where users rarely act on a single click.
Professional Services recorded 0.40% CTR, while Automotive reached 0.59%, showing that engagement levels were fairly consistent across many sectors rather than heavily skewed toward a few industries.
Note: CTR figures are rounded percentages derived from raw decimal values (multiplied by 100).
TikTok Ads Median Conversions
Games sit in a category of their own, generating 7.1x more median conversions than the next highest category. This is driven by app installs and signups, aligning perfectly with TikTok’s fast-scroll behavior. Treating Games on the same scale as other industries would skew any cross-category comparison, so it’s best read separately.


Outside of Games, Media & Content, Convenience Services, Telecommunications and Transport lead conversion volume. Simpler offers, faster decision-making, and shorter paths from ad engagement to conversion might drive this.
At the lower end, Real Estate, Travel, and Franchising reflect longer consideration cycles rather than campaign failure. These are categories where a single ad impression rarely triggers an immediate conversion, as the journey involves more touchpoints.
TikTok Ads Median CPA
Games ($0.09) and Convenience Services ($0.13) are the standout efficiency leaders, with CPA below $0.15. For Games, this reflects the near-frictionless nature of app installs. For Convenience Services, it points to tightly targeted campaigns reaching audiences already close to a decision. Media & Content ($0.83) and Telecommunications ($0.90) follow at under $1 CPA – a level of efficiency that’s difficult to match across most other categories.


Travel sits at the opposite end with a $66.54 median CPA, which is nearly twice that of Real Estate in second place. These industries involve high-consideration purchases where the conversion itself carries significantly more value. A single booking or property enquiry justifies a much higher acquisition cost than an app install.
The largest group of industries clusters between $3.75 and $10.10, acting as a practical benchmark covering Retail ($3.77), Education ($3.80), Consumer Electronics ($4.38), Automotive ($5.50), and several others. For most TikTok advertisers outside the efficiency outliers, this is the realistic CPA band to use for comparison.
TikTok Ads Median Conversion Rate
Primary sector leads all industries at 18.95%, with Games (14.91%) and Franchising (14.64%) close behind. All three benefit from frictionless conversion events and tightly aligned offers. Convenience Services (10.53%) and Telecommunications (10.21%) round out the top five.
Outside the headline performers, Culture (9.24%) and Automotive (9.13%) emerge as quiet outperformers. Traditional Finance (6.73%) also overperforms relative to its high CPC ($0.49), suggesting users who click arrive with clear intent.


Most industries cluster between 3% and 6% – the realistic benchmark range for the platform, covering Food & Drinks (3.06%), Education (3.97%), Healthcare (4.14%), Media & Content (5.73%) and others. At the lower end, Machinery Equipment (0.79%), Travel (1.04%), and Chemicals & Energy (1.65%) sit well below average. These are research-heavy categories where users rarely convert on a single click.
How to use TikTok Ads Benchmarks to Improve Campaign ROI?
This section uses the above TikTok Ads benchmark data as a diagnostic sequence, starting with traffic cost, moving through engagement and conversion efficiency, and ending with a category-level decision on what to optimize first.
1. Start with CPC – Is Your Traffic Cost in Par With Your Industry?
The data shows a 15.6x gap between the cheapest and the most expensive industries. Before assuming your CPC is a campaign problem, check whether it’s an industry reality. Utility Software advertisers pay $1.22 per click, because that’s the cost of reaching their audience.
Do this: Pull your last 30 days of CPC data and compare it against your industry median from this report. If your CPC is exceeding your industry median by more than 20%, avoid scaling immediately. First, test a couple of new creatives with stronger opening hooks before making bidding adjustments.
2. Check CTR – Is Your Creative Resonating?
A CTR below your industry median means your audience sees the ad but scrolls past it. The benchmark data shows a 12x spread between the highest- and lowest-CTR industries – which means creative effectiveness is not equal across categories, and your baseline expectation should reflect your vertical.
Do this: If your CTR falls below the industry benchmark, experiment with a stronger attention-grabbing opening in your next creative iteration. Lead with movement, a surprising visual, or a direct question in the first 2 seconds. Run it against your current best-performer for 7 days before concluding.
3. Cross-reference CVR – Where is the Real Leak? (CPC + CVR)
This is the most important diagnostic step. Utility Software pays the highest CPC ($1.22) in the dataset yet converts at 5.50%.
Do this: Calculate your CVR for the last 30 days. If it's below your industry median, audit your landing page for three things: load speed, offer clarity, and a single visible CTA. Fix the weakest one first before testing anything else.
4. Benchmark your CPA – Are You Profitable Relative To Your Vertical?
Travel stands at $66.54 CPA, while Food & Drinks comes in at $9.95. Measuring yourself against the wrong vertical will either create false confidence or unnecessary panic. The 750× spread between the highest and lowest CPA in this dataset makes cross-industry CPA comparisons meaningless.
Do this: If your CPA is more than 30% above your industry median, don’t cut the budget immediately. First, check whether the issue is CTR, CVR, or both. Reduce the budget only after confirming the funnel is the problem, not the creative.
5. Set Realistic Expectations Based On Your Category Type
The benchmark data reveals three distinct campaign types on TikTok. Knowing which one you’re in determines what you should be optimizing for and what you shouldn’t expect.
If you’re a high-consideration vertical optimizing for immediate purchase conversions, restructure your campaign objective to lead generation or landing page views first, then retarget that audience with a conversion campaign separately. Trying to drive direct conversions from cold traffic in a high-consideration category is the most common reason CPA benchmarks look unachievable.
TikTok Ads Benchmarks by Country
The industry medians reflect global averages, which is a strong baseline for understanding overall performance patterns across TikTok Ads. Country-level benchmarks show you how the same industry performs in your specific market, helping you plan campaigns with sharper, audience-led precision.
Use the dropdown below to filter by industry and country to see how the benchmarks shift for your target audience.
| Median spend | $3,597 |
| Median clicks | 5,012 |
| Median impressions | 369,124 |
| Conversion | 94 |
Showing 196 industry-country combinations across all industries. Some countries may show partial data — metrics not available for a combination are not displayed.
How to Plan Your Next TikTok Ads Campaign?
Here’s how you can plan your next TikTok Ads campaign using the benchmark data:
Set your budget against your industry: Most campaigns underperform because they’re underfunded relative to their vertical, not because the creative is weak. Use your industry's median spend as your baseline. Set your daily budget at a minimum of 1.5× your target CPA, or the algorithm won't have enough conversion data to optimise.
Define KPI targets before you launch:
- CPC above your industry range → it's a creative problem
- CVR below your industry range → it's a post-click problem
Knowing which one before you start saves weeks of misdiagnosed optimization.
Match your campaign objective to your category type: High-consideration advertisers running conversion objectives against cold traffic will always find their CPA unachievable. Fewer than 1.1% of clicks convert immediately in Travel, Real Estate, and Franchising. The sequence that works: lead generation first, retargeting conversion campaign second.
Don’t make budget decisions based on week one data: The learning phase is still active and CPA is unreliable. Follow the checkpoint logic:
- Week 1 → read creative signals only
- Week 2 → Diagnose funnel performance
- Week 3 → scale or restructure based on real data
Now you have the benchmarks. What you need next is your own data alongside them. Two Minute Reports gives you TikTok Ads analytics and reporting with native ChatGPT and Claude integration – analyze insights faster and know exactly which lever to pull next. Try it free for 14 days.
Frequently Asked Questions
Based on 2025 median data, a good CPC on TikTok Ads sits below $0.25 for efficient industries. If your CPC is above $0.55, you're in premium territory — typically seen in high-consideration verticals like Travel, Professional Services, and Electronics & Electrical, but also in high-volume categories like Telecommunications ($0.72), where strong competition drives up costs even at scale.
A CPA above your industry median typically points to one of two problems: a traffic cost issue (high CPC, low CTR) or a post-click issue (low CVR). Check your CTR against your industry benchmark first. If CTR is healthy but CVR is low, the problem is your landing page, not your ad. If both are weak, address creative before increasing spend.
Yes, but not for direct conversion campaigns. In 2025, Travel and Real Estate posted CVRs of 1.04% and 5.45%, respectively, meaning immediate conversions from cold traffic are difficult in these categories. The most effective approach for these verticals is a two-stage strategy: run reach or lead generation campaigns first to build a warm audience, then layer retargeting conversion campaigns on top.
A CVR above 6% is considered strong on TikTok Ads, and above 8% is exceptional. The majority of advertisers,12 out of 27 industries, fall between 3% and 8%, making that the realistic benchmark range for most campaigns. Eight industries sit below 3%, including FMCG, Retail, Clothing, and Consumer Electronics, reflecting longer purchase journeys or weaker post-click alignment. Industries like Primary Sector (18.95%), Games (14.91%), Franchising (14.64%), significantly exceed the typical range due to frictionless conversion paths and fast decision cycles.
The median CTR across TikTok Ads industries in 2025 ranges from 0.22% to 2.59%. Most industries fall between 0.40% and 0.60% – 12 out of 27 industries land in this band, making it the most common engagement range on the platform. A CTR above 1% is considered strong; only three industries reached it – Internet Finance (1.36%), Transport (1.62%), and Consumer Electronics (2.59%). Travel, Telecommunications, and Franchising consistently posted the lowest CTRs, reflecting longer decision cycles and lower immediate click intent.