
Summarize this blog post with:
If you can’t identify where your TikTok funnel breaks, you can’t scale it.
CPM explains cost pressure. CTR signals creative resonance. ROAS reflects overall profitability. Without analyzing these metrics in sequence, performance issues get misdiagnosed, and the budget gets burned chasing the wrong fix.
Many campaigns are paused or scaled prematurely because metrics are reviewed in isolation rather than as part of a funnel. A rising CPA might be a creative problem. Or it could be attribution settings, audience saturation, or a weak post-click experience. Without structured TikTok Ads analytics, decisions become reactive.
The difference between advertisers who grow on TikTok and those who stall comes down to analytical clarity.
In this guide, I’ll walk you through how to effectively use TikTok Ads analytics to measure and interpret your campaign performance. Plus, you’ll get access to free TikTok Ads templates that help you move forward with accuracy and precision.
Let’s get started.
What are TikTok Ads Analytics?
TikTok Ads Analytics is the data that shows whether your paid campaigns are actually working.
When you run ads on TikTok, the platform tracks how often your ads are shown, how people interact with them, how much you spend, and whether those interactions turn into conversions or revenue. This performance data lives inside TikTok Ads Manager and helps you understand what is driving results and what is wasting budget.
At its core, TikTok Ads Analytics answers three questions:
- Are people seeing your ads efficiently?
- Are they engaging with your creative?
- Are those engagements turning into profitable outcomes?
Together, the answers to these questions provide a full picture of how your paid funnel is performing.
Why TikTok Ads Analytics Is Different From Other Platforms?
TikTok distributes ads inside a content feed optimized for entertainment. Users are not searching for solutions. They are scrolling. That means performance depends less on keyword intent and more on whether your creative earns attention fast enough to justify staying in the feed.
This created three structural differences in how analytics behaves on TikTok, and connecting the right dots helps you measure ROI with precision.
1. Creative Performance Directly Influences Cost Efficiency
On TikTok, engagement signals such as watch time, early video retention, and interaction rate directly influence the ad auction. High engagement creatives earn more favourable delivery from the algorithm, which reduces CPMs. Weak creatives don’t just underperform. It actively increases the cost to reach the same audience.
On search platforms, cost efficiency is driven primarily by bid competition and Quality Score. On TikTok Ads, cost efficiency is tied directly to engagement quality – which means your creative is your bid strategy.
2. Top-of-Funnel Signals are Leading Indicators
Metrics like 2-second views, 6-second views, and average watch duration are among the strongest early predictors of whether a campaign will scale. TikTok’s algorithm now priortizes the first six seconds of a video above almost any other signal when deciding how aggressively to distribute an ad.

If users drop off in the first two seconds, conversion metrics will likely suffer downstream because the algorithm interprets early drop-off as a signal to reduce distribution before the ad even reaches users likely to convert.
That said, early retention should always be read alongside targeting quality, bid strategy, and post-click experience. Drop-off alone doesn’t tell the full story. It tells you where to look first.
3. Optimization Cycles Move Faster
Because delivery is algorithm-driven and engagement sensitive, performance on TikTok Ads shifts quickly. Creative fatigue appears sooner. In practice, TikTok fatigue often sets in 4X faster than Meta. At scale, creative refresh cycles may be needed every 3-7 days to maintain efficiency.
Therefore, monitor TikTok Ads analytics sequentially from delivery to engagement to conversion rather than judging purely on ROAS.
Note: TikTok now offers Search Ads, where users actively search for topics, which means these ads carry stronger intent than regular In-Feed Ads. If you are running both, always segment reporting by placement before making optimization decisions.
Misreading TikTok data mostly happens when advertisers apply a Google or Meta lens to it. The metrics look familiar, but not the platform logic. TikTok Ads requires analyzing how attention quality impacts conversion efficiency across the full funnel. Not just how many clicks were generated.
The sequencing matters: Delivery → Engagement → Conversion → Revenue. Each stage gates the next. That is the analytical framework TikTok rewards you.
Who Can Use TikTok Ads Analytics?
TikTok’s data suite has evolved to serve three distinct business profiles, each with its unique “North Star” metrics.
Where to Access TikTok Ads Analytics?
You can access TikTok Ads Analytics in two ways:
- Native dashboard – TikTok Ads Manager
- Third-party reporting tools, such as Two Minute Reports
Method 1: TikTok Ads Manager (Native Dashboard)
You can track and visualize your ad performance on your TikTok Ads Manager dashboard. Here’s how:
1. Create your TikTok Ads account: http://ads.tiktok.com/business/en/solutions/ads-manager.
2. Once you’ve logged in, you can see three options: Dashboard, Campaigns and Analytics.

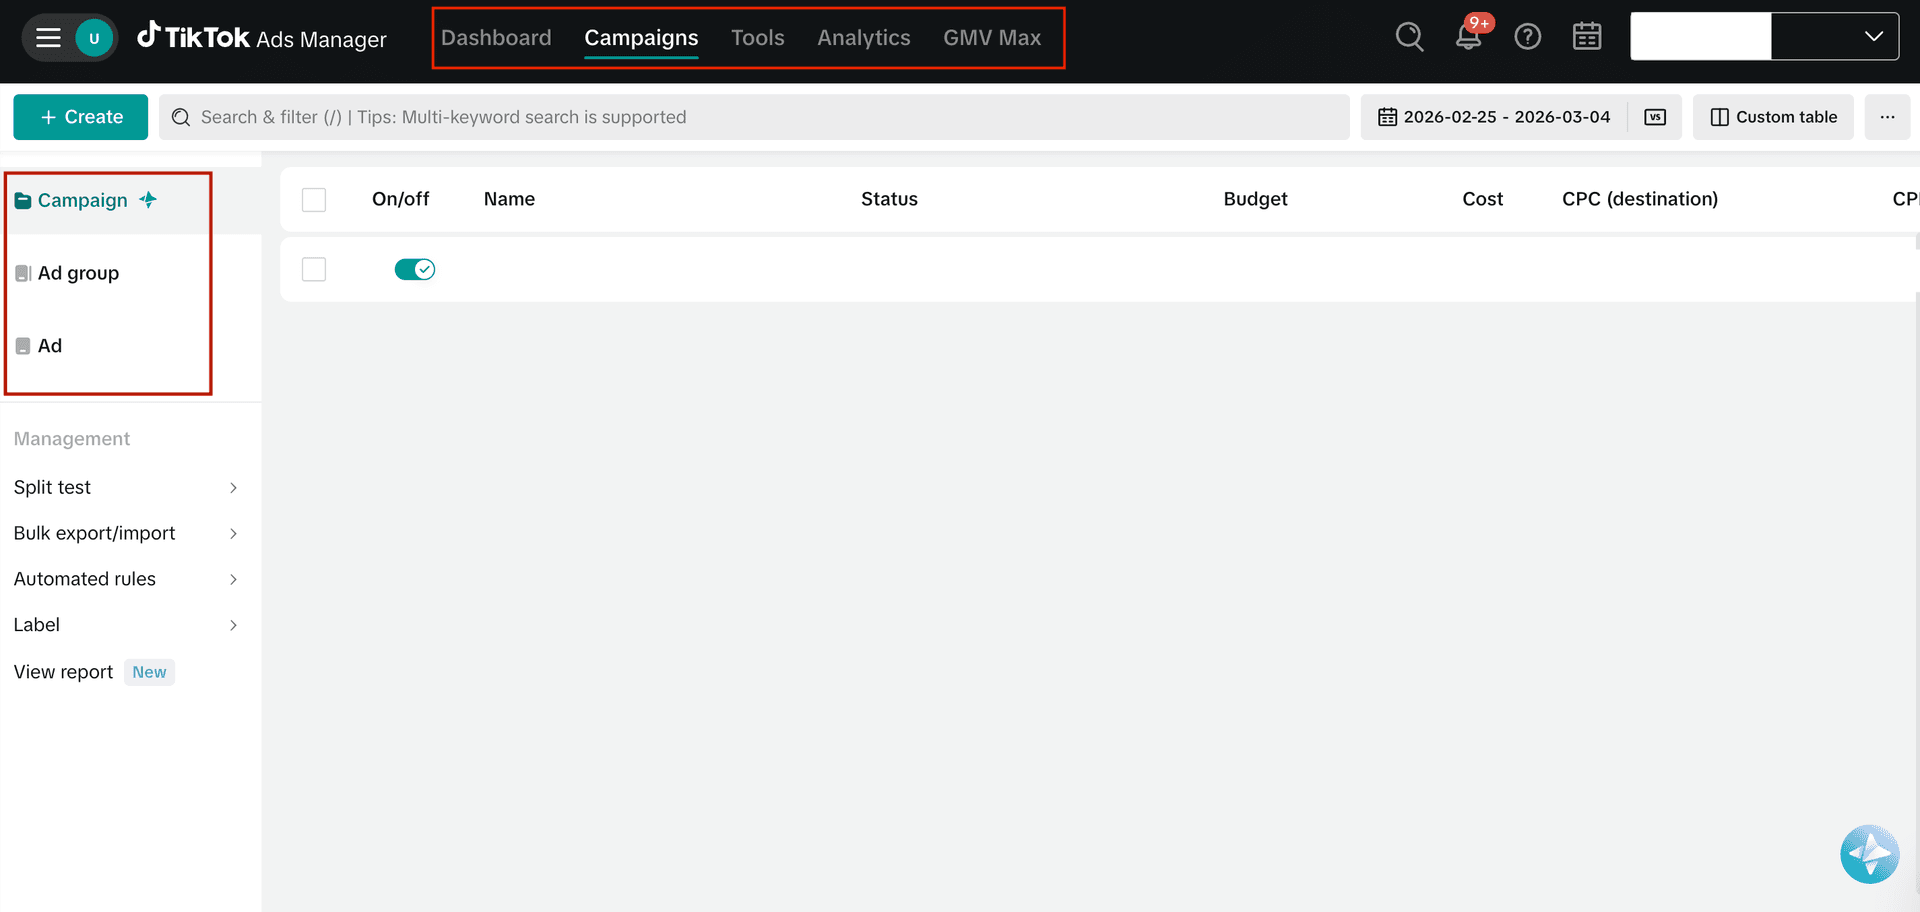
3. In the Dashboard section, you can visualize: Account Overview, Ad group status, Performance, Insights, and Log.
4. The Campaigns tab lets you track the status and key metrics associated with your TikTok Ads campaigns, such as CPC, CPM, Impressions, etc.
5. When you switch to the Analytics tab, you’ll see a dropdown with different report types – Custom reports, Attribution analytics, Audience insights, Comment insights, Creative Inspirations, and Video Insights. You can choose the report type and analyze your performance insights.
Method 2: Two Minute Reports (Dedicated TikTok Ads Reporting Tool)
Marketers and agencies need a centralized dashboard to track, analyze, and report on their clients’ TikTok Ads campaigns. Native analytics works well, but it becomes complex for teams managing 10 or 100+ accounts.
This is where you need a reliable TikTok Ads reporting tool, such as Two Minute Reports, to manage and automate reporting in one place. Here’s how:
What can you do with Two Minute Reports?
- Extract TikTok Ads metrics and dimensions in a single dashboard.
- Build custom, white-label dashboards for your clients and stakeholders.
- Automate the delivery of performance reports to multiple clients in your preferred format.
- Load the TikTok Ads dashboard 5X faster with exclusive Speedboost technology.
- Compare performance across accounts, ad groups, and ad levels for clients.
- Visualize unified ROI by comparing TikTok Ads with other PPC platforms.
- Build TikTok Ads reports faster with easy-to-use templates.
Now that you understand how to access TikTok Ads analytics, it's important to know which key metrics make the difference. Let’s have a look at it in the next section.
10 Important TikTok Ads Metrics To Optimize Your Campaign Performance
Here, let me highlight the top 10 TikTok Ads metrics based on the following categories:
- Delivery Stage
- Engagement Stage
- Conversion Stage
- Revenue Stage
Delivery Stage – Are We Reaching the Right Audience?
1. TikTok Spend:
What it measures: Total Ad spend during the selected period.
Why it matters: Spend amplifies results, whether good or bad. Never scale your ad spend unless your downstream metrics like Conversion Rate and ROAS are stable.
2. Profile Visits
What it measures: Number of users who visited your profile after seeing or interacting with your ad.
Why it matters: Signals mid-funnel curiosity. High-profile visits with weak conversions may indicate users are validating brand trust before buying.
Engagement Stage – Is the Creative Holding Attention?
3. Average Video Watch Time Per Video View
What it measures: Average duration users watch your video ad.
Why it matters: Retention strength predicts delivery efficiency. Low watch time usually leads to weaker algorithmic distribution and higher CPM.
4. 6-Second Views
What it measures: Number of viewers who watched your video ad for 6 seconds.
Why it matters: This tests your hook. If users don’t stay for 6 seconds, scaling becomes difficult regardless of targeting.
5. Video Views at 75%
What it measures: Number of viewers who watched at least 75% of your video ad.
Why it matters: Indicates alignment with messaging intent. However, strong 75% views with weak conversions often shift the issue to offer or landing page frictions.
6. Engagement Rate
What it matters: Percentage of impressions that resulted in interaction with your video ad (likes, comments, shares, and clicks).
Why it matters: Engagement feeds the delivery algorithm. The higher the engagement, the more your ad gets into the sweet spot, signaling efficiency. However, if those interactions don’t convert into conversions, it might signal that your video is engaging but does not hold an effective purchasing intent.
Conversion Stage – Is the Traffic Converting?
7. Conversion Rate
What it means: Percentage of users who completed the desired action after clicking the link in your video ad.
Why it matters: The main purpose of your video ad is to bring in the users and convert them into paid customers. Ensure your creatives are strong and the offer is compelling enough to drive the desired action.
8. Cost Per Conversion
What it measures: Average cost required to generate one conversion.
Why it matters: Determines scalability. If it costs more to acquire conversions, your ad spend might get drained completely.
Revenue Stage – Is The Campaign Profitable?
9. Total Purchase Value
What it measures: Total revenue generated from tracked purchases.
Why it matters: Shows scale. High ROAS with low purchase value limits growth potential.
10. Complete Payment ROAS
What it measures: Revenue from confirmed completed payments divided by the ad spend.
Why it matters: Your most reliable profitability signal. Always validate this before increasing the budget.
Now that you understand why these metrics matter, let’s look at what advertisers assume the metrics to be and what they actually indicate:
How to Create a TikTok Ads Analytics Report?
In this section, let me explain the simple 5-step process to build TikTok campaign reports faster using Two Minute Reports.
Step 1: Identify Your Campaign Goal
Before you begin, identify what stage your campaign is in.
With a clear campaign goal, half of your job is done.
Step 2: Choose the Right Attribution Window
Attribution should match user behavior and campaign type.
- Click-Through Attribution: When a user clicks on your ad and completes the desired conversion action, it will be recorded as a click-through conversion.
- View-Through Attribution: When a user views and doesn’t click your ad, but later comes back and completes the conversion action, it is VTA. However, turning on VTA is highly recommended to capture the holistic value of your TikTok advertising.
- Engaged View-Through Attribution: When a user views a TikTok ad for 6 seconds or more and then completes the conversion action, it will be recorded as EVTA.
Note:
- Use View-Through Attribution for discovery campaigns.
- Use Click-Through Attribution for intent-driven campaigns.
- If you run both Search and In-Feed ads, segment reporting by placement.
Step 3: Connect Your TikTok Ads Accounts
- Install the Two Minute Reports add-on from the Google Workspace Marketplace.
- Connect your TikTok Ads accounts by following the on-screen instructions to verify your credentials.
- Once connected, your campaign, ad group, and ad data will be synced automatically.
- Organize and map the right ad account with the right client in a single Google Sheets dashboard – easily switch between client accounts via a simple dropdown.


Step 4: Customize Your TikTok Ads Dashboard
- With Two Minute Reports’ TikTok Ads reporting templates, you can quickly build campaign dashboards tailored to your client’s goals and objectives.
- Customize your dashboards to create a detailed breakdown of Campaigns, Ad Groups, and Ads across different clients.
- Show clear funnel progression: Delivery → Engagement → Conversion → Revenue.
- Add week-over-week or monthly comparisons.
- Take full control of your TikTok Ads dashboard by including your agency’s logo, colors, and layouts to reinforce analytical expertise and credibility.
- Reuse your existing dashboards across multiple clients to improve reporting consistency.
Pro tip: With Two Minute Reports, you can customize your TikTok Ads dashboard to track and measure:
- Best and least performing campaigns to allocate budgets effectively.
- Which videos generated the highest views and retention?
- Understand who is converting and refine targeting based on age, country, language, device, placement, etc.
- Track live video engagement to understand whether it's influencing conversions.
- Monitor real-time app installs and post-install actions to ensure revenue growth is profitable.
- Measure revenue performance from TikTok Shop for GMV campaigns and validate scaling decisions based on real-time sales data.
- Track offline events to measure the impact of campaigns on in-store purchases, etc.
- Create cross-channel marketing reports by comparing TikTok Ads with other advertising channels to optimize resource allocation.
Step 4: Automate Your TikTok Ads Report
- Schedule your TikTok Ads report to be sent on desired intervals (hourly, daily, weekly or monthly).
- Automate reports across multiple clients with a single click and bid adieu to mismatched errors or broken reports.
- Automation ensures you speed up your workflow while simultaneously acting on what’s important to keep your campaigns running profitably.
Pro Tip: Handle high-volume TikTok Ads reporting across multiple clients without loading delays. With Speedboost, your reports load in under 5 seconds, ensuring seamless delivery and faster optimization cycles.
How to Analyze TikTok Ads Performance? (Step-by-Step Framework)
This 3-step process helps you diagnose TikTok Ads performance before making scaling decisions.
Step 1: Creative-level Analysis
Start with the ad itself. If attention fails, conversions will not occur.
Evaluate in this order:
- 6-Second Hold Rate → Is the hook stopping the scroll? A hold rate above 10% is the 2026 standard.
- Average Watch Time → Is the message holding attention?
- CTR → Is the creative compelling enough to drive action? The average CTR is 0.84%. Top-performing creatives hit at 2.5% or higher.
- 75% video views → Is the offer being fully communicated? TikTok tracks this as a standard video play metric. It is your signal whether the intended message lands properly.
If retention is weak, fix the hook before refining targeting. If engagement is strong but conversions are weak, the issue is likely post-click. Creative analysis prevents you from misattributing poor results to the audience or budget.
Step 2: Funnel-Level Diagnostics
Once the creative passes the attention test, analyze the funnel sequentially. Each stage gates the next.
Delivery → Engagement → Conversion → Revenue
This is the diagnostic sequence TikTok’s performance framework is built around.
- Rising CPM: Auction pressure from increased competition or declining creative relevance causes the algorithm to charge more for the same delivery. Diagnose the cause by checking whether CTR is also declining. If yes, it's a creative problem; if no, it’s a market cost pressure.
- Strong CTR but weak CVR: Landing page friction or offer mismatch. The ad is working. The post-click experience is not.
- Stable CVR but rising CPA: Creative fatigue or audience saturation. You are paying more to reach the same converting audience.
- Strong engagement but low ROAS: There are three potential causes: price resistance or margin compression on the offer; attribution gaps from an incorrectly configured Pixel or a post-click experience that converts at low order value.
Do not make scaling decisions without confirming which stage is the source of failure.
Step 3: Scale vs Refresh
Before increasing the budget or pausing campaigns, apply structured criteria.
Scale when:
- Conversion rate is stable for at least 3-7 consecutive days.
- CPA is within your allowable margin.
- 6-second hold rate and average watch time remain strong.
- ROAS is consistent, not a single-day spike.
- The ad set has completed its learning phase.
Refresh when:
- 6-second hold rate drops significantly below your baseline.
- CPA rises while CVR simultaneously declines.
- ROAS declines consistently over 3+ days with no recovery trend.
- Frequency climbs above 2.5x and engagement drops; your audience has seen the creative enough to stop responding.
Important: Scaling unstable campaigns amplifies inefficiency. Killing stable campaigns too early disrupts the learning phase and limits compounding growth. The cost of restarting a campaign and resetting delivery optimization from scratch is often higher than the cost of the short-term performance dip you were trying to avoid.
TikTok Ads Reporting Templates to Track and Optimize Your Performance
Now that you know how to analyze TikTok Ads performance, the next step is structuring that analysis into a reporting framework. The following TikTok Ads Looker Studio reporting templates help you create decision-ready dashboards faster.
1. TikTok Ads Overview Report

The TikTok Ads Overview Report gives you a clear, real-time snapshot of your campaign performance by consolidating cost, impressions, clicks, conversions, and results into one interactive dashboard. It helps you identify top-performing campaigns, align metrics with campaign objectives, and understand where the budget is generating the strongest returns.
With clear breakdowns across age, gender, device, and country, you can refine audience targeting to be actionable. Instead of manually filtering data, you can pinpoint high-converting segments and optimize campaigns with speed and confidence.
2. TikTok Ads Performance Overview Report

The TikTok Ads Performance Overview Report delivers a focused view of your most important KPIs, such as impressions, clicks, spend, cost per click, and cost per conversion to assess your campaign effectiveness. With built-in trend comparisons and visual charts, performance shifts and cost fluctuations become instantly visible.
3. TikTok Ads Overview – Campaign and Audience Info Report

The TikTok Ads Campaign and Audience Info report gives you a structured view of both campaign configuration and performance in one place. You can track costs, clicks, CPM, budget allocation, conversion, and campaign status over time, making it easier to evaluate whether campaigns are aligned with their objectives.
With detailed audience insights across country, gender, age, device, and ad-level impressions, you can understand who your ads are reaching and where the impact is strongest. A clear unified view supports smarter targeting and budget optimization decisions.
Wrapping Up
Measuring TikTok Ads analytics is about interpreting attention, intent, and conversion behavior in sequence. Because TikTok is creative-driven and algorithm-sensitive, even a small misread in attribution or placement logic can distort performance conclusions. A strong report doesn’t just show ROAS; it explains why ROAS moved.
With that said, keep the following factors in mind when preparing a TikTok Ads report for your client:
- Analyze creative retention before diagnosing targeting or budgeting issues.
- Segment Search and In-Feed placements before evaluating performance.
- Match attribution windows to campaign intent, not preference.
- Review metrics in the funnel order.
- Separate engagement quality from profitability, as they are not the same.
When this analytical structure is directly built into your reporting workflow, optimization becomes faster and more reliable. A PPC reporting software such as Two Minute Reports helps you streamline, coordinate, and automate your TikTok Ads campaign performance in one place, acting as a single source of truth for data-driven decision making.
Try Two Minute Reports free for 14 days and experience faster, automated TikTok Ads reporting built for scalable performance analysis.
Frequently Asked Questions
TikTok Ads Analytics is the data that shows how well your paid campaigns are performing on TikTok. It tracks ad visibility, user interactions, spending, and whether those interactions lead to conversions or revenue.
TikTok Ads Analytics is all about understanding how engaging your creative content is, rather than focusing on keyword searches. Since users are primarily scrolling for entertainment, the effectiveness of your ads is closely tied to how well they capture attention, which directly impacts costs and ad delivery.
You can easily access TikTok Ads Analytics through the TikTok Ads Manager or by using third-party reporting tools like Two Minute Reports. This allows you to track your ad performance efficiently in Google Sheets or Looker Studio and gain valuable insights.
Building a TikTok Ads report is straightforward. Begin by defining your campaign objective. Then, choose an appropriate attribution window that aligns with user behavior. Customize your dashboard to showcase the key performance indicators you want to track. Finally, set up automated report delivery so you can stay updated without the hassle of manual checks.
While traditional PPC channels like Google Ads focus on intent-driven metrics, TikTok Ads require deeper evaluation of creative retention, engagement signals, and view-through attribution. Integrating TikTok Ads performance into a wider PPC analysis framework helps marketers compare cost efficiency, conversion behavior and attribution across channels.
Related Blogs


Meet the Author
Shalini MuruganShalini is driven by ideas that create a tangible impact. At Two Minute Reports, she specializes in content that helps marketers optimize their reporting workflows. When she's not transforming complex data into meaningful insights, you might find her lost in a book, jotting down ideas in her notebook, or connecting the dots others overlook.
