
Summarize this page with:
Explore Google Ads benchmarks across 25 industries using six key advertising metrics. These benchmarks are based on the median Google Ads performance recorded between January 1 and December 31, 2025. You'll also find practical insights to help interpret each metric and improve your Google Ads performance.
Google Ads Benchmarks: Key Takeaways
Before diving into the benchmarks, here are the patterns that stood out across the data.
- Cost benchmarks: Median CPC ranges from $0.23 to $4.57, while median CPA spans $3.62 to $59.07. The wide range shows that advertising costs can differ substantially by industry.
- Engagement benchmarks: Median CTR ranges from 1.75% to 7.52%, while median conversion rates vary from 2.61% to 13.90%. Compared to cost metrics, engagement metrics were relatively more consistent.
- Visibility benchmarks: Median CPM ranges from $8.13 to $153. The difference between the lowest and highest median CPM highlights how widely impression costs can vary across industries.
- ROAS benchmarks: Median values span from 0.15x to 7.62x, highlighting that campaign profitability should always be assessed within the context of your industry.
What Google Ad Benchmarks Are We Comparing?
To give you a complete picture of Google Ads performance, we compared six core Google ad metrics across 25 industries.
- Click-Through Rate: Measures the percentage of people who clicked your ad after seeing it, helping you understand how well your ads attract attention.
- Cost Per Click: Shows the amount paid for each click, making it easier to compare click costs across industries.
- Cost Per Mille (CPM): Measures the average cost of 1,000 ad impressions, helping you compare how much it costs to reach audiences across different industries.
- Conversion Rate: Measures the percentage of clicks that resulted in a conversion, indicating how effectively your ad traffic turns into desired actions.
- Cost Per Acquisition: The amount paid to acquire one customer, helping you evaluate how efficiently your advertising budget generates results.
- Return on Ad Spend: Measures the revenue generated for every dollar spent on advertising, making it easier to compare advertising returns across industries.
Google Ads Benchmarks by Industry
The following sections break down each benchmark by industry, making it easier to compare campaign performance.
Google Ads CTR Benchmarks By Industry
Median CTRs were relatively consistent, with most industries recording between 2.01% and 4.75%. A small group of industries outperformed the rest. Energy, Utilities & Agriculture recorded the highest median CTR at 7.52%, while Hospitality, Travel & Tourism (5.47%) and Nonprofit & Public Sector (5.28%) were the only other industries to exceed 5%.
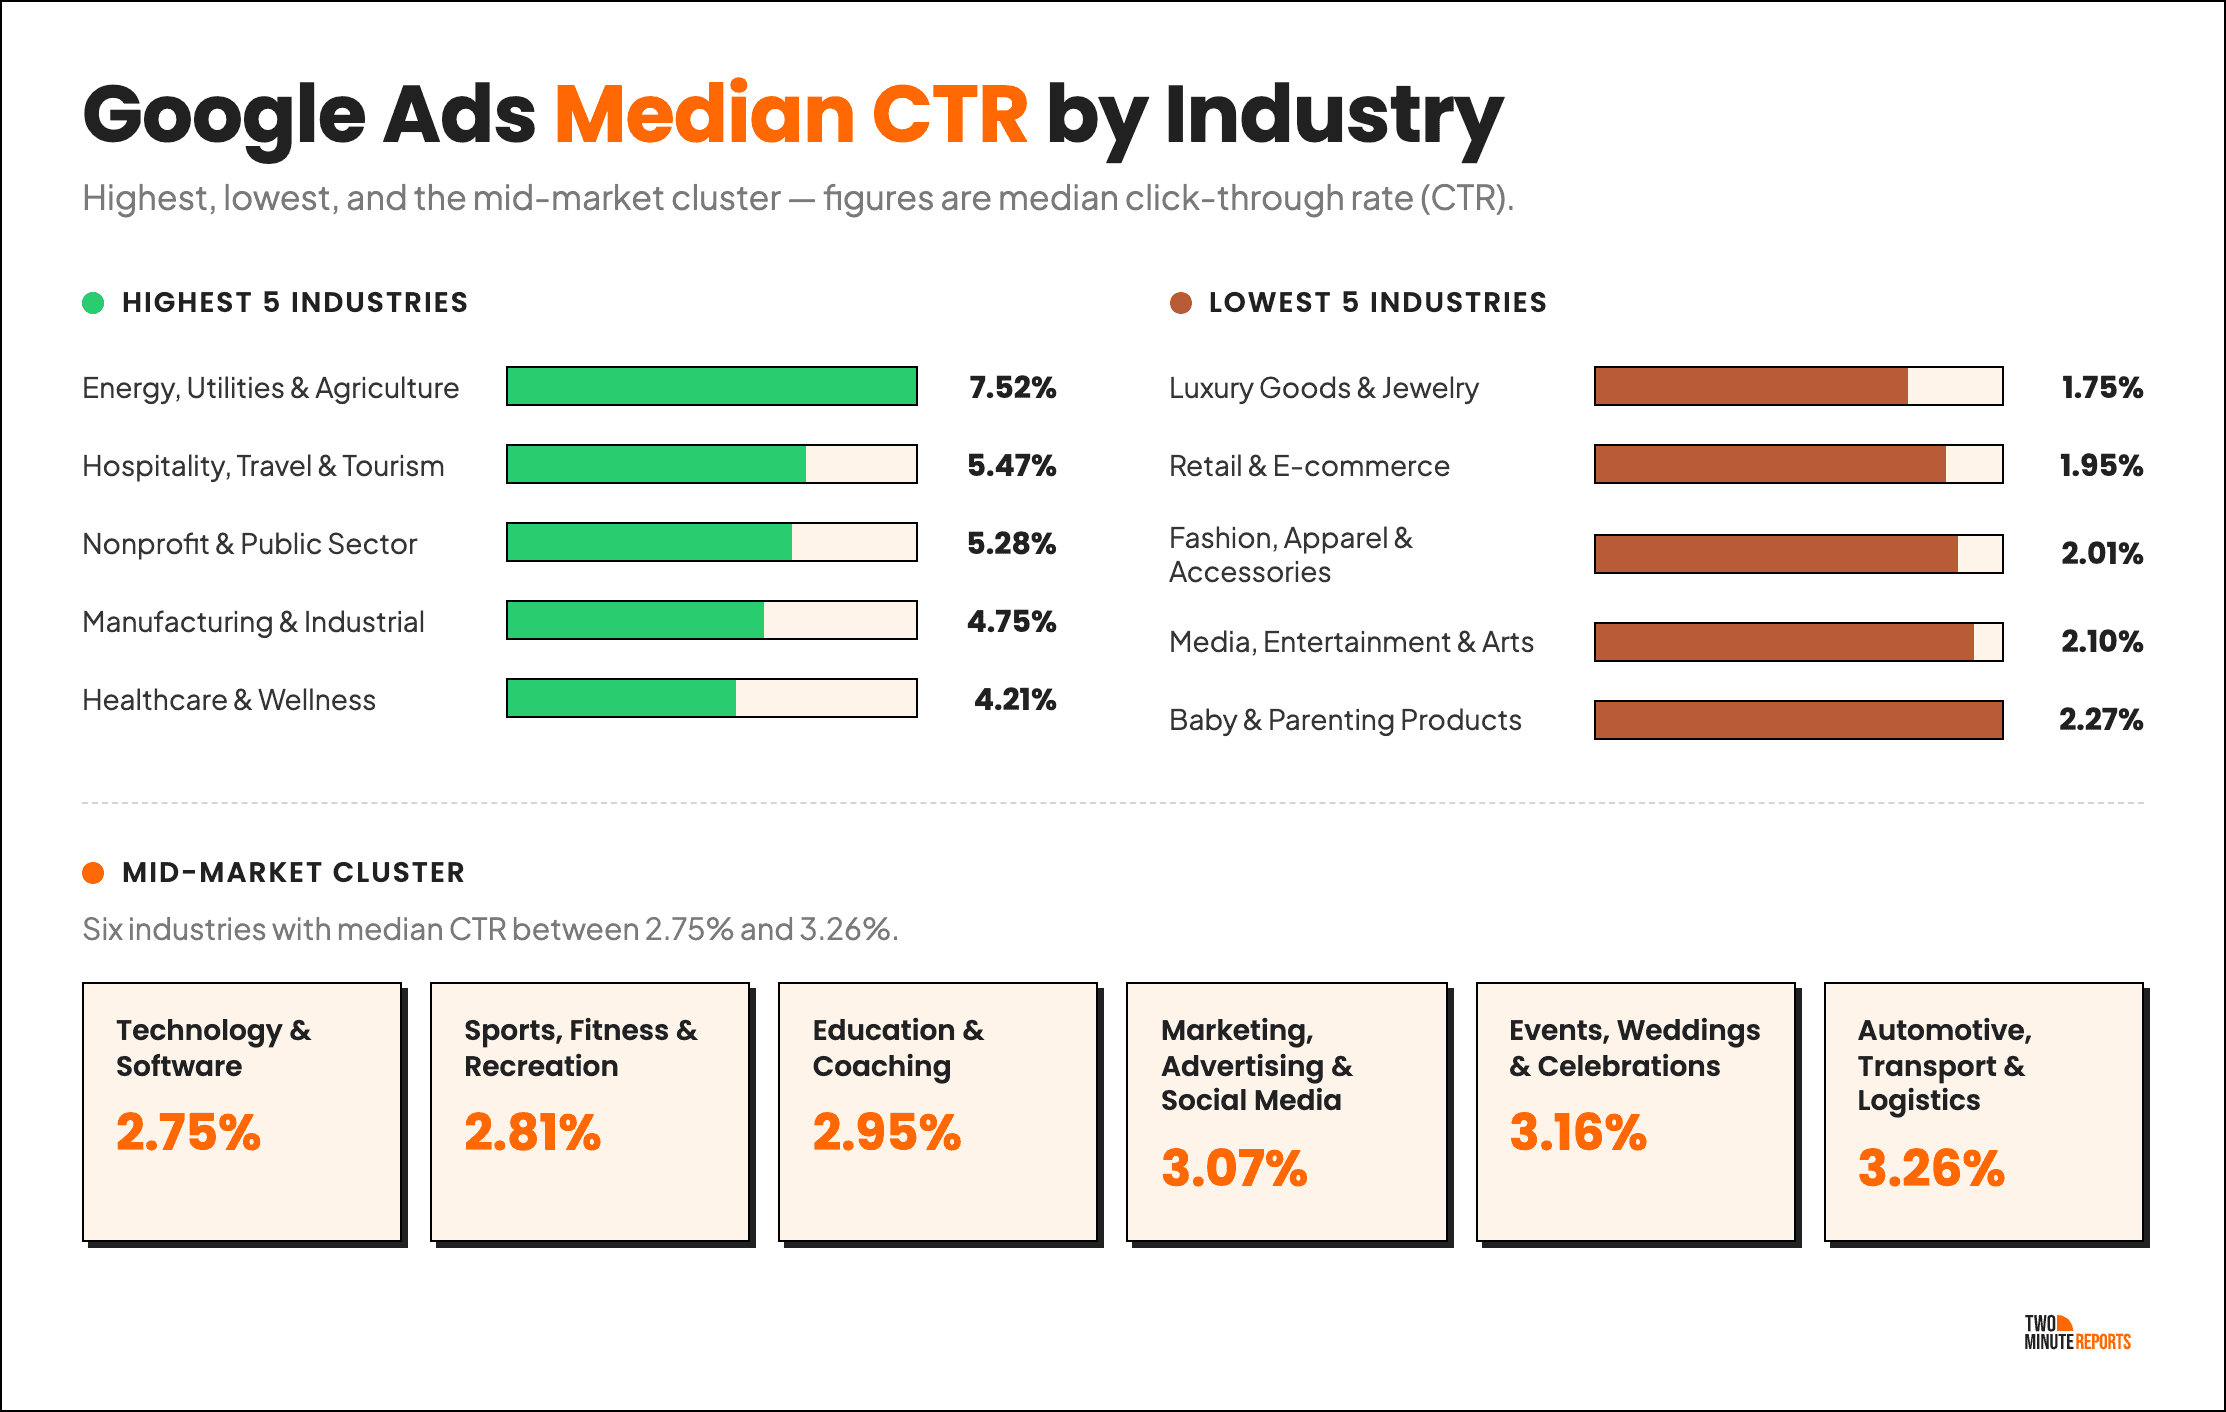
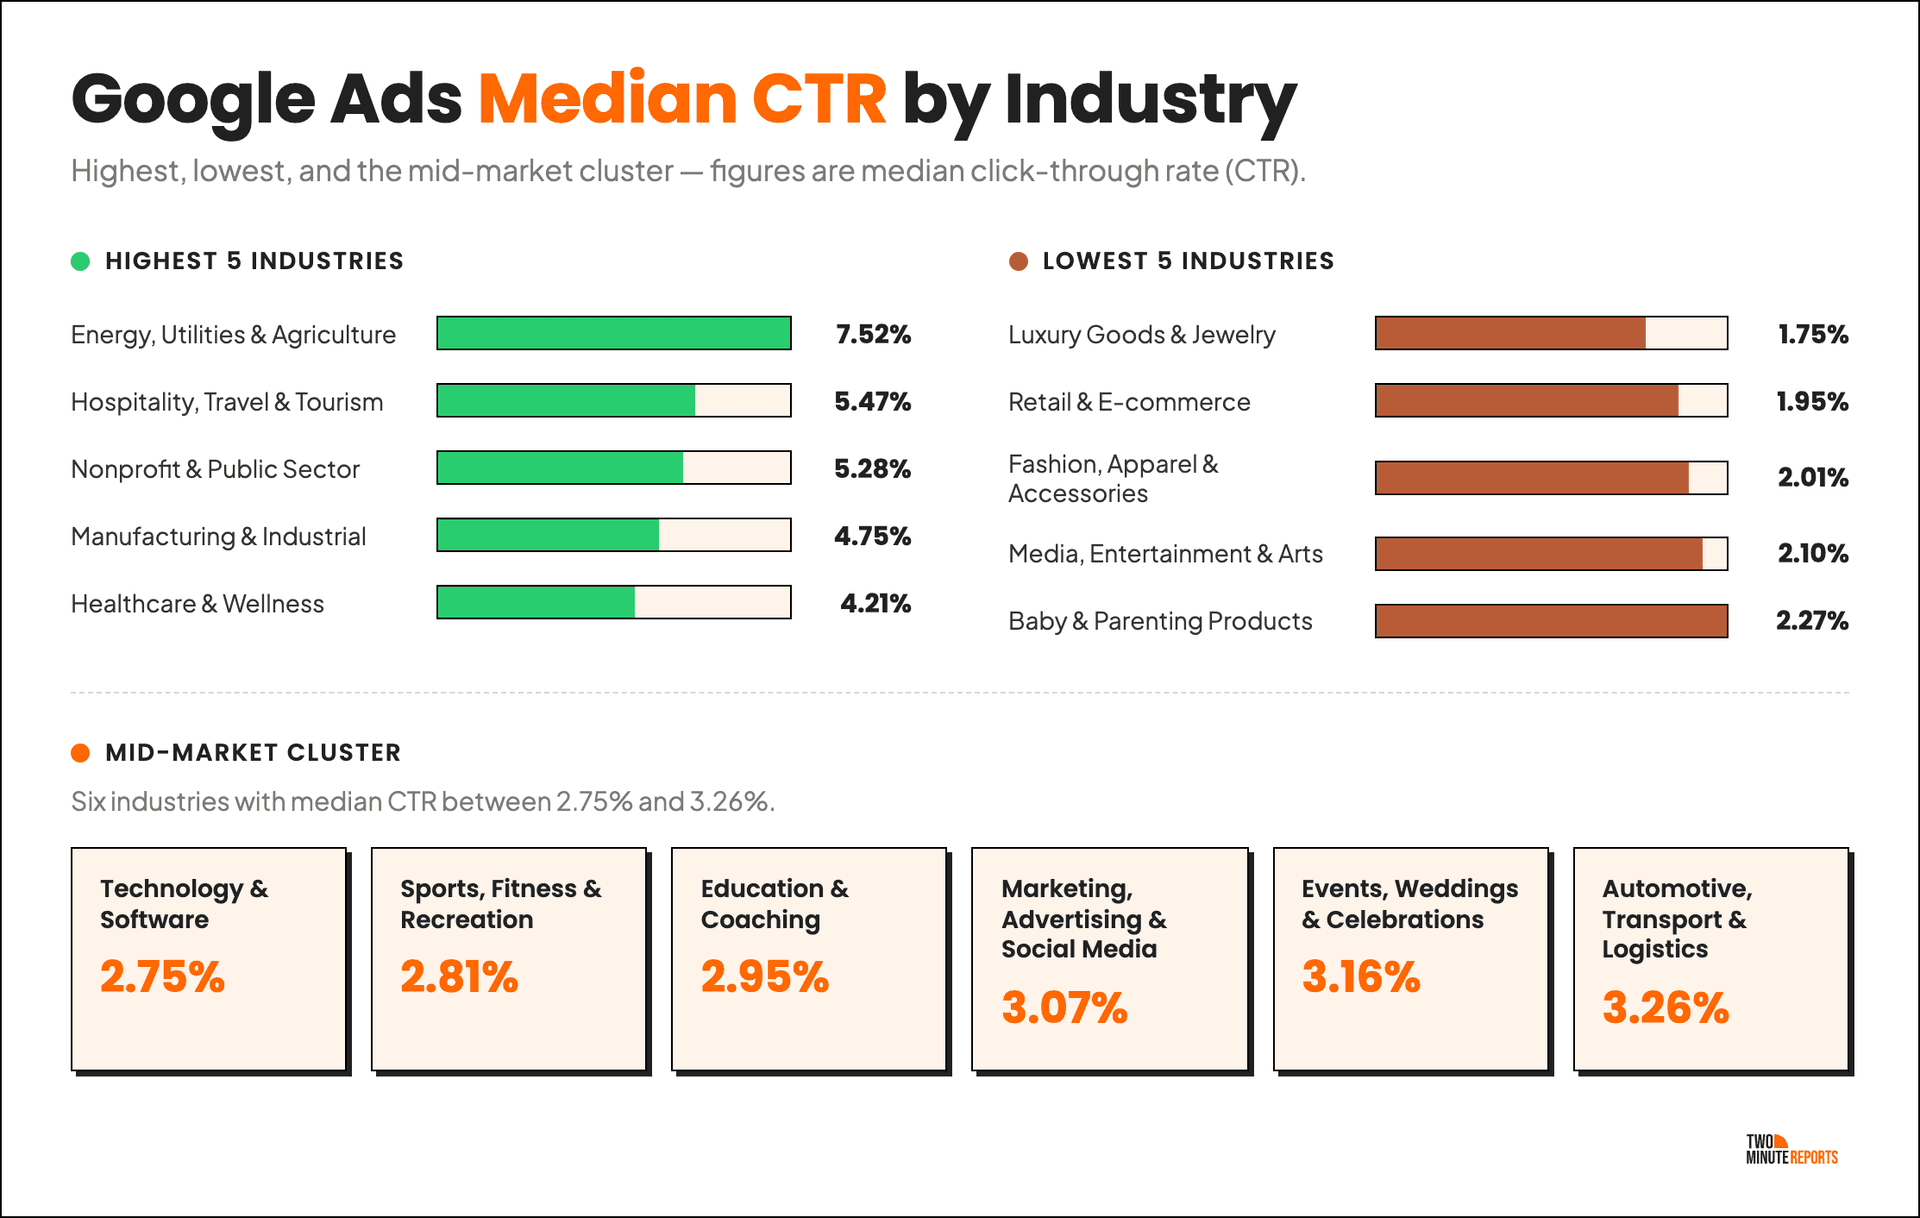
However, Luxury Goods & Jewellery (1.75%) and Retail & Ecommerce (1.95%) recorded median CTRs below 2%. The remaining industries were clustered between these two extremes, reinforcing that most industries operated within a relatively narrow CTR range.
Google Ads CPC Benchmarks By Industry
Median CPCs remained below $1.00 for most industries. Sixteen of the 25 industries recorded a median CPC under $1.00, indicating that relatively low click costs were more common.
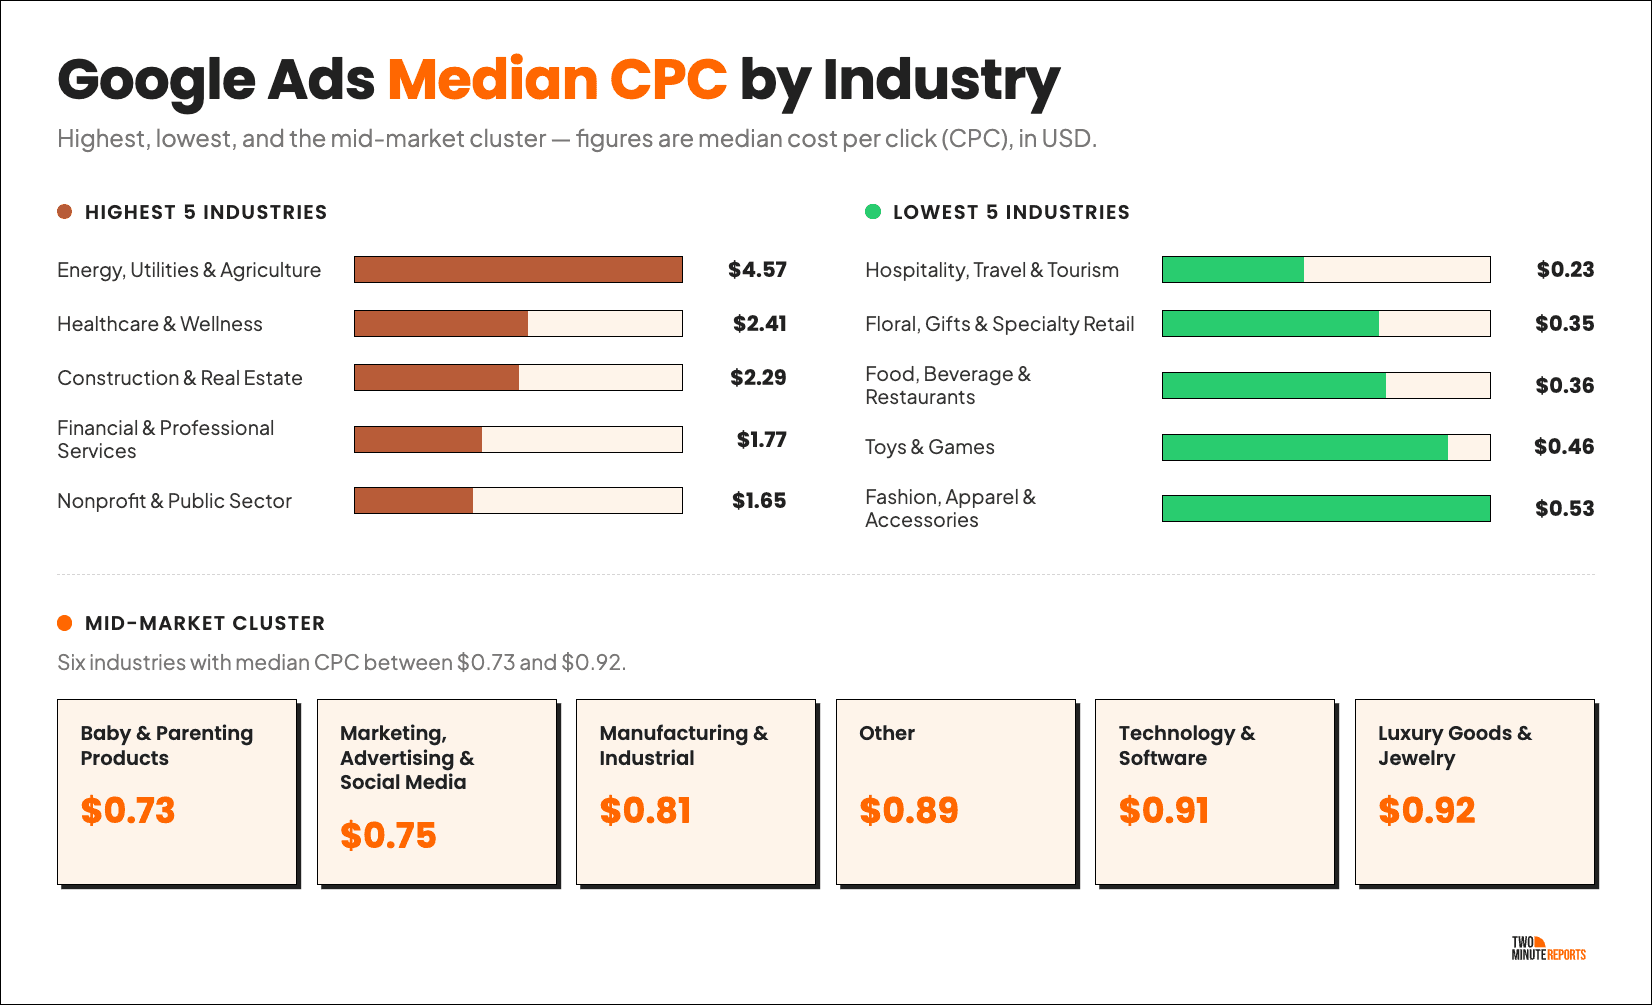
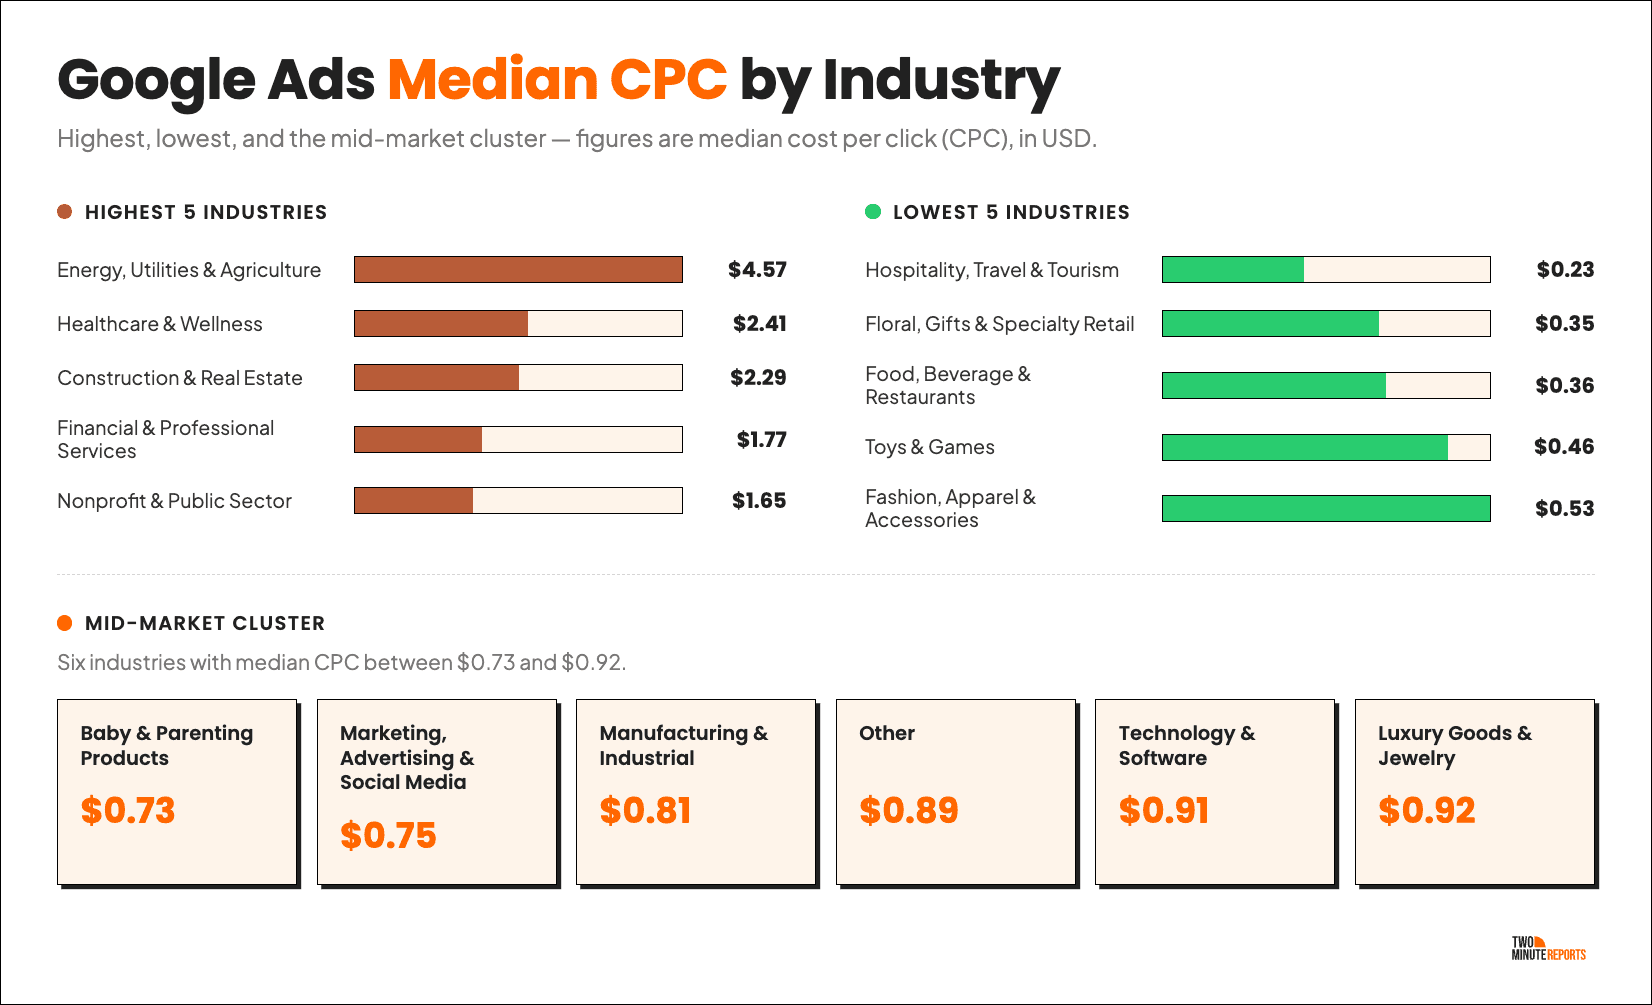
Higher click costs were concentrated in a small group of industries. Energy, Utilities & Agriculture recorded the highest median CPC at $4.57, while Healthcare & Wellness ($2.41) and Construction & Real Estate ($2.29) were the only other industries above $2.00. Hospitality, Travel & Tourism recorded the lowest median CPC at $0.23, followed by Floral, Gifts & Speciality Retail ($0.35) and Food, Beverage & Restaurants ($0.36).
Google Ads CPM Benchmarks By Industry
Most industries recorded median CPMs below $40. Construction & Real Estate ($81.84), Healthcare & Wellness ($88.42), Financial & Professional Services ($89.75), and Nonprofit & Public Sector ($153.23) stood noticeably above the rest.
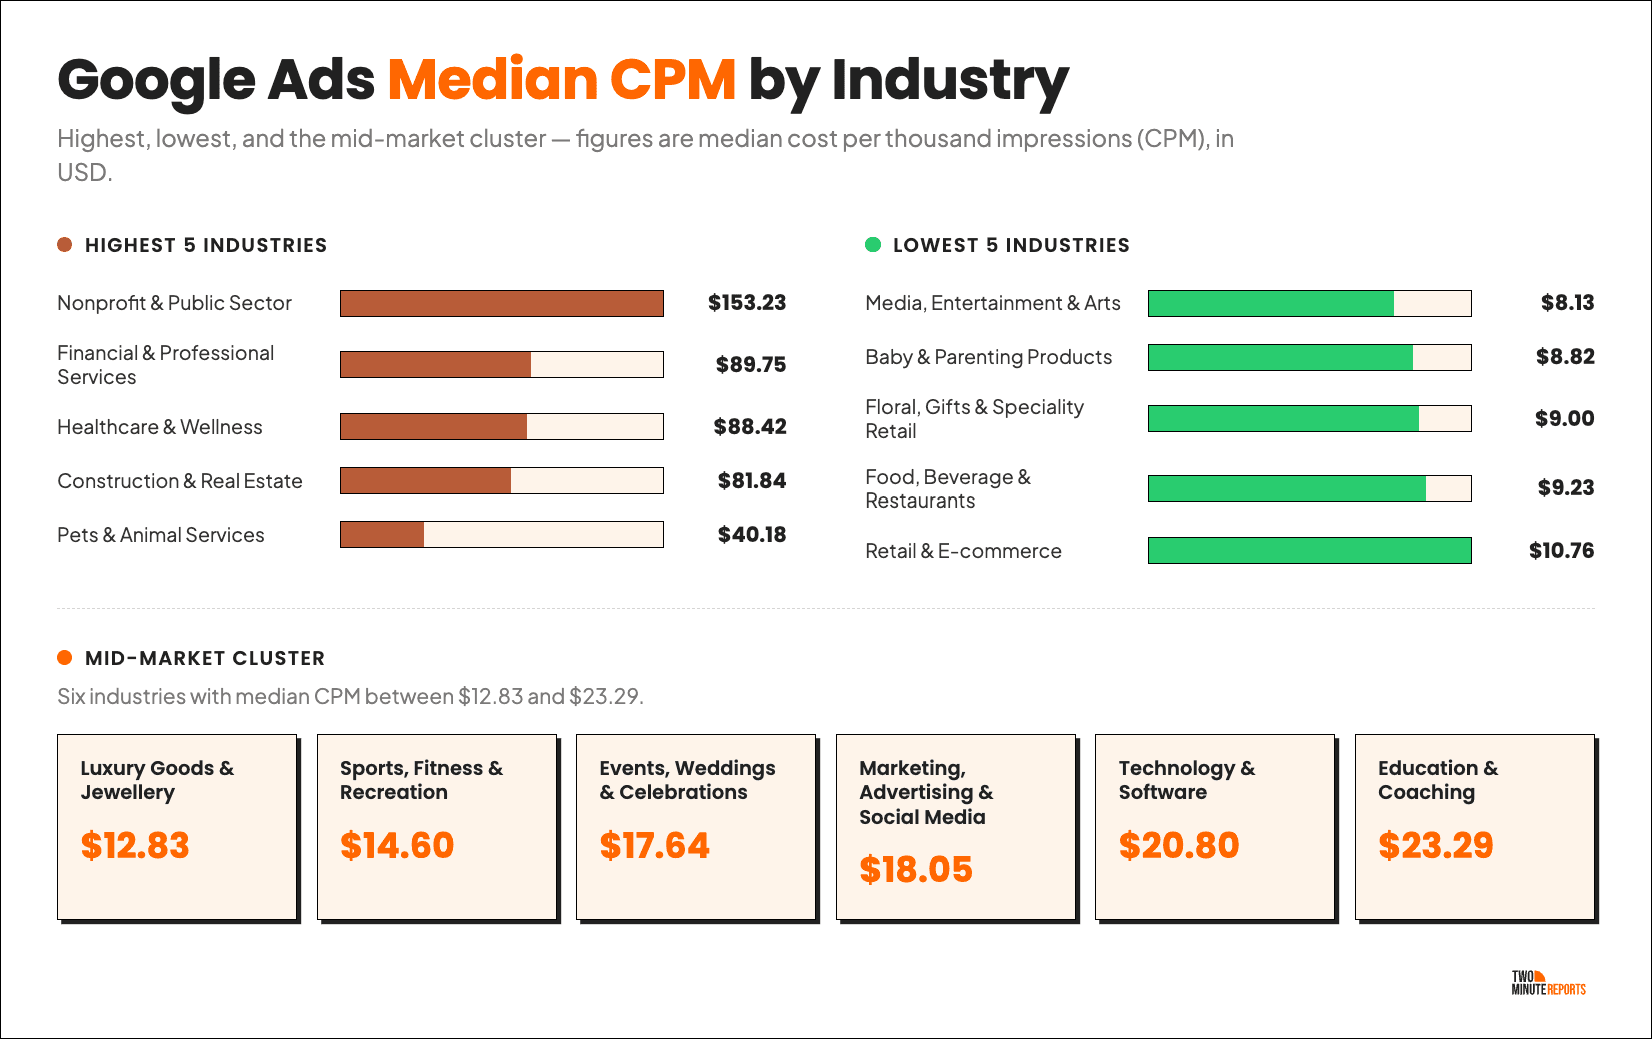
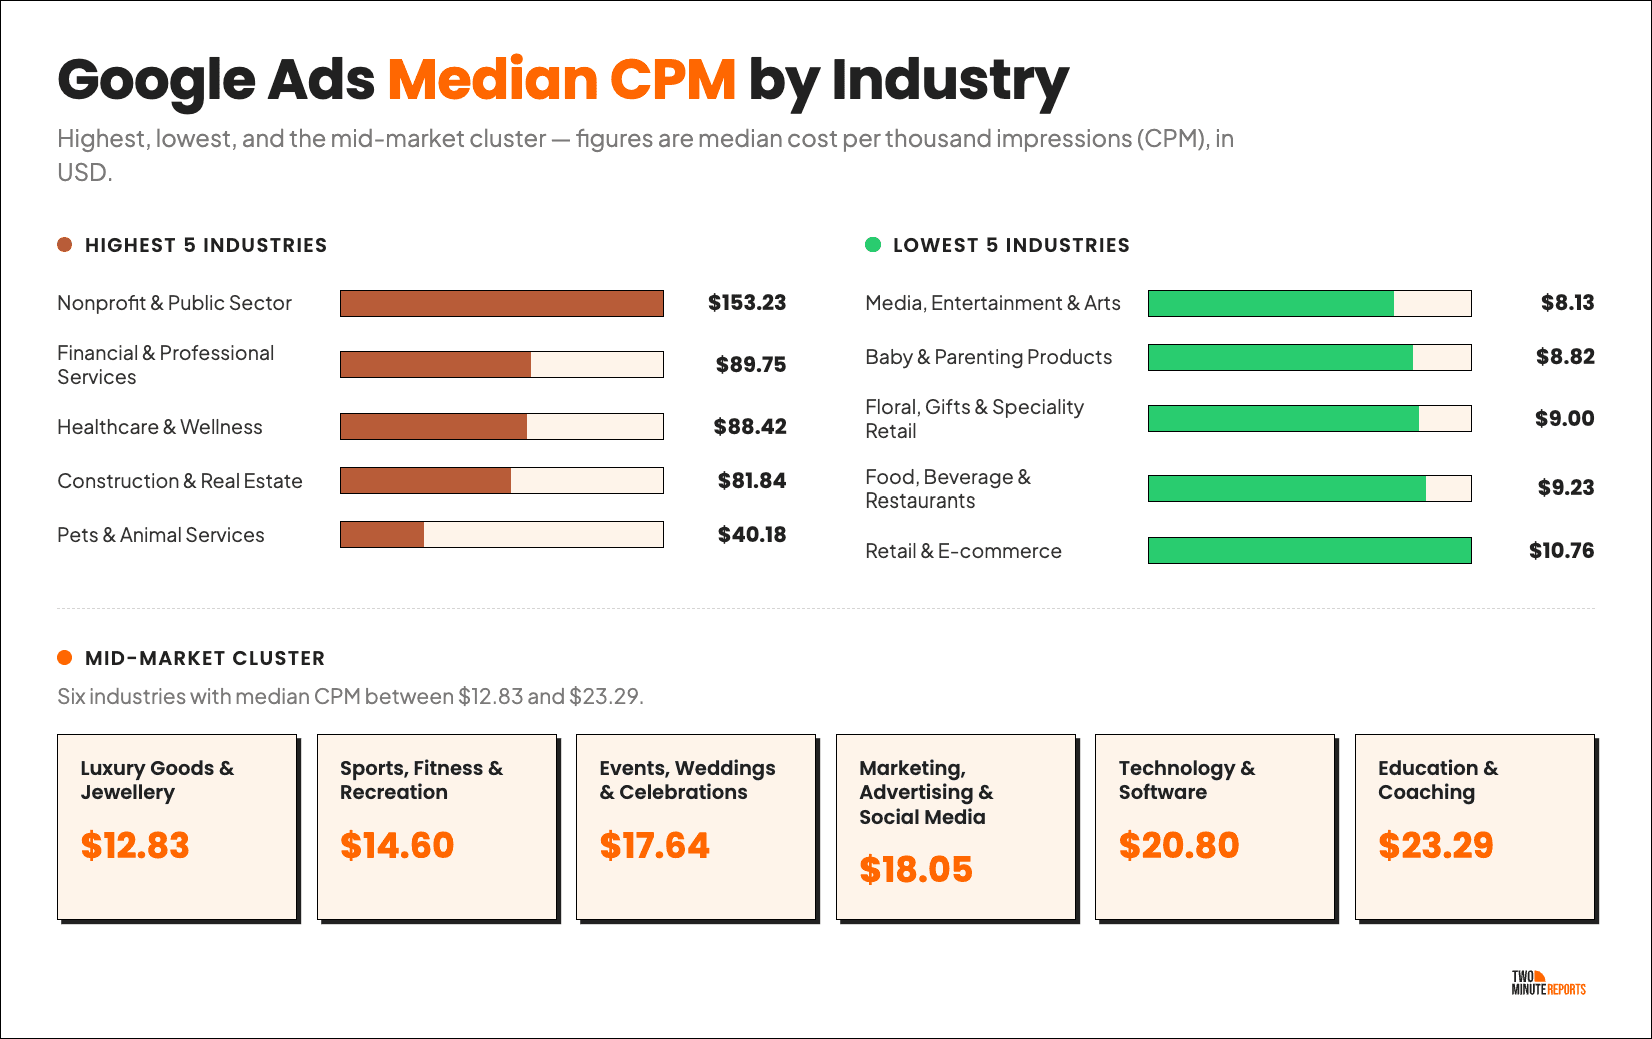
Higher CPMs don't automatically indicate inefficient campaigns; they often mean advertisers are paying more to compete for their target audience. In these industries, improving click-through rate and conversion rate becomes even more important because every 1,000 impressions costs significantly more than in other sectors.
Google Ads CPA Benchmarks By Industry
CPA is one of the most context-dependent metrics in Google Ads. Unlike CTR or CPC, there's no universal “good” CPA because it depends on the value of each conversion to your business.
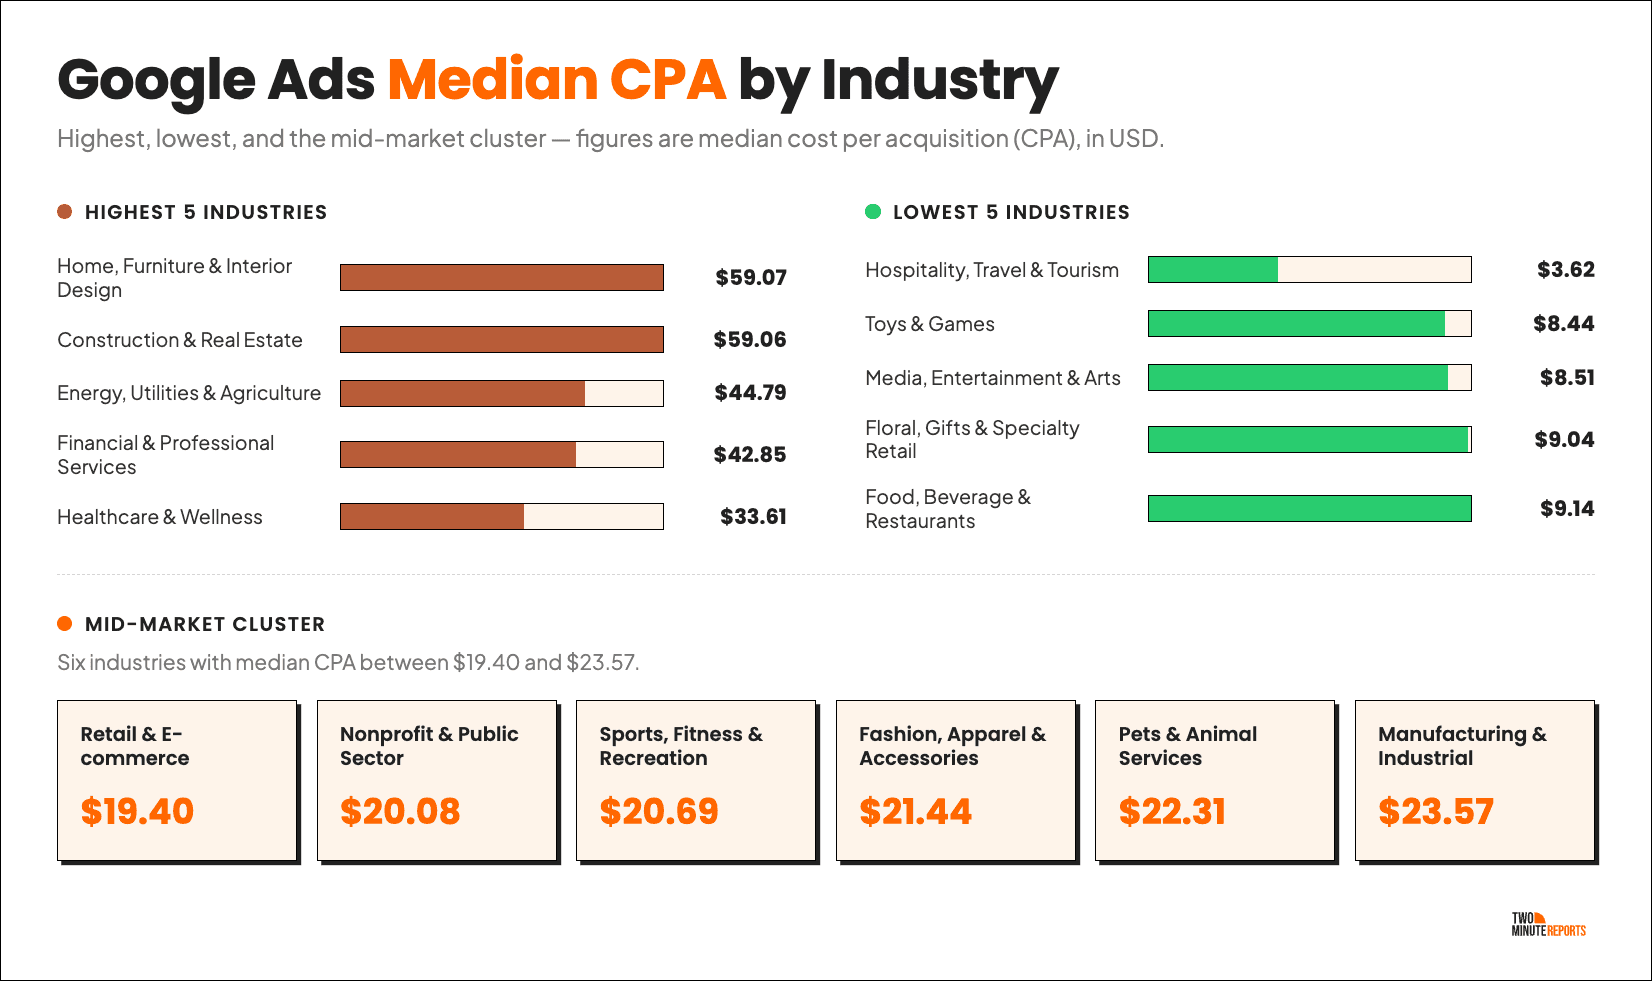
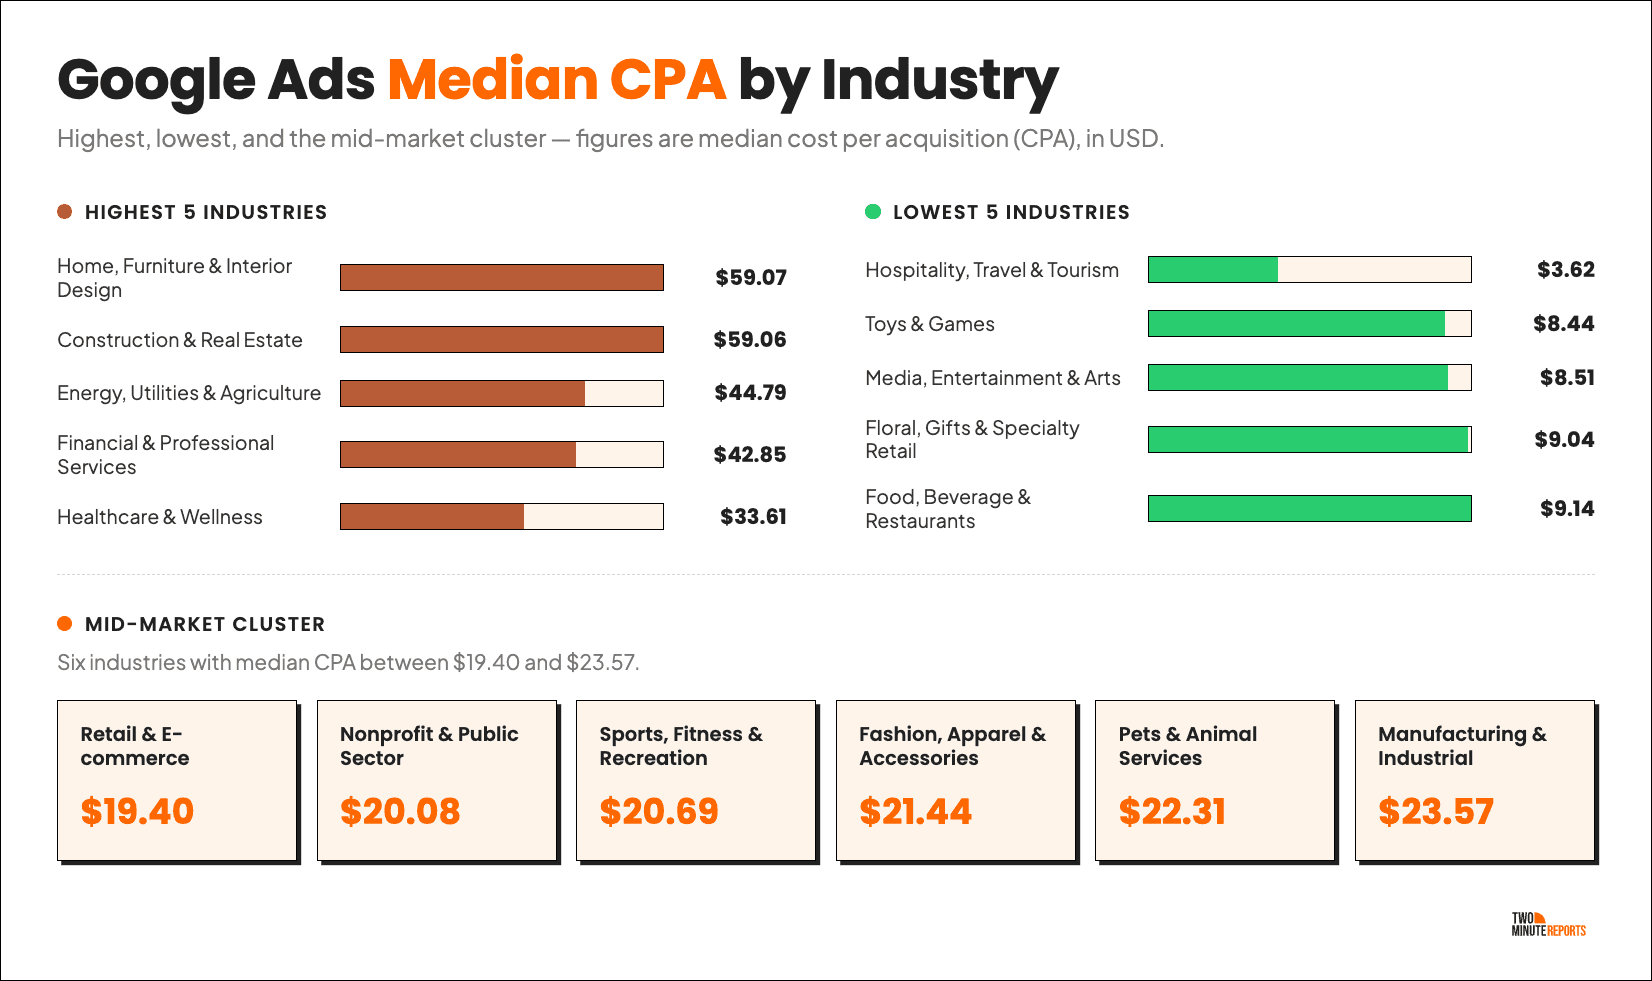
Hospitality, Travel & Tourism recorded the lowest median CPA at $3.62, while Home, Furniture & Interior Design ($59.07) and Construction & Real Estate ($59.06) recorded the highest. Rather than judging your CPA in isolation, evaluate it alongside your ROAS and Conversion Rate to understand whether your campaigns are acquiring customers profitably.
Google Ads Conversion Rate Benchmarks By Industry
Conversion Rates remained relatively consistent across industries, with 22 of the 25 industries recording median values between 2.61% and 7.25%. This suggests that while the cost of attracting visitors can vary significantly, the likelihood of converting those visitors is far more stable across most sectors.
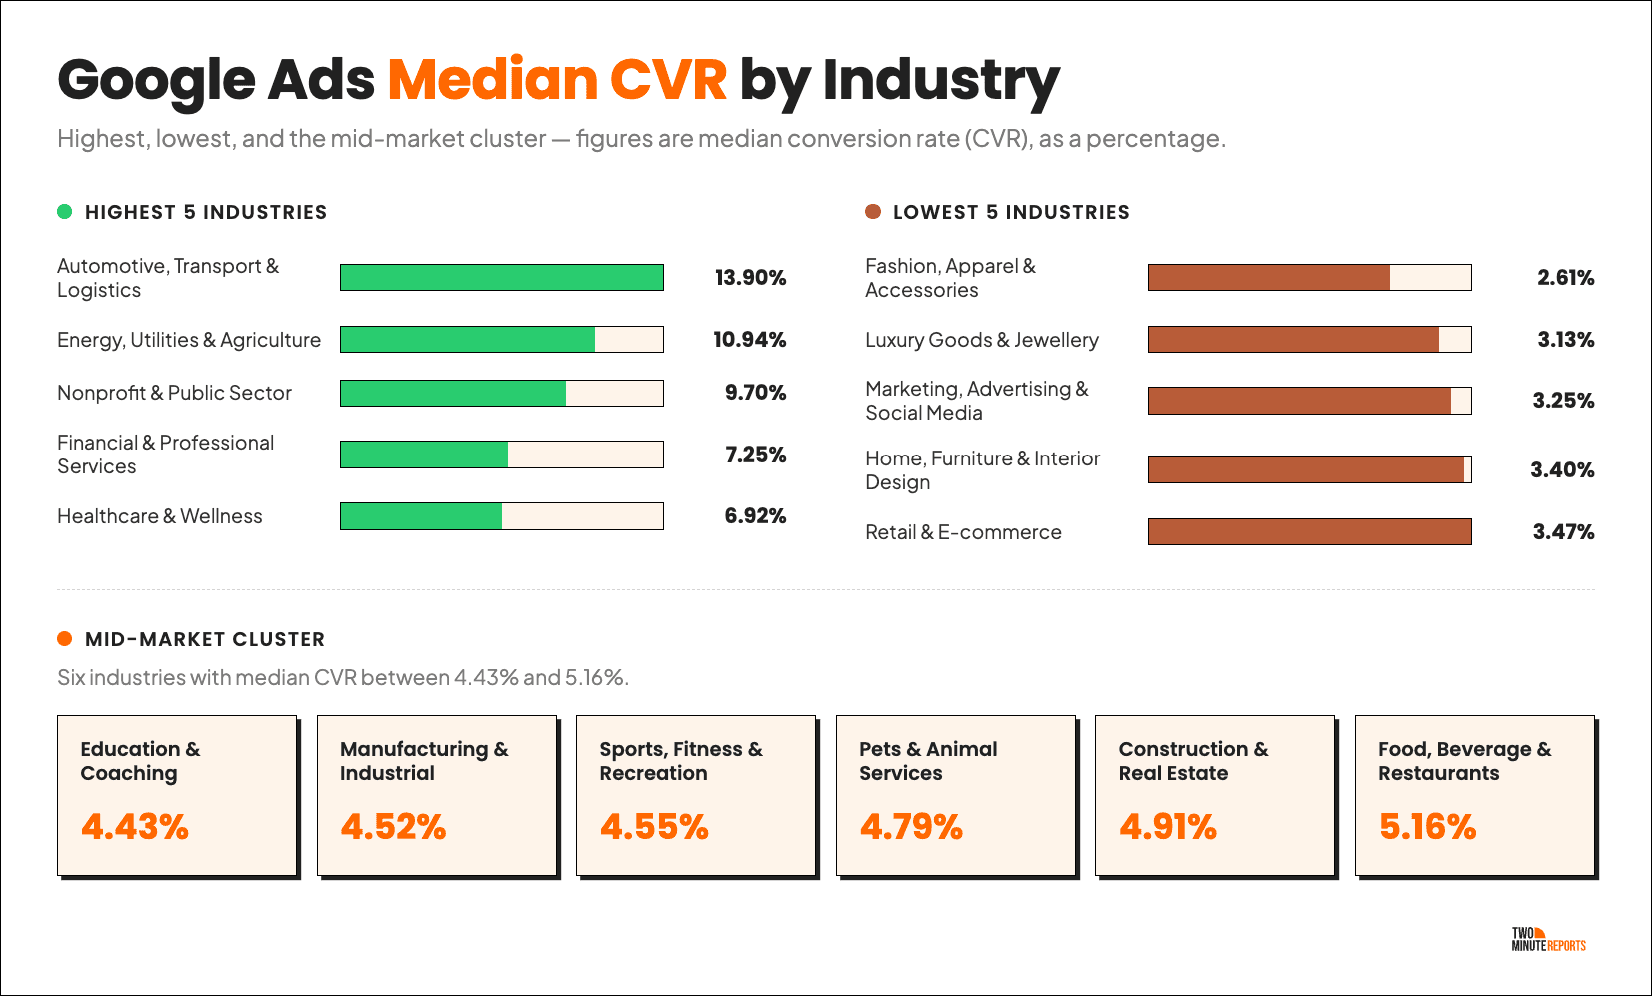
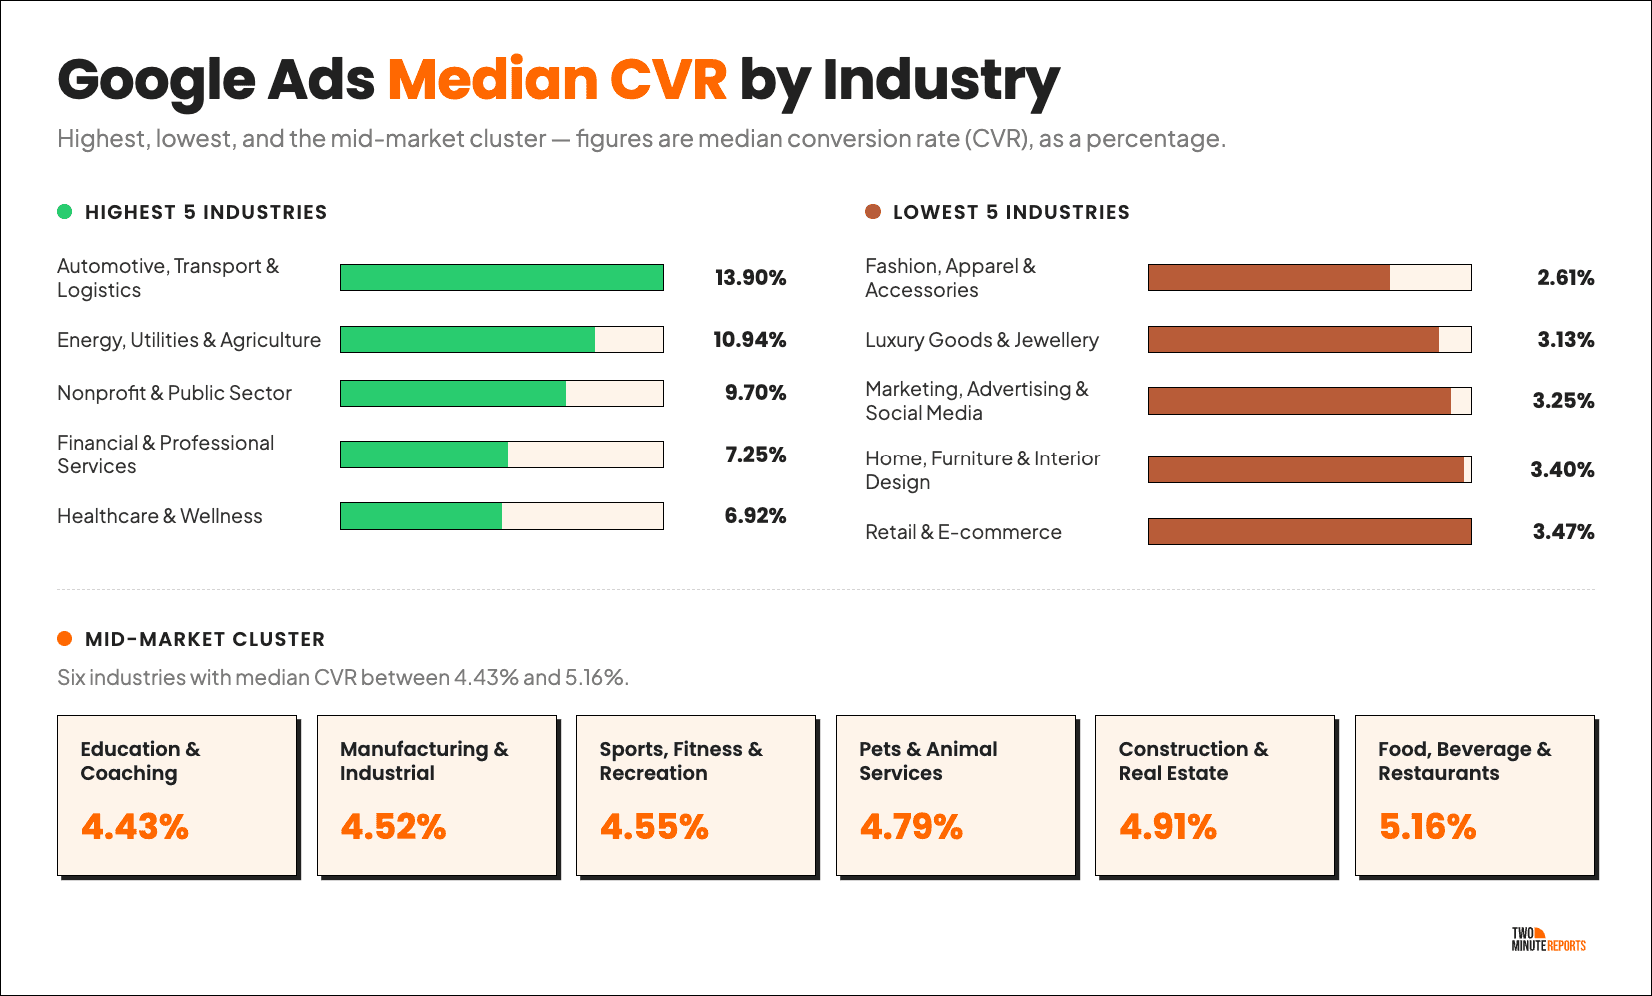
Automotive, Transport & Logistics recorded the highest median conversion rate at 13.90%, followed by Energy, Utilities & Agriculture (10.94%) and Nonprofit & Public Sector (9.70%). Since even small improvements in conversion rate can lower CPA and improve ROAS, it's often one of the highest-impact metrics to optimize after you've generated qualified traffic.
Google Ads ROAS Benchmarks By Industry
ROAS is one of the clearest indicators of advertising profitability. It reflects the combined impact of your targeting, conversion rate, and customer value.
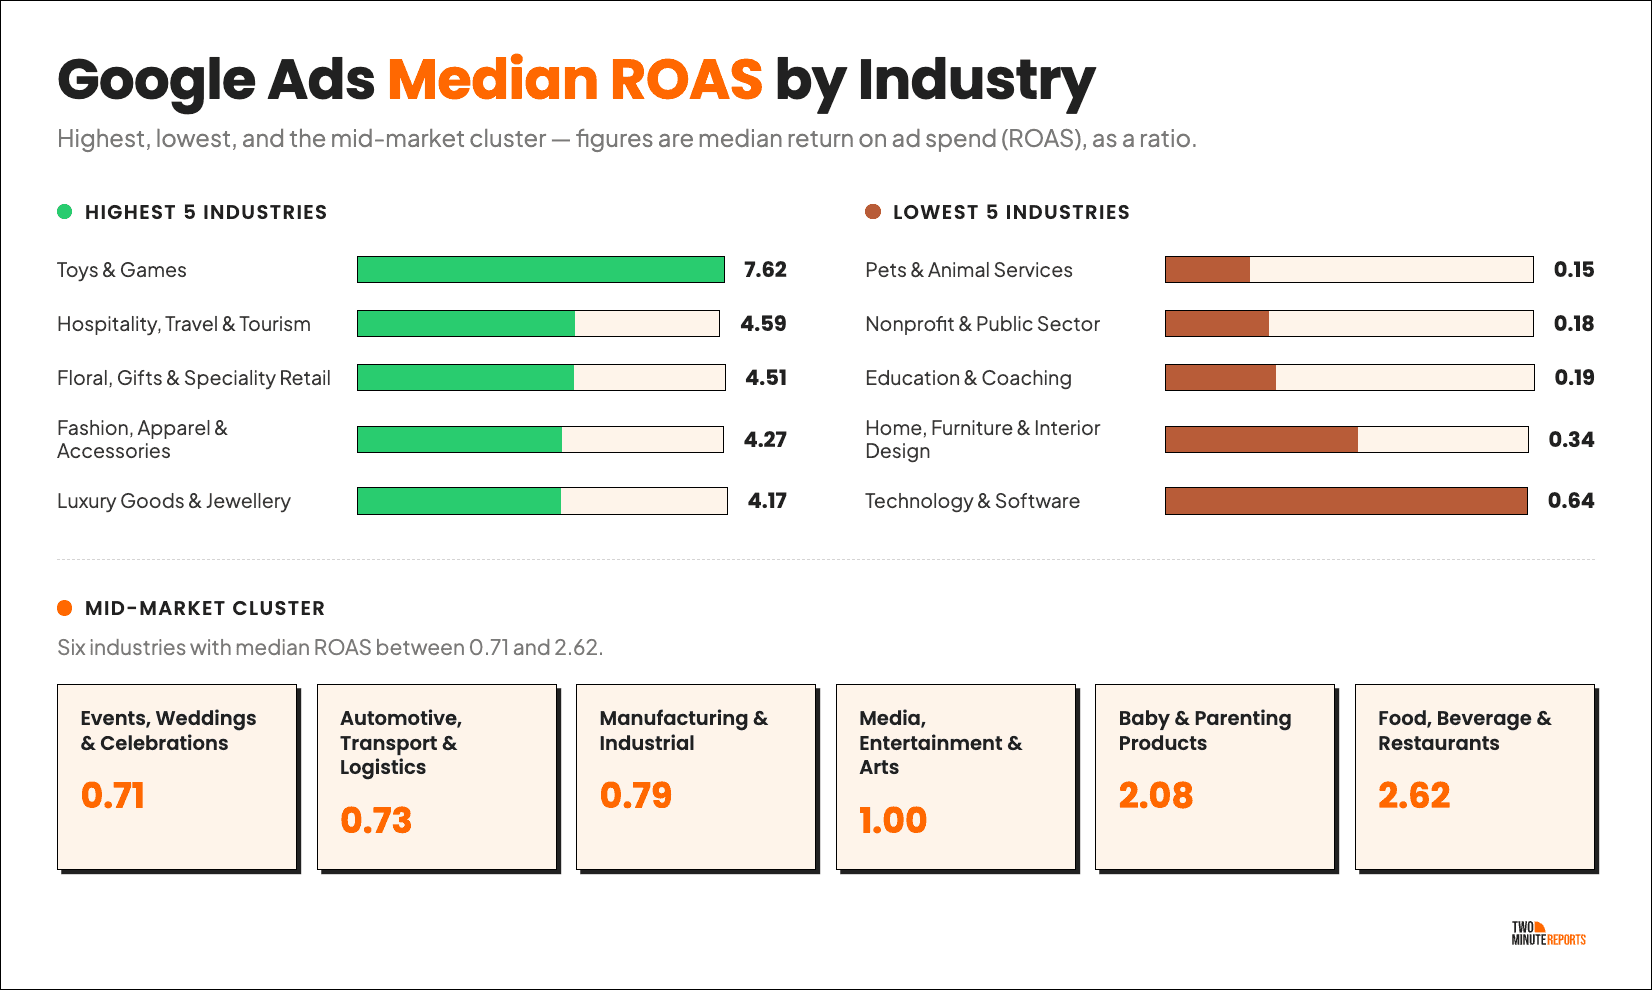
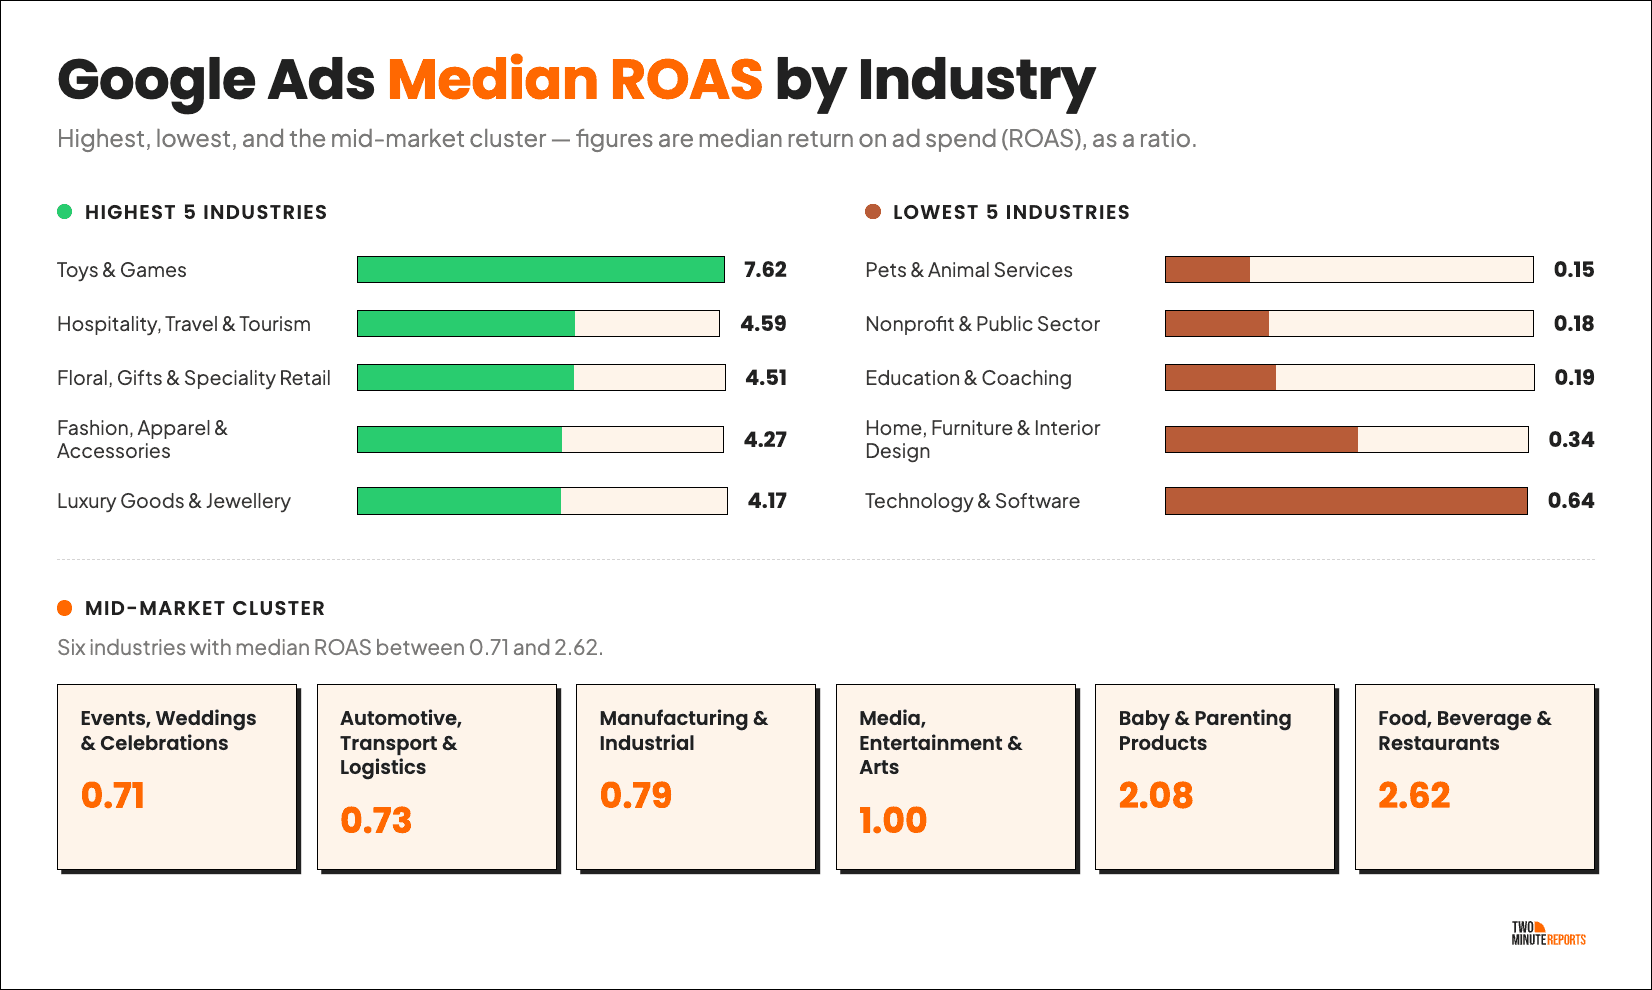
Toys & Games recorded the highest median ROAS at 7.62×, followed by Hospitality, Travel & Tourism (4.59×), Floral, Gifts & Speciality Retail (4.51×), Fashion, Apparel & Accessories (4.27×), and Luxury Goods & Jewellery (4.17×). While higher ROAS generally signals stronger returns, it should always be interpreted alongside profit margins to understand true business performance.
How to Use Google Ads Benchmarks to Improve Your Revenue?
Here’s how you can optimize your campaign performance based on the insights gathered from the above benchmarks.
1. High click costs don’t mean poor performance
Some of the highest median CPCs were recorded in Healthcare & Wellness ($2.41) and Construction & Real Estate ($2.29).
While these click costs are higher than many other industries, they reflect the competitive nature of those markets rather than poor campaign performance. If your CPC consistently exceeds your industry's median benchmark, review the factors influencing your Google Ads pricing before making campaign changes.
2. Improving conversion rate has a bigger impact
Across the benchmark, CPC varied from $0.23 to $4.57, while conversion rates remained much more consistent, falling between 2.61% and 7.25%.
This suggests that once you’ve attracted qualified traffic, improving your landing pages, offers, or checkout experience can have a greater impact on lowering CPA and increasing ROAS than focusing solely on cheaper clicks.
3. Look at the whole funnel
Several industries demonstrated that one strong metric doesn’t guarantee overall success. For example, Energy, Utilities & Agriculture recorded the highest CTR (7.52%) and one of the highest conversion rates (10.94%), yet it also had the highest CPC ($4.57) and a relatively high CPA ($44.79).
Evaluate CTR, CPC, CPA, and ROAS together to understand whether campaigns are generating profitable growth. If your metrics point to bidding inefficiencies, choosing the right Google Ads bidding strategy can help align your campaigns with your performance goals.
4. Revenue should be your optimization goal
Industries with the strongest ROAS weren’t necessarily those with the highest CTR or the lowest CPC. Toys & Games achieved the highest median ROAS (7.62x), while Hospitality, Travel & Tourism combined the lowest CPC ($0.23), the lowest CPA ($3.62), and a strong ROAS (4.59×).
These benchmarks reinforce that the ultimate objective isn't to maximize clicks or minimize costs, but to generate the highest return from your advertising spend.
Google Ads Benchmarks by Country
The industry medians reflect global averages, which is a strong baseline for understanding overall performance patterns across Google Ads. Country-level benchmarks show you how the same industry performs in your specific market, helping you plan Google ad campaigns with sharper, audience-led precision.
Use the dropdown below to filter by industry and country to see how the Google Ads benchmarks shift for your target audience.
Showing 413 industry-country combinations across all industries. Some countries may show partial data — metrics not available for a combination are not displayed.
Conclusion
Google Ads benchmarks are most valuable when they help you ask better questions about your campaigns. Compare your performance against your industry's median values to identify where you have the greatest opportunity to improve.
If you advertise across multiple platforms, compare your performance beyond Google Ads. Explore our Facebook Ads Benchmarks and TikTok Ads Benchmarks to understand how costs, engagement, and conversion metrics vary across channels and set more realistic performance expectations.
With Two Minute Reports, you can automatically track all your metrics in Native Dashboards, Sheets or Looker Studio. Having your live PPC metrics in one place makes it easier to spot trends, identify opportunities, and make decisions faster.
You've seen the benchmarks. Now track yours.
- Compare your performance against industry averages
- Monitor CTR, CPC, CPM, CPA, CVR & ROAS
- Build automated Google Ads dashboards
- Share reports with clients in minutes
Frequently Asked Questions
A good Google Ads CTR depends on your industry. Median CTR benchmarks range from 1.75% to 7.52%, with most industries recording values between 2% and 4%. Compare your CTR against your industry's median benchmark to understand whether your campaigns are performing competitively.
There is no universal "good" CPC because click costs vary across industries. Median CPC benchmarks range from $0.23 to $4.57, although 17 of the 25 industries recorded median CPCs below $1.00. Evaluate CPC alongside Conversion Rate, CPA, and ROAS to understand the true cost of acquiring customers.
Median Conversion Rate benchmarks remain relatively consistent across industries. Twenty-two of the 25 industries recorded median Conversion Rates between 2.61% and 7.25%, making industry-specific comparisons more meaningful than aiming for a single target.
The easiest way to benchmark your performance is to track your Google Ads metrics consistently over time. With our Google Ads reporting tool, you can automatically pull CTR, CPC, CPM, Conversion Rate, CPA, and ROAS into Native Dashboards, Google Sheets or Looker Studio, making it easy to compare your campaigns against industry median benchmarks and identify performance trends.
Google Ads benchmarks should be used as reference points. Compare your CTR, CPC, CPM, Conversion Rate, CPA, and ROAS against your industry's median benchmarks to identify where your campaigns differ. Then optimize the metrics that have the greatest impact on profitability instead of focusing on a single KPI.