Google Trends is an indispensable asset for conducting keyword research, as it not only identifies spikes in search volume related to specific events but also offers comprehensive data on search volume index and geographical distribution of search engine users.
However, the process of importing this valuable information into Looker Studio has proven to be quite challenging. Fortunately, Two Minute Reports presents a solution to this issue, streamlining the connection between Google Trends and Looker Studio without the need for any coding knowledge.
Select Google Trends in the TMR Portal
The first step is to open the portal and select the Google Trends Connector you wish to add.
- Go to https://hub.twominutereports.com/ and log in to your account.
- Choose Two Minute Reports for Looker Studio
- Select your team. If you have only one team, TMR will skip this step and automatically redirect you to the connectors page.
- In the connectors page, find and select Google Trends.

Authorize Your Google Trends Account
The next series of steps is to configure your Google Trends account with TMR.
Login to Your Google Trends Account
In this section, you need to login to your Google Trends account for authentication making sure it connects with TMR and Looker Studio.
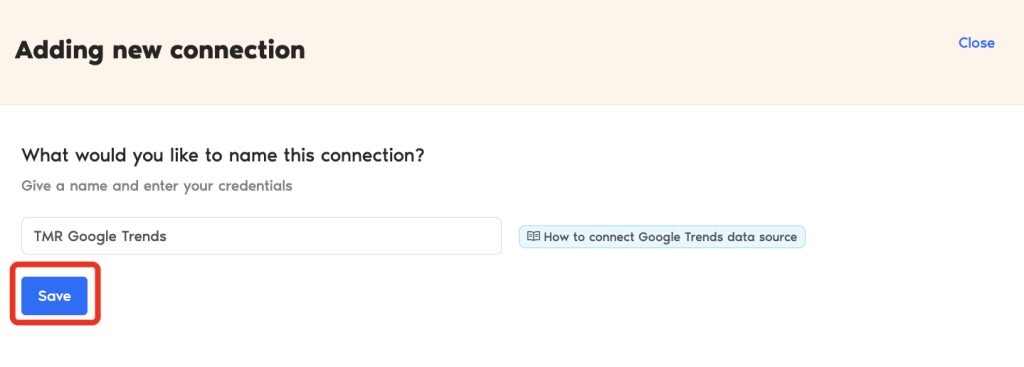
- Under Connections, click +Add New connection button.
- Name your Connection
- Click Save.
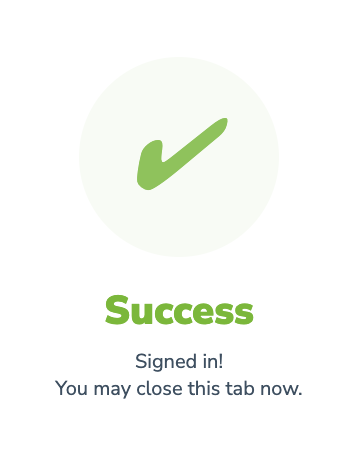
- If successful, Two Minute Reports gives a prompt “Signed in! You may close this tab now.“
Configuring Your Google Trends Account with TMR
Now go the Accounts section, to enable the accounts you want to access.
In the Query Configs section, click + Add New Query Config button. Choose the connection you added earlier. Click Next.

The next following steps is where you configure your Google Trends settings to TMR so that you can create reports in Looker Studio. You may configure the following parameters depending on your preference as TMR has imported them.
Daily search trends
Google Trends gives data on daily search trends. Google explains this data point as:
Daily Search Trends highlights searches that jumped significantly in traffic among all searches over the past 24 hours and updates hourly. These search trends show the specific queries that were searched, and the absolute number of searches made.
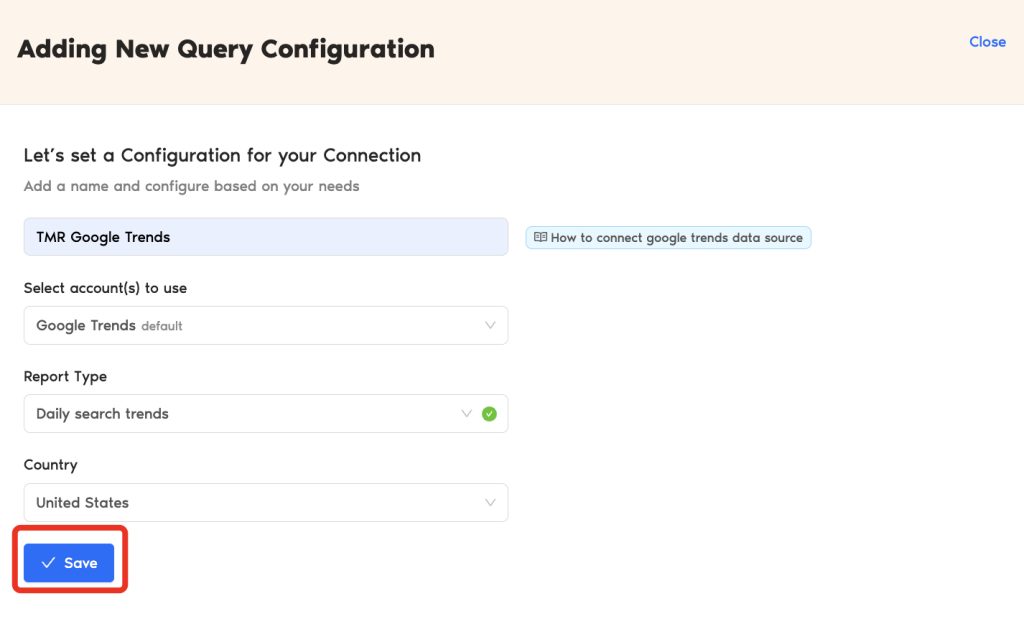
- Name your query config.
- Under Report Type, select Daily search trends.
- Under Country, select the country you want data from.
- Click Save.
Interests by time or region
Google Trends gives data on interests and an example is interest over time. Google explains this data point as:
Numbers represent search interest relative to the highest point on the chart for the given region and time. A value of 100 is the peak popularity for the term. A value of 50 means that the term is half as popular. A score of 0 means there was not enough data for this term.
- Name your query config.
- Under Report Type, select Interest over time or Interest by hour or Interest by region.
- Under Search terms, enter the search queries you want to get trends of.
- Under Country, select the country you want data from.
- Under Search type, select web search as this is the most used.
Under Category, select which category of that trend is coming from. - Click Save.
Related queries and related topics
Google Trends gives data on related topics and related queries. These are queries and topics users are also searching for that are related to your initial search.
- Name your query config.
- Under Report Type, select Related queries or Related topics.
- Under Search terms, enter the search queries you want to get trends of.
- Under Country, select the country you want data from.
- Under Search type, select web search as this is the most used.
Under Category, select which category of that trend is coming from. - Under Trend type, select either Top or Rising.
- Click Save.
Once everything is finished, click green Create Report button on the right side. The next section is creating reports in Looker Studio.

Create a Google Trends Report with TMR in Looker Studio
There are two options to create a Google Trends report with TMR in Looker Studio. You can choose to select our templates or create your own custom reports.
You can create your own custom dashboard in Looker Studio. Looker Studio is a powerful data visualization tool that contains many features to help you reduce time creating reports.
- After clicking Create Report from the previous section, click Create Report from scratch blue button.
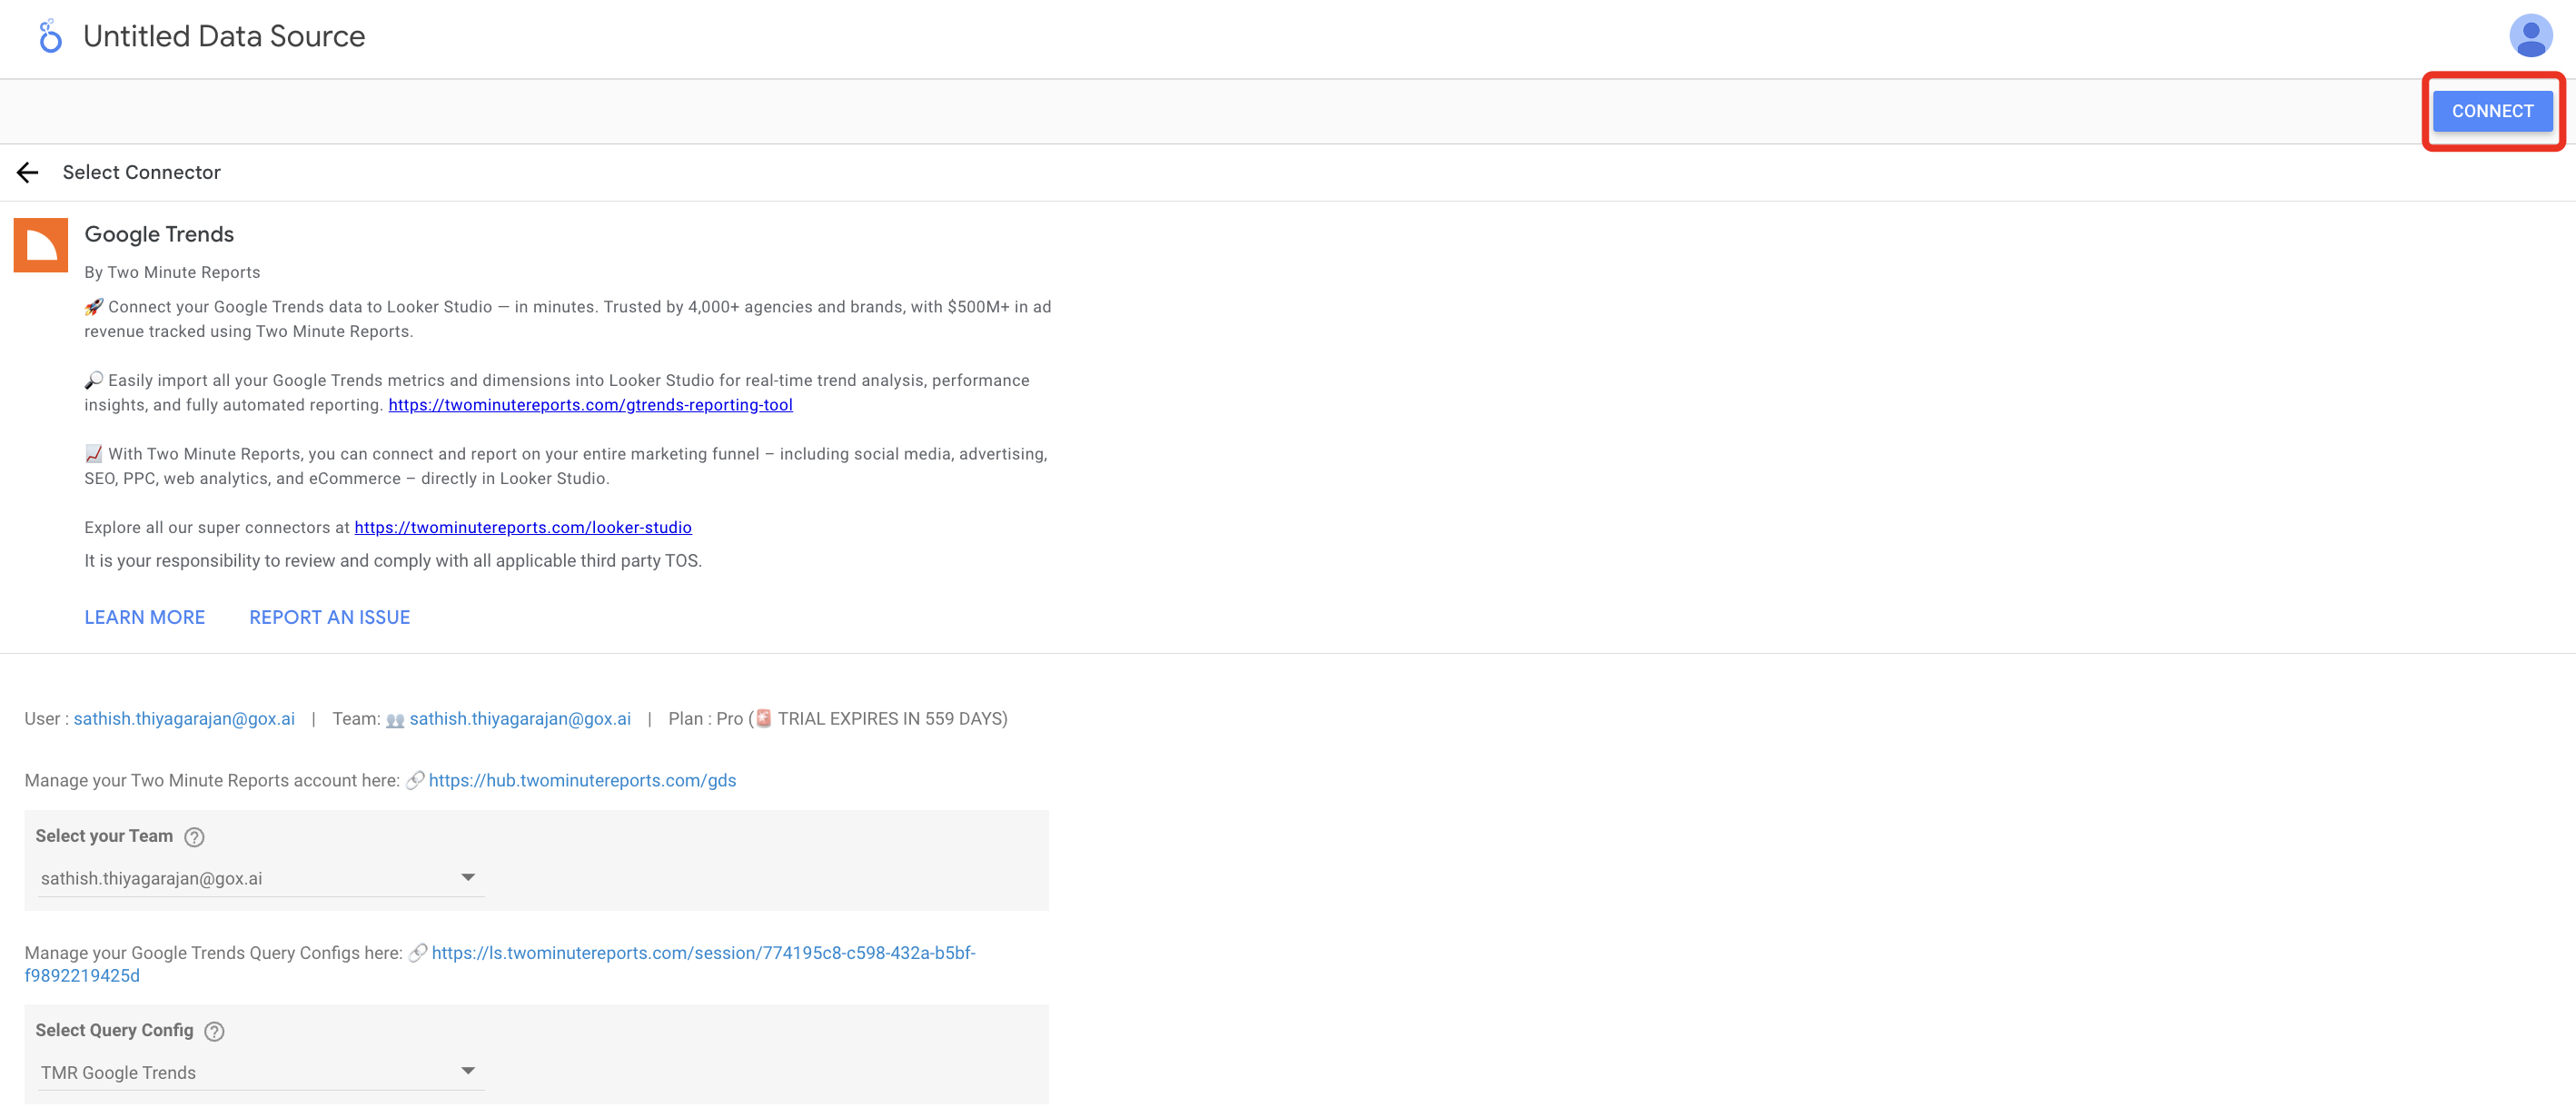
- You are redirected to Looker Studio. In Looker Studio, under Select Query Config, choose the configuration you created earlier (it should be the name you gave it). Under Select your Team, choose the appropriate team as well if the dropdown is showed to you.
- Click the blue Connect button in the upper right side of the page.
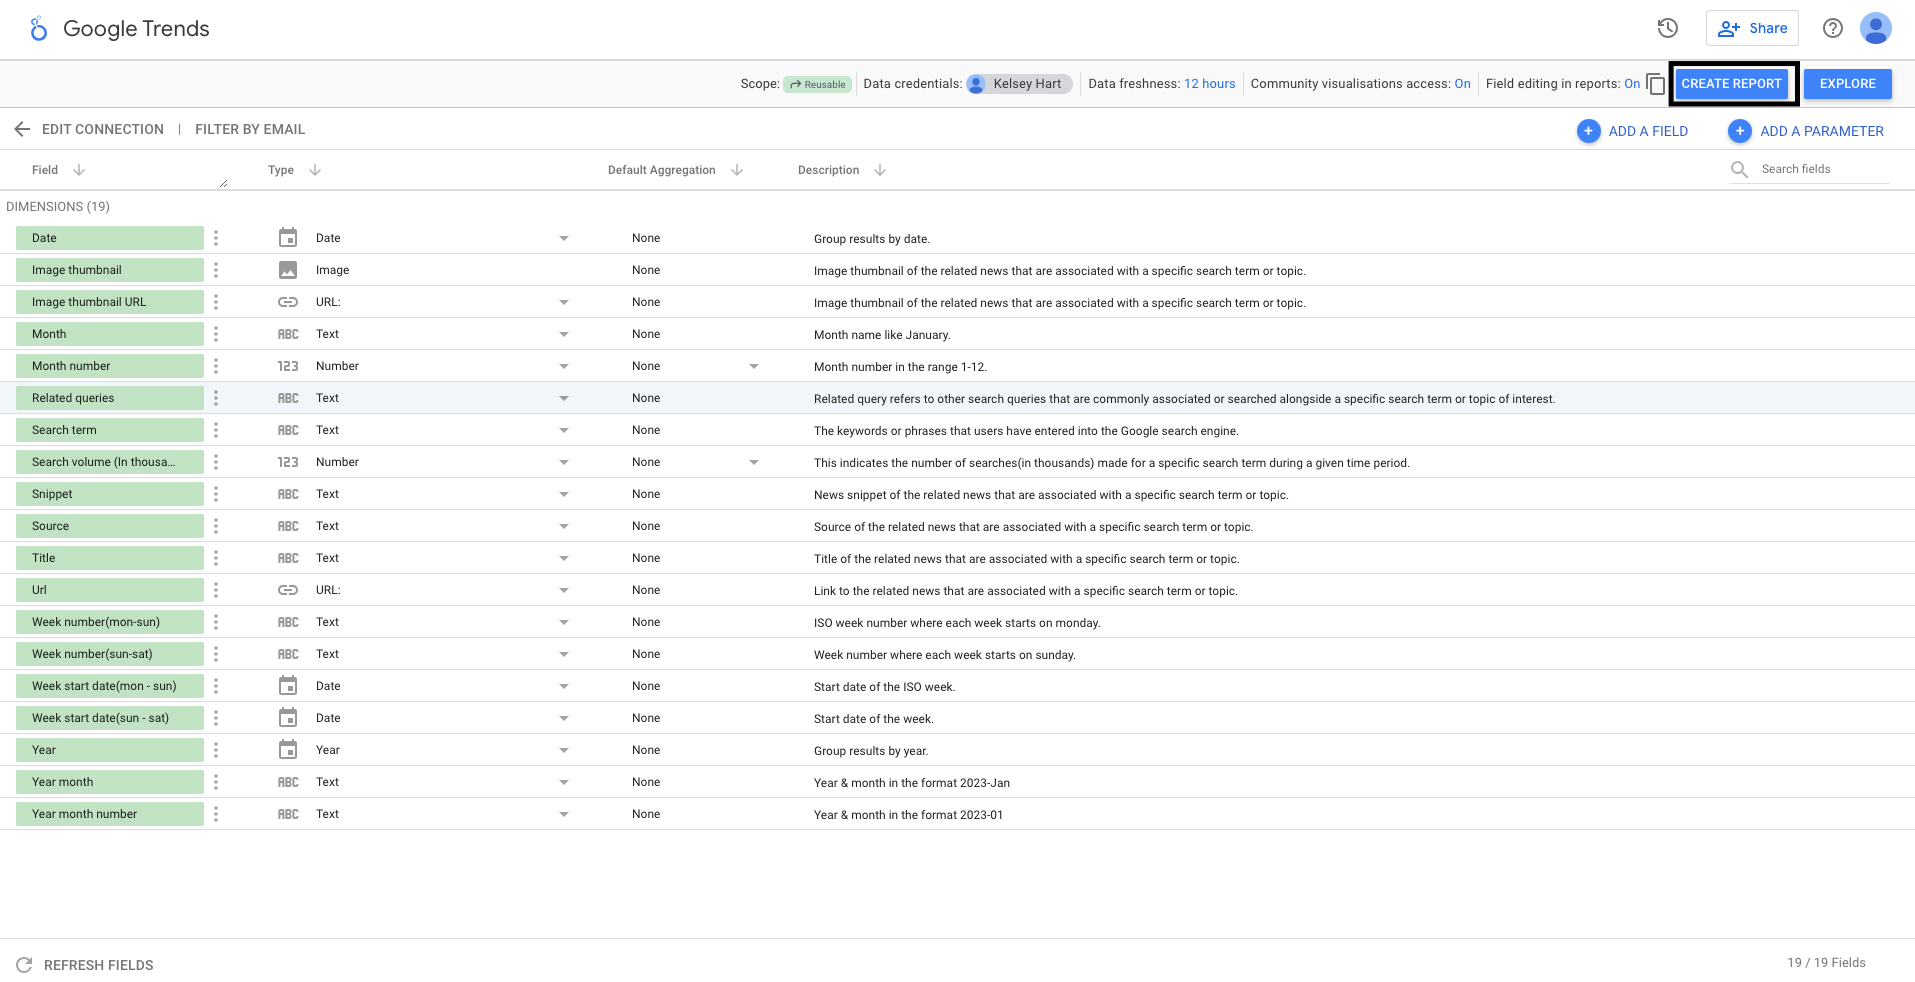
- You can now view the Google Trends schema on Looker Studio. Click Create Report in the right side of the page.
Once everything is loaded, you are presented with a blank canvas. You can now create custom reports (adding dates and charts) in Looker Studio with your Google Trends data.
If you want to learn about creating your own report, like adding dates and charts, read How to Create a Report in Looker Studio
