Centralize your marketing, sales, and CRM data from HubSpot directly in Looker Studio using TMR. You can customize reports to highlight specific metrics, such as sales pipeline and campaign performance, making the data more actionable. Follow the steps below to connect your HubSpot account to Looker Studio through TMR.
Step 1: Streamline your HubSpot account with TMR
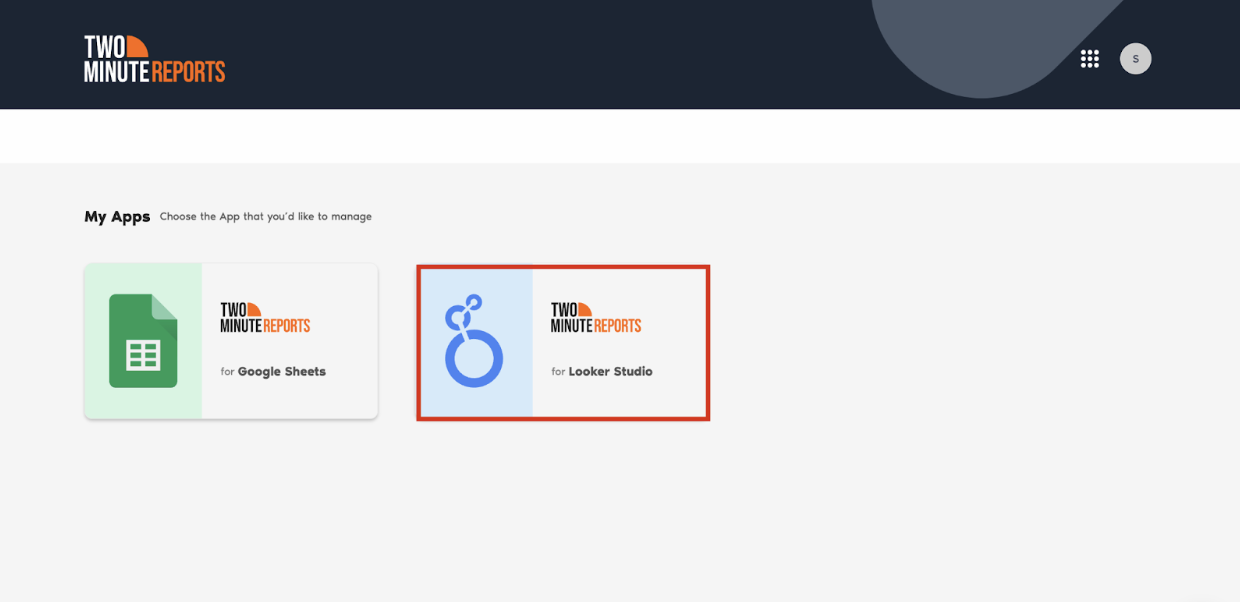
- Go to https://apps.gox.ai/ and choose Two Minute Reports for Looker Studio.
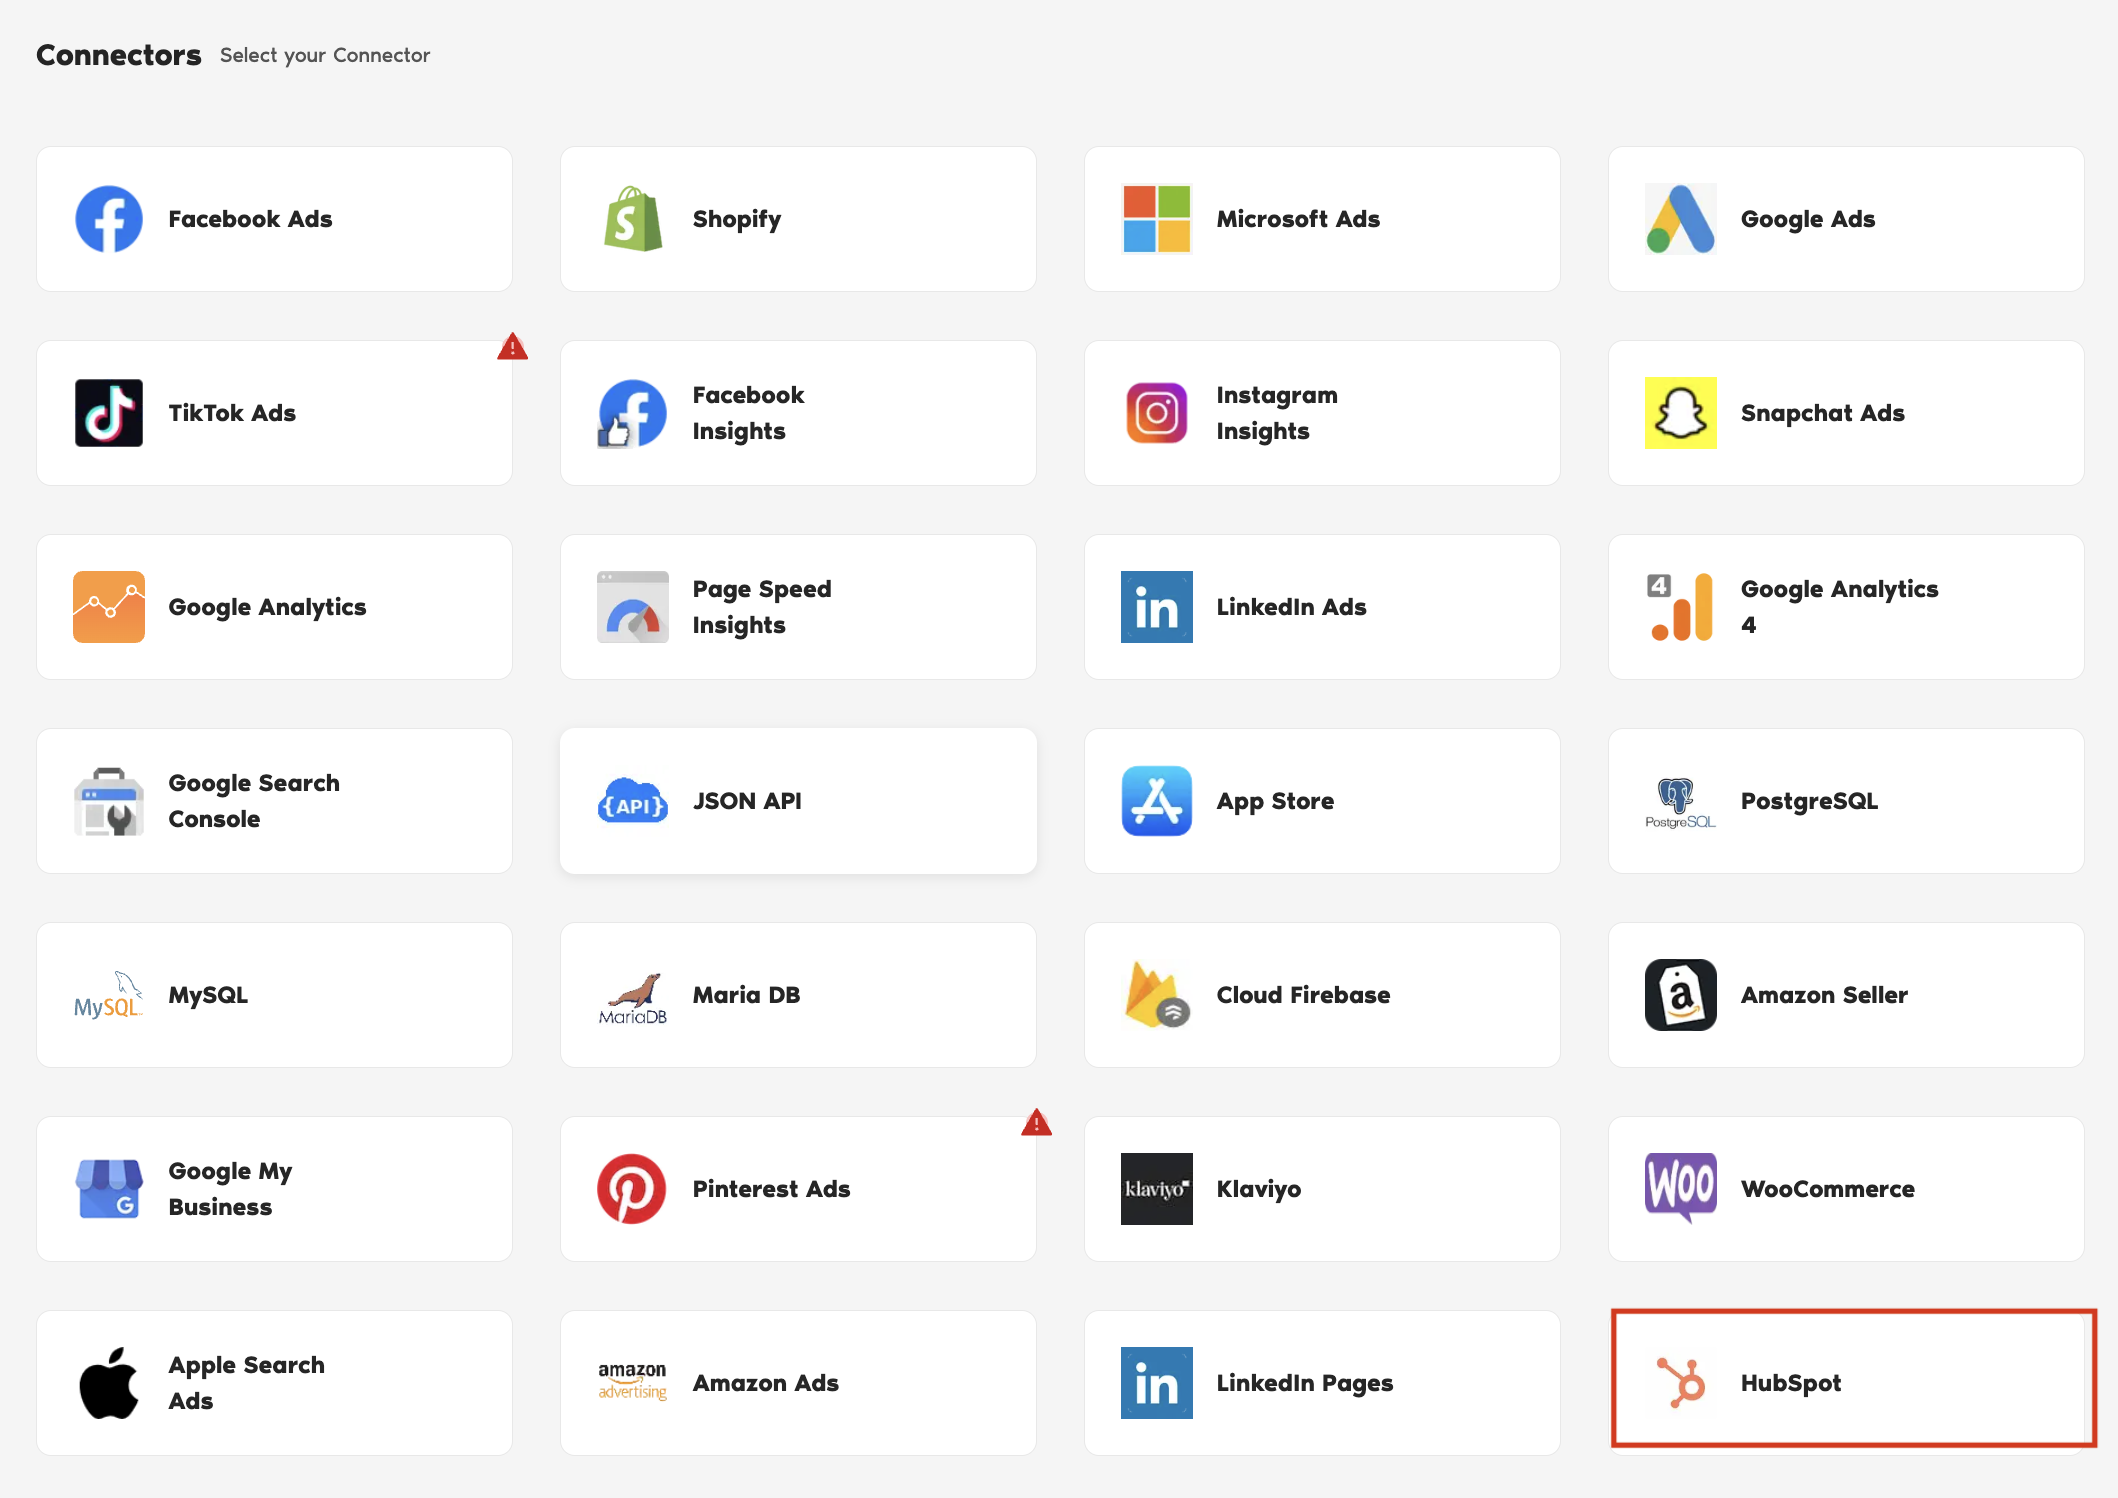
- Select HubSpot from the list of connectors.
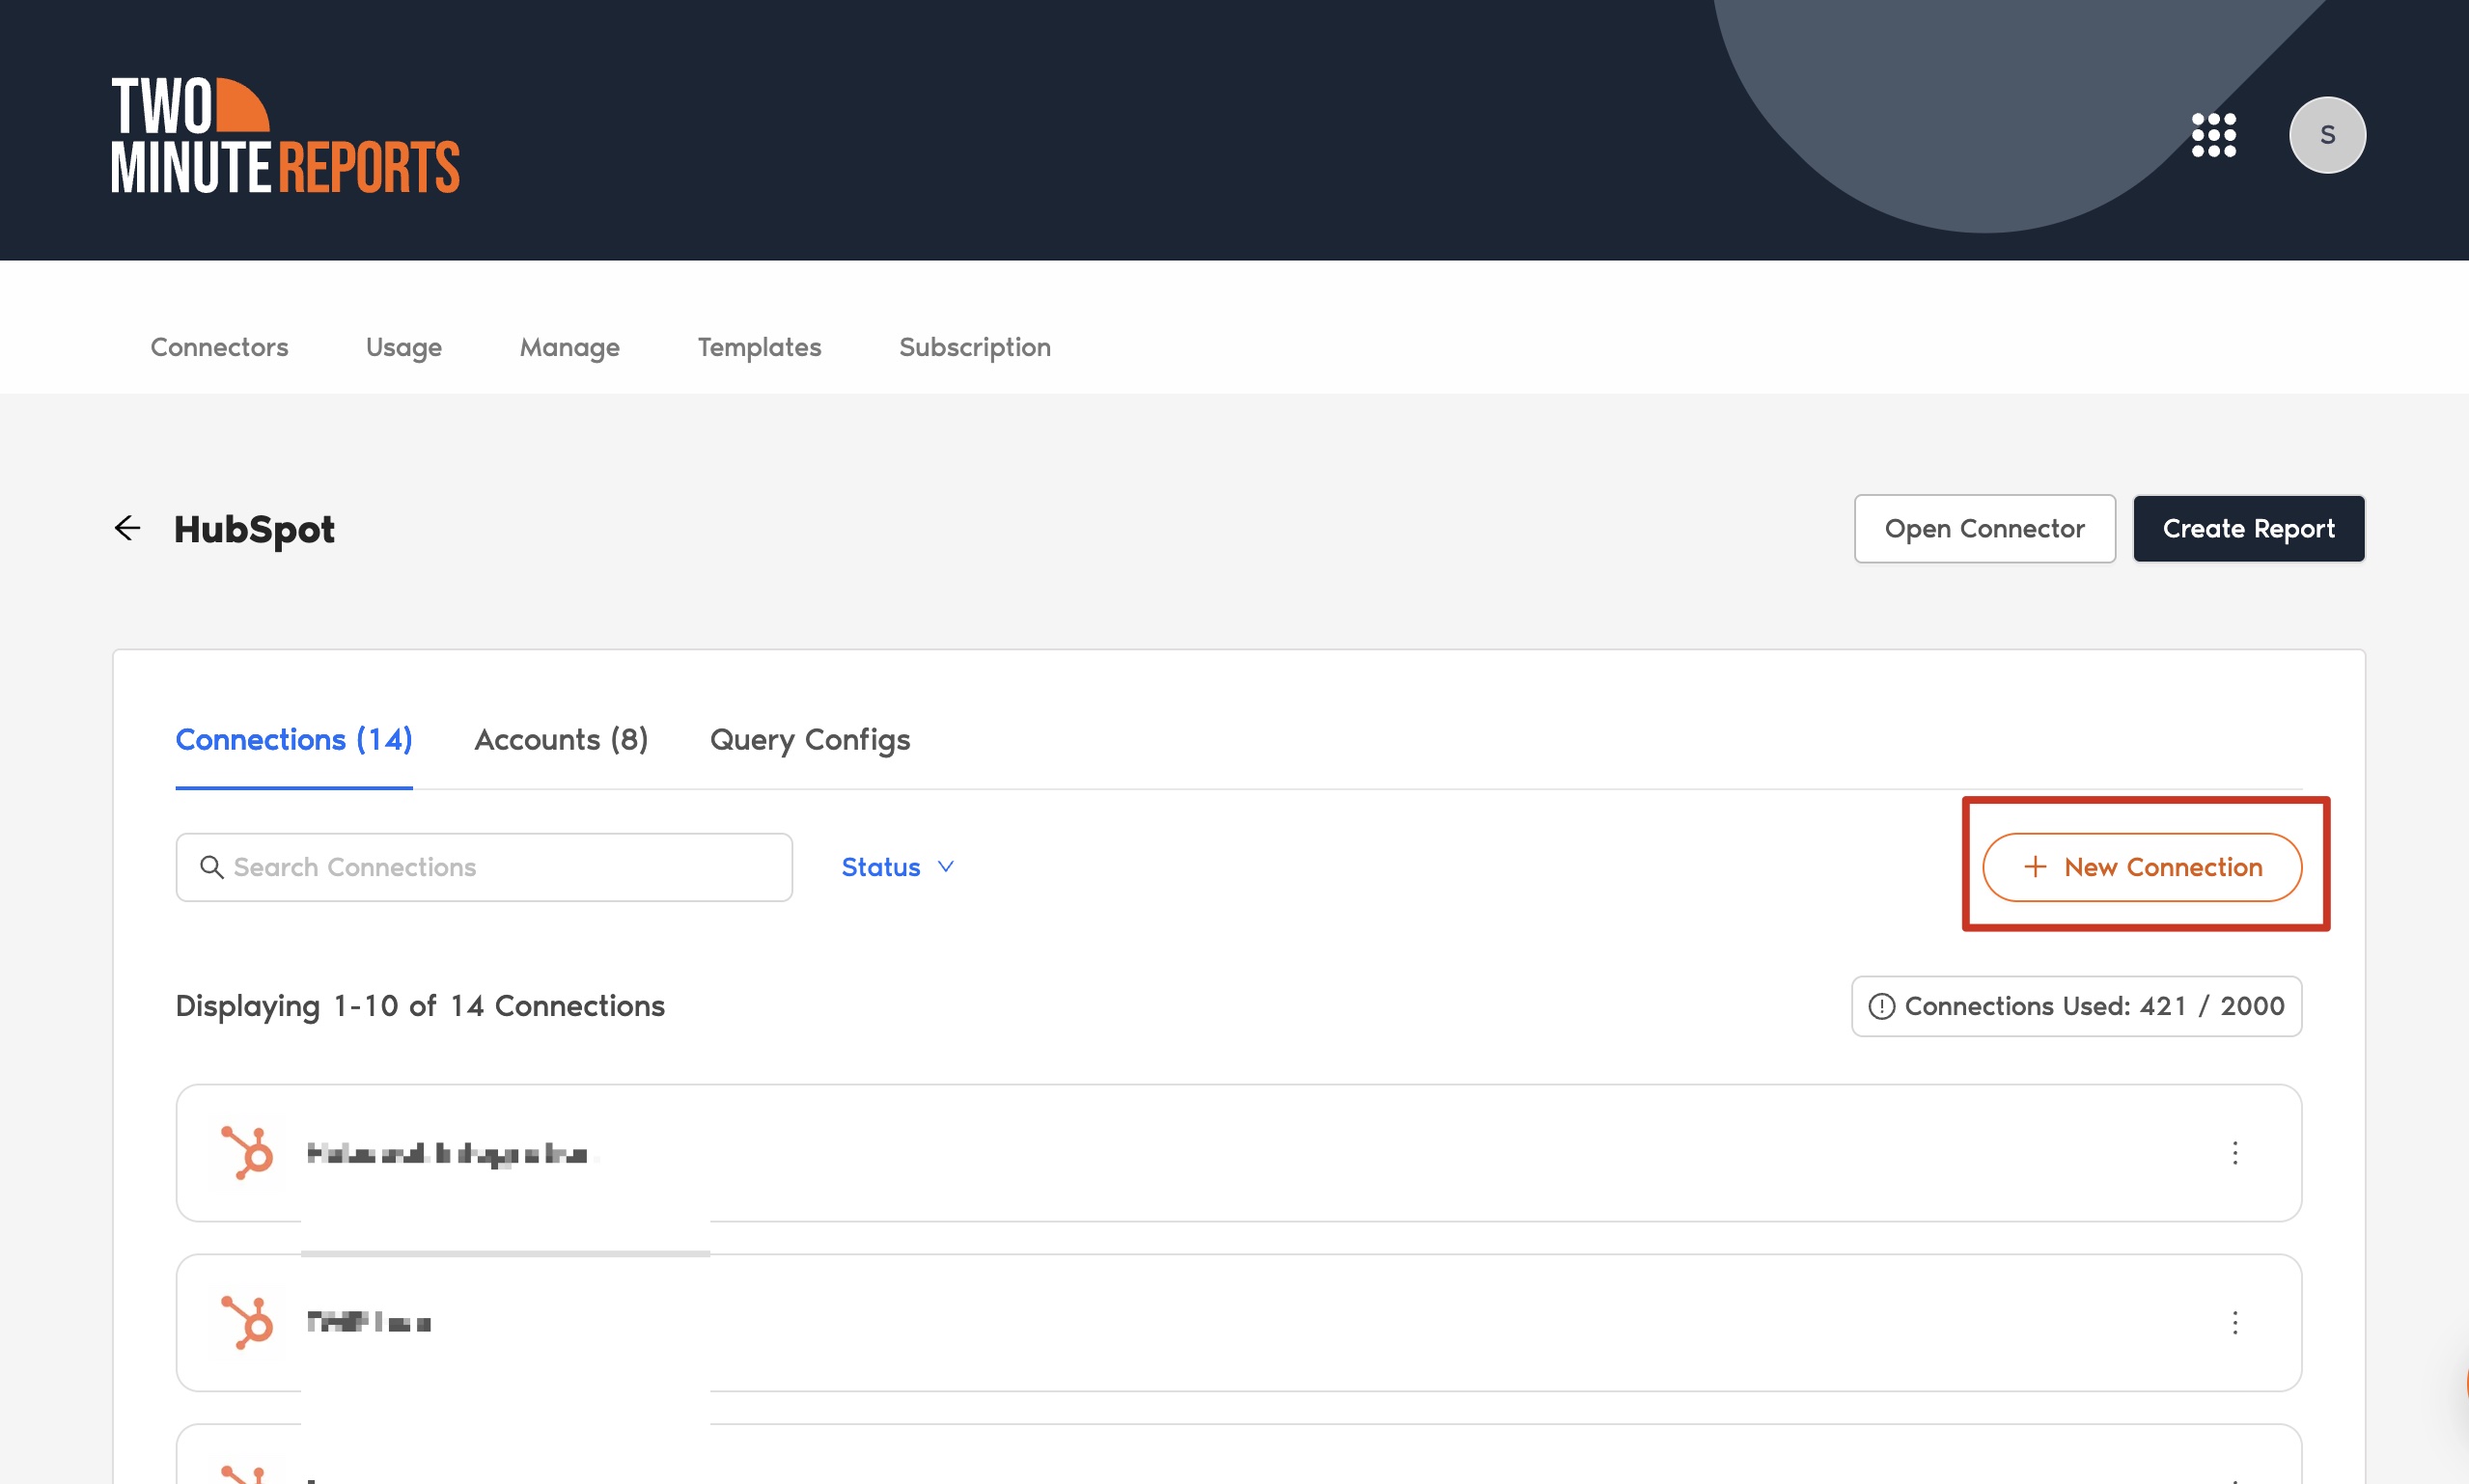
- Connect your HubSpot data by clicking New Connection to create your Connection in Looker Studio.
- The “Adding New Connection” dialog box will appear. Here, you can connect your HubSpot account in two easy steps:
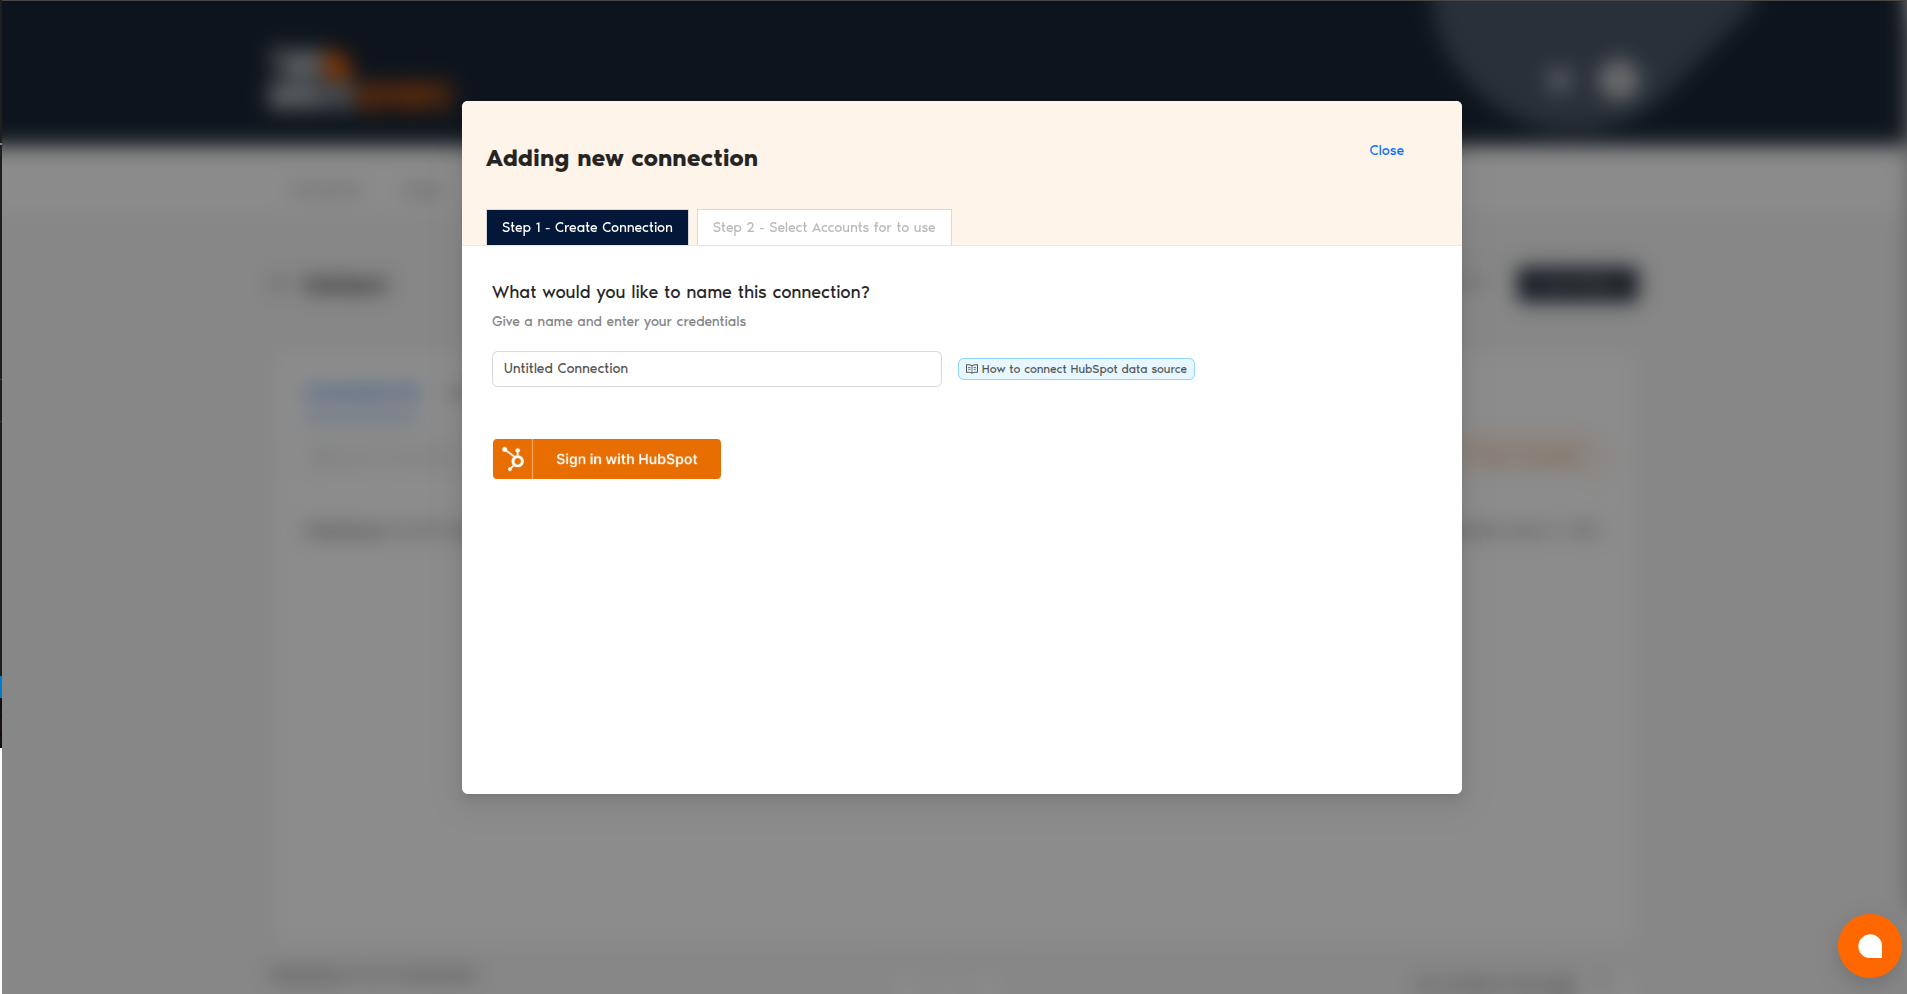
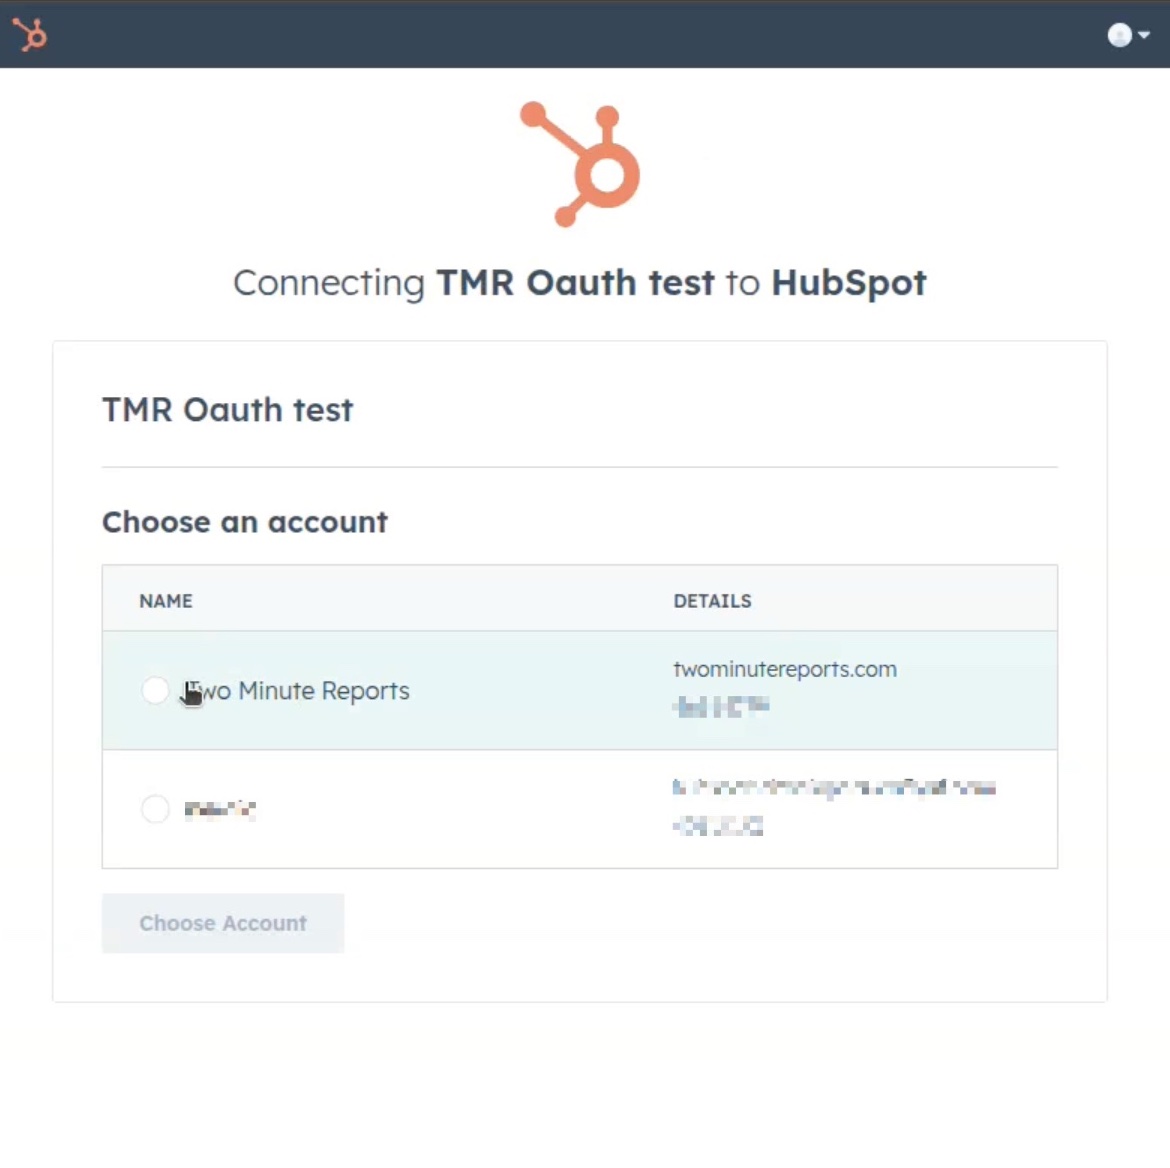
- Creating a Connection: Name your Connection and authorize your HubSpot account via OAuth. Once you sign in to HubSpot, the OAuth window will pop up. Select the desired account and click “Choose Account.”
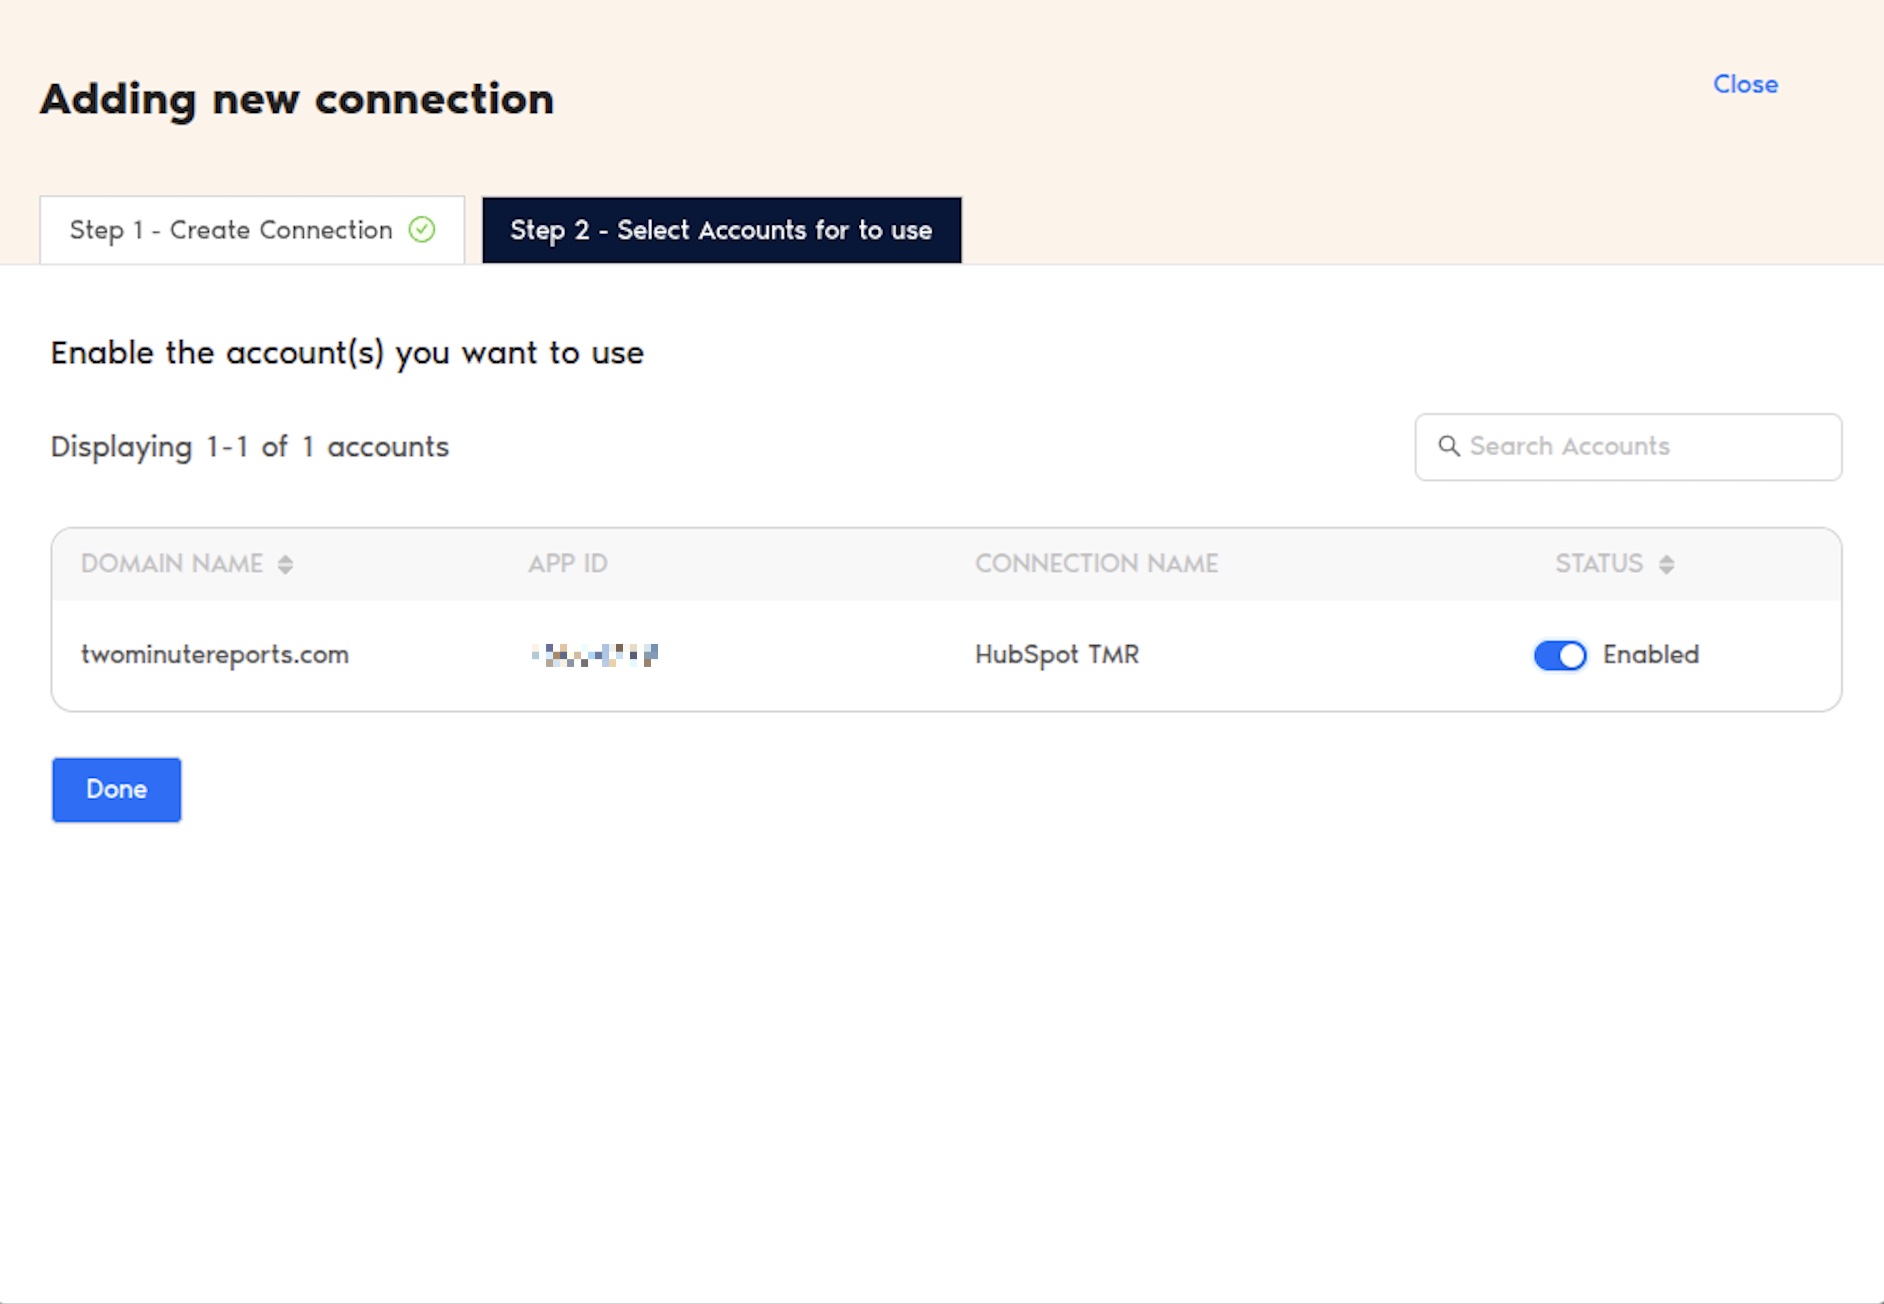
- Select accounts for use: Once authenticated, enable the necessary accounts to extract actionable campaign insights. Please note that you can only create reports for accounts that are enabled.
That’s it. You can now configure your HubSpot account to extract meaningful insights.
Step 2: Configure your HubSpot account with TMR
- In the Query Configs section, click + Add New.
| The Query Config allows you to group multiple accounts, making it easier to view centralized insights in your Looker Studio dashboard. |
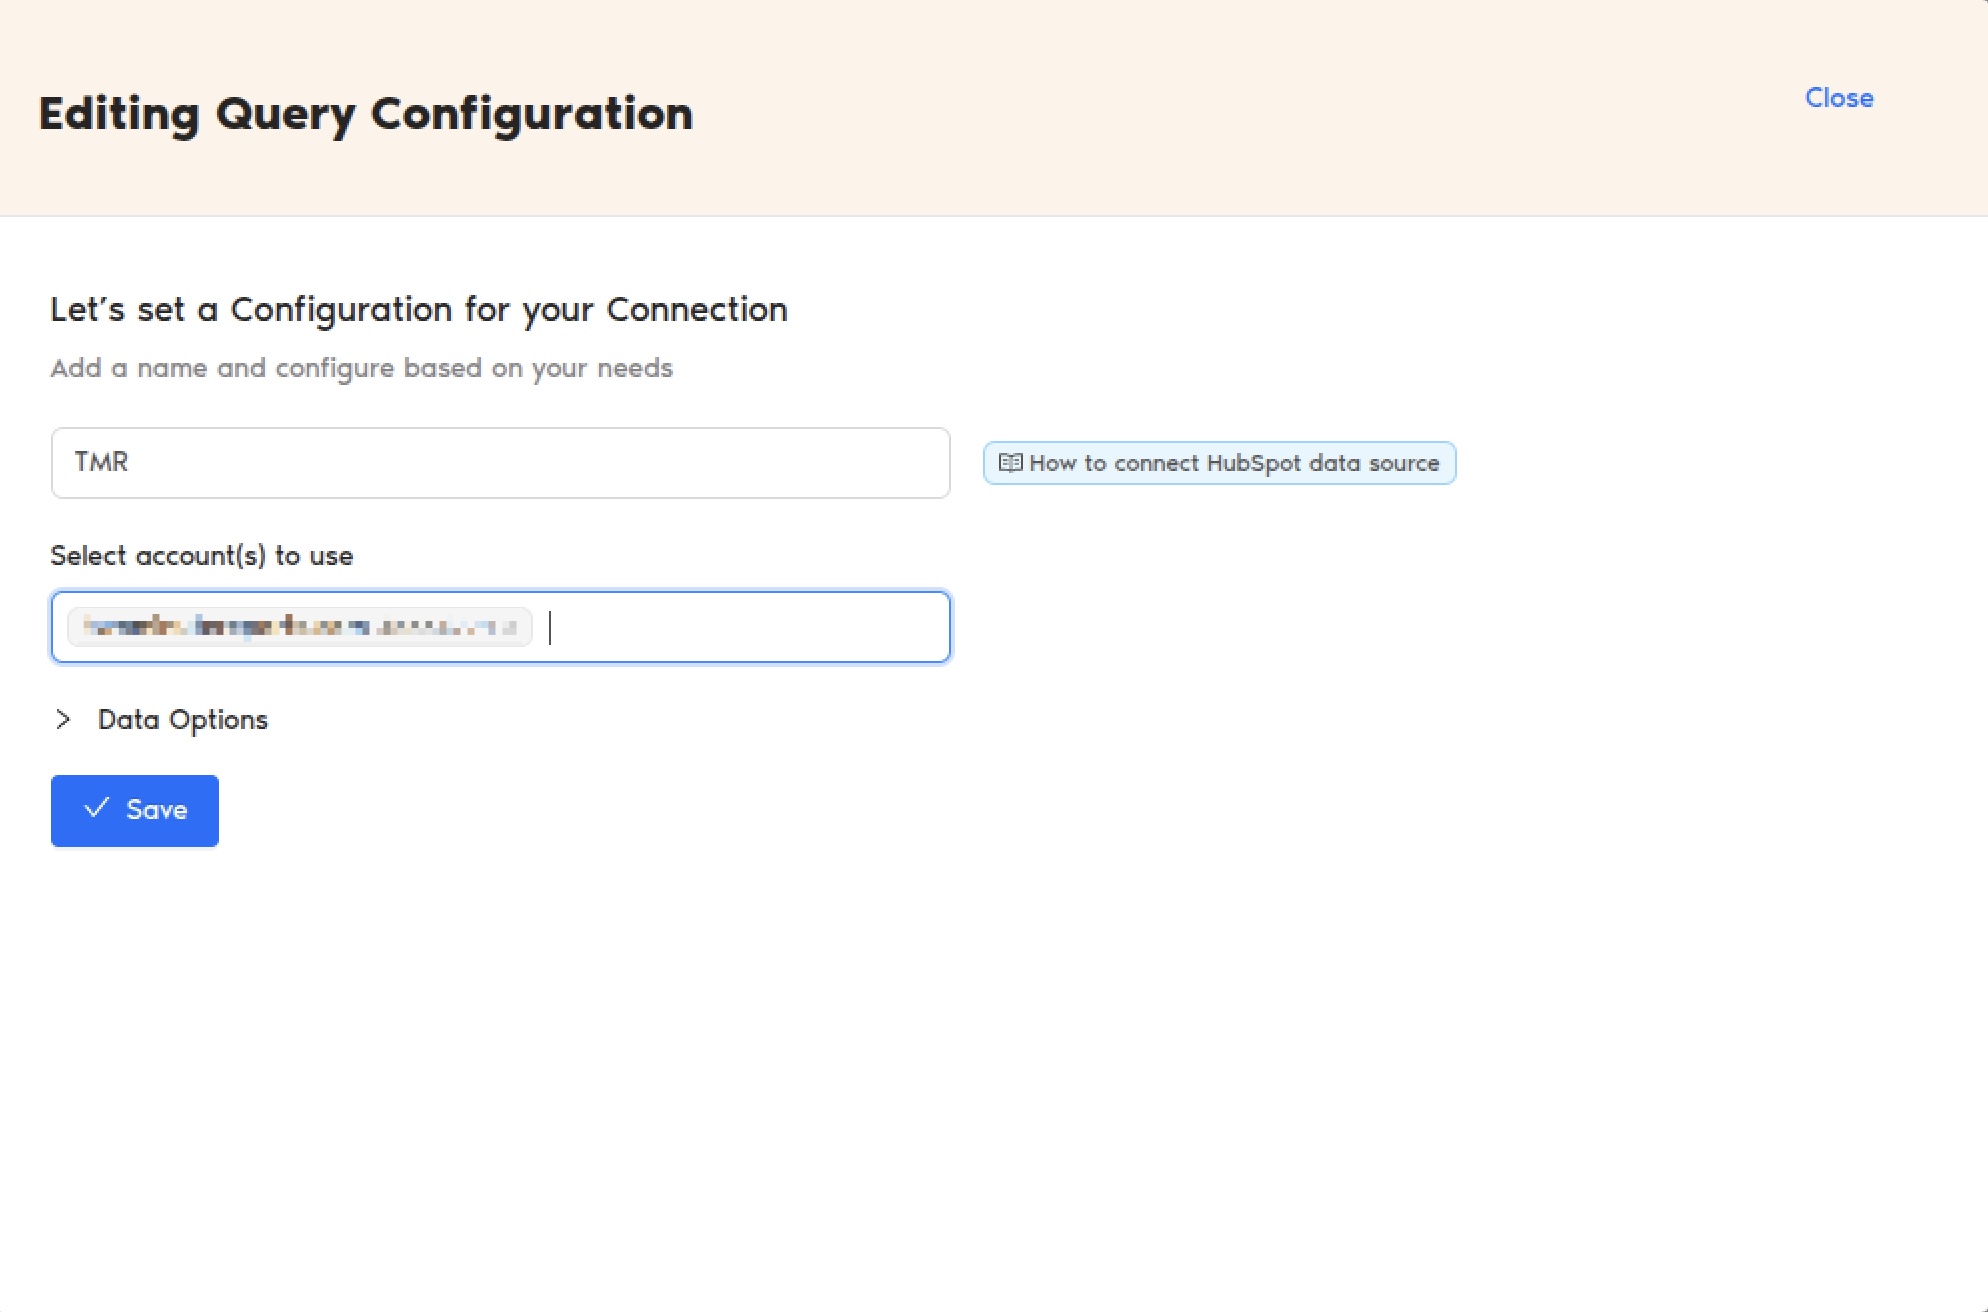
- The Adding New Query Configuration dialog box will appear. Name the query config, select (from the list of enabled) accounts from the dropdown, and configure your HubSpot report. Once done, click Save.
You’ve successfully created a new configuration, which you can now use to extract data for your Looker Studio reports.
Step 3: Create your HubSpot report with TMR in Looker Studio
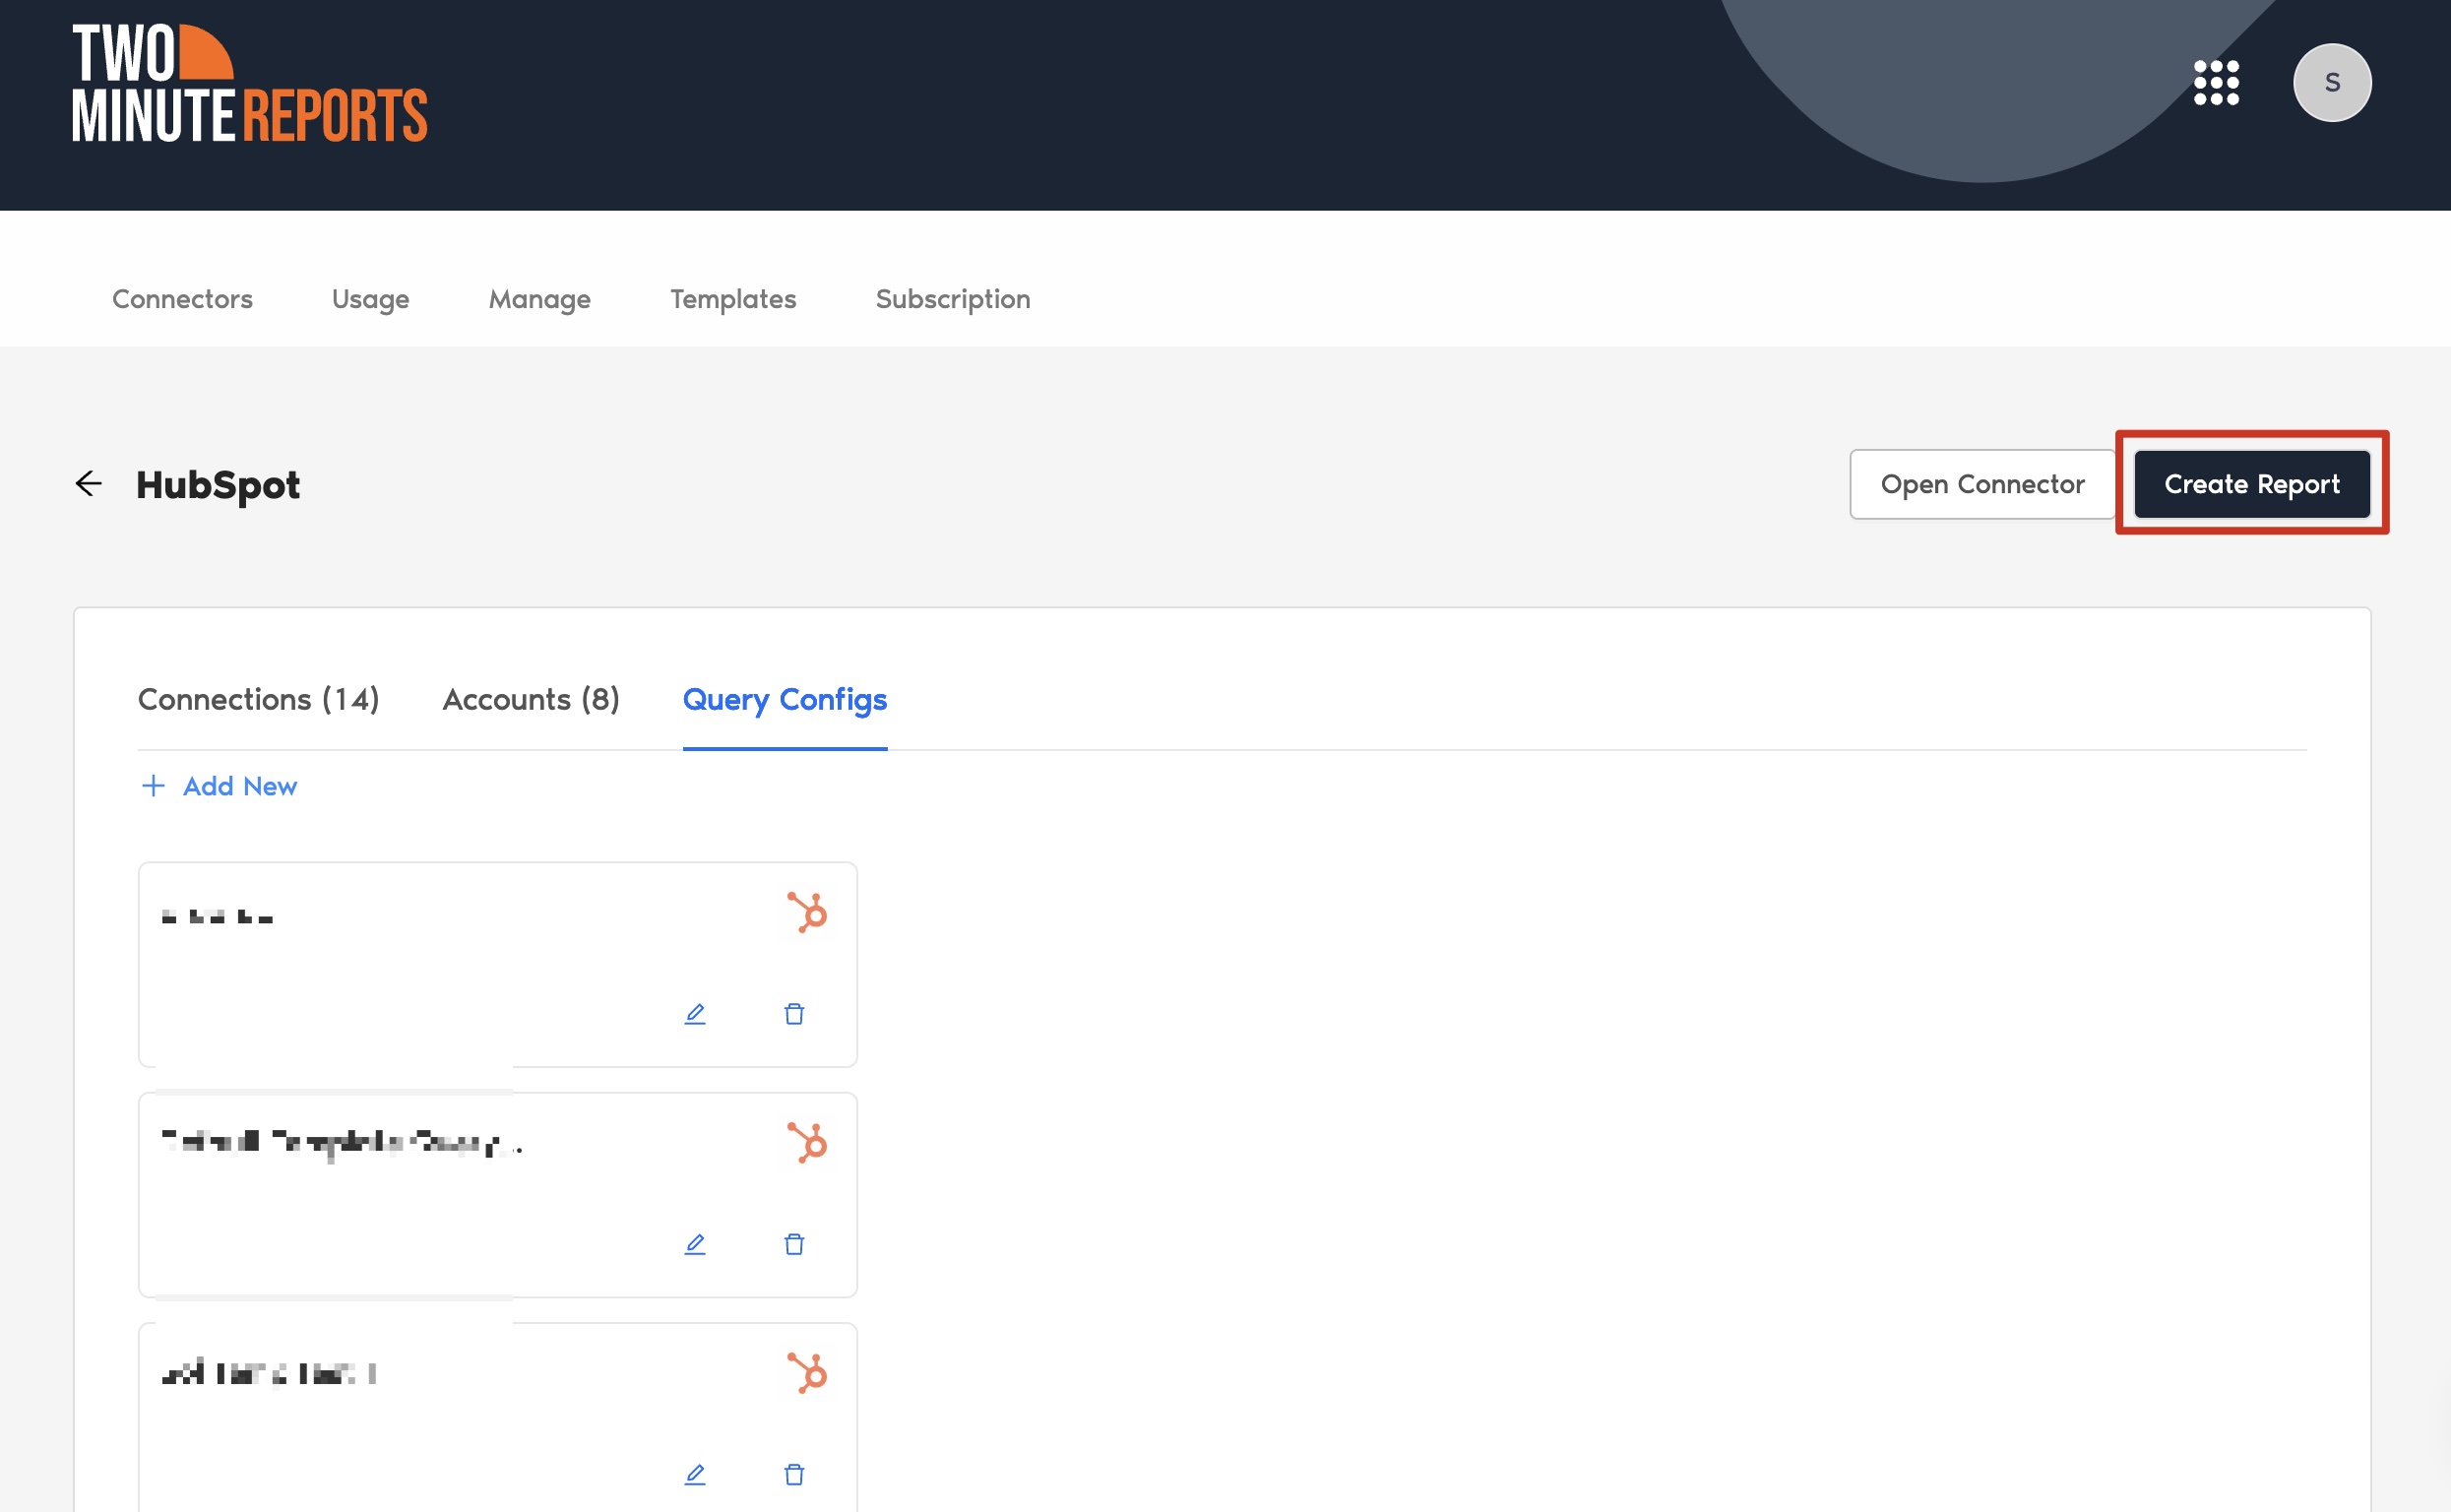
- After creating the Query Config, click Create Report in the top-right corner.
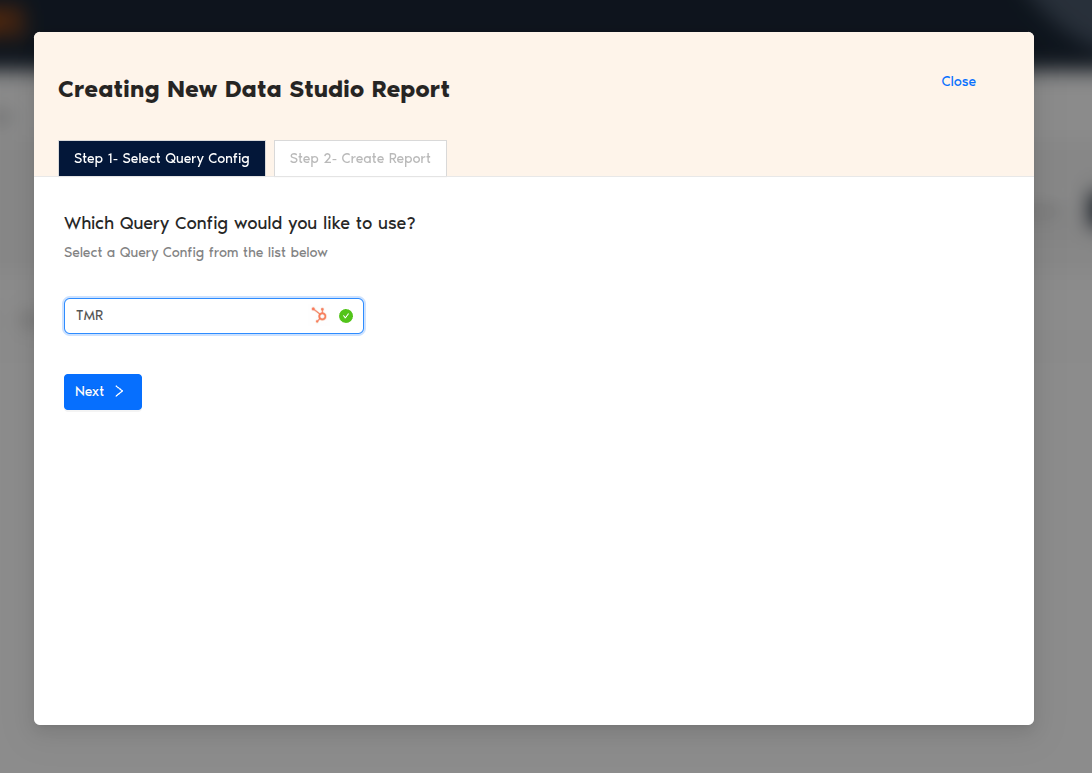
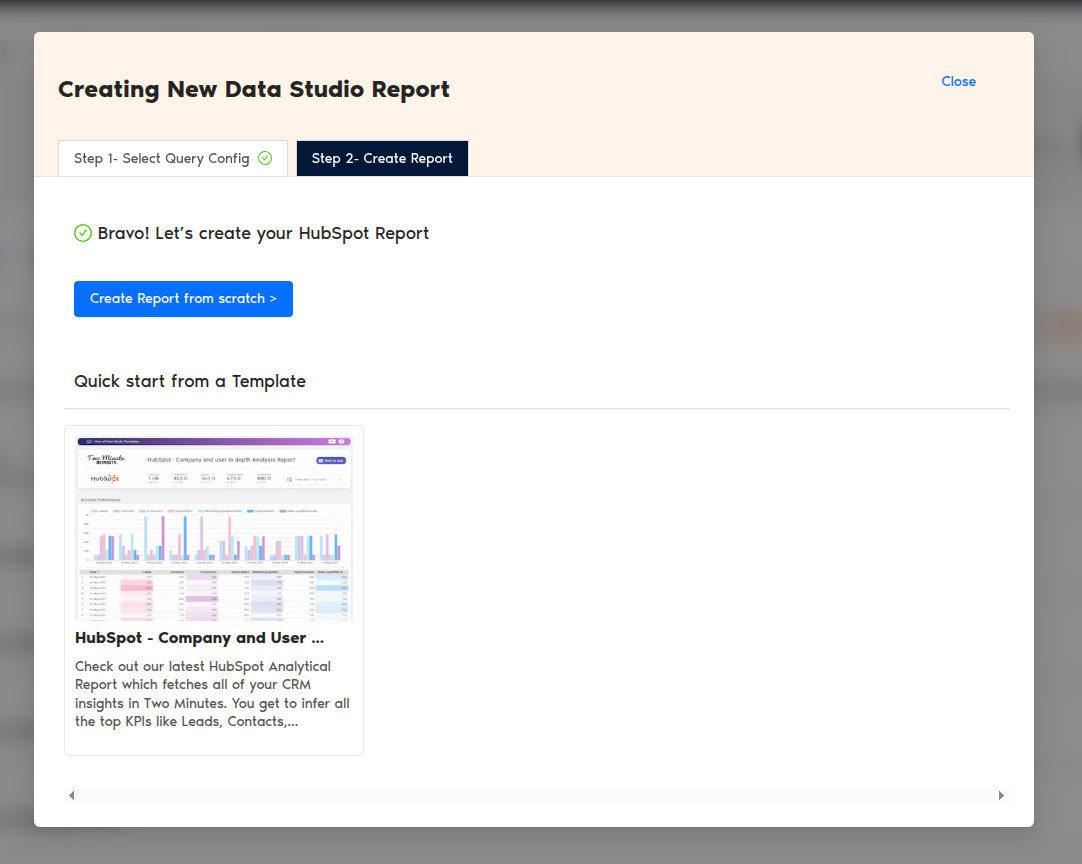
- Select the Query Config that you’ve created (in our case, it’s ‘TMR’) from the list of options. Click Next and choose ‘Create report from scratch’ to open the Looker Studio dashboard.
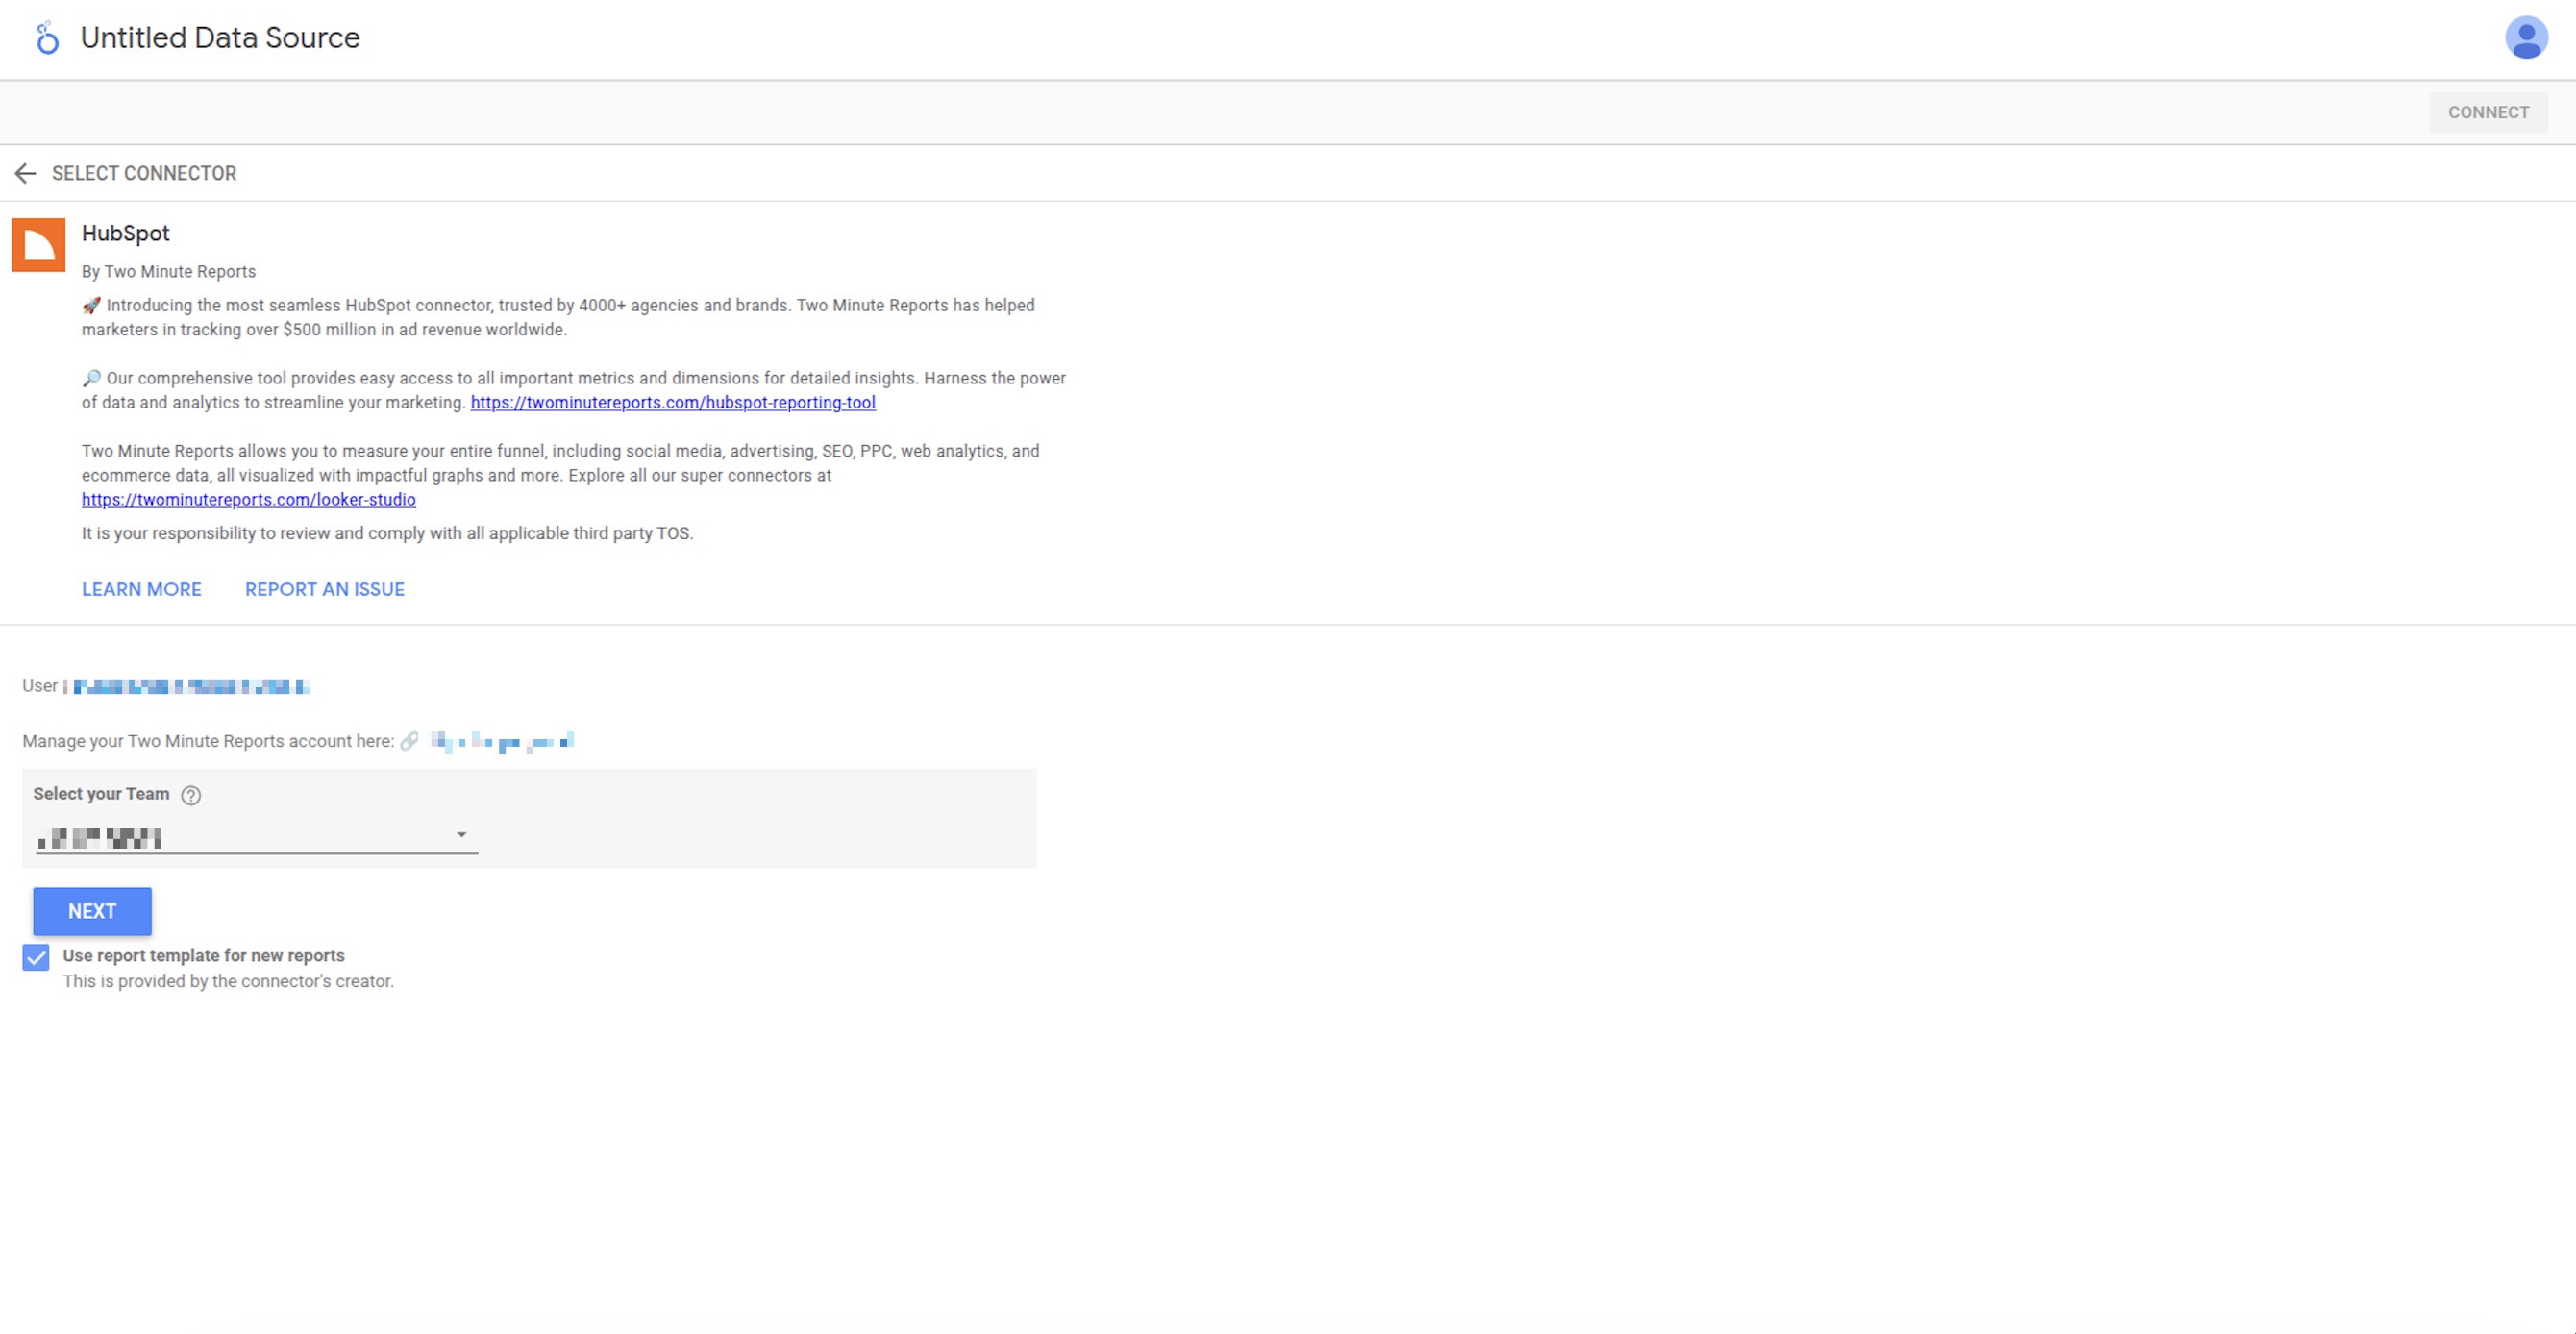
- Once the Looker Studio dashboard opens, select your team and the required Query Config from the dropdown. Click Connect in the top-right corner.
- After clicking Create Report, you’ll be directed to the Looker Studio dashboard. Here, you can drag and drop the associated HubSpot metrics and dimensions to analyze your campaign performance.
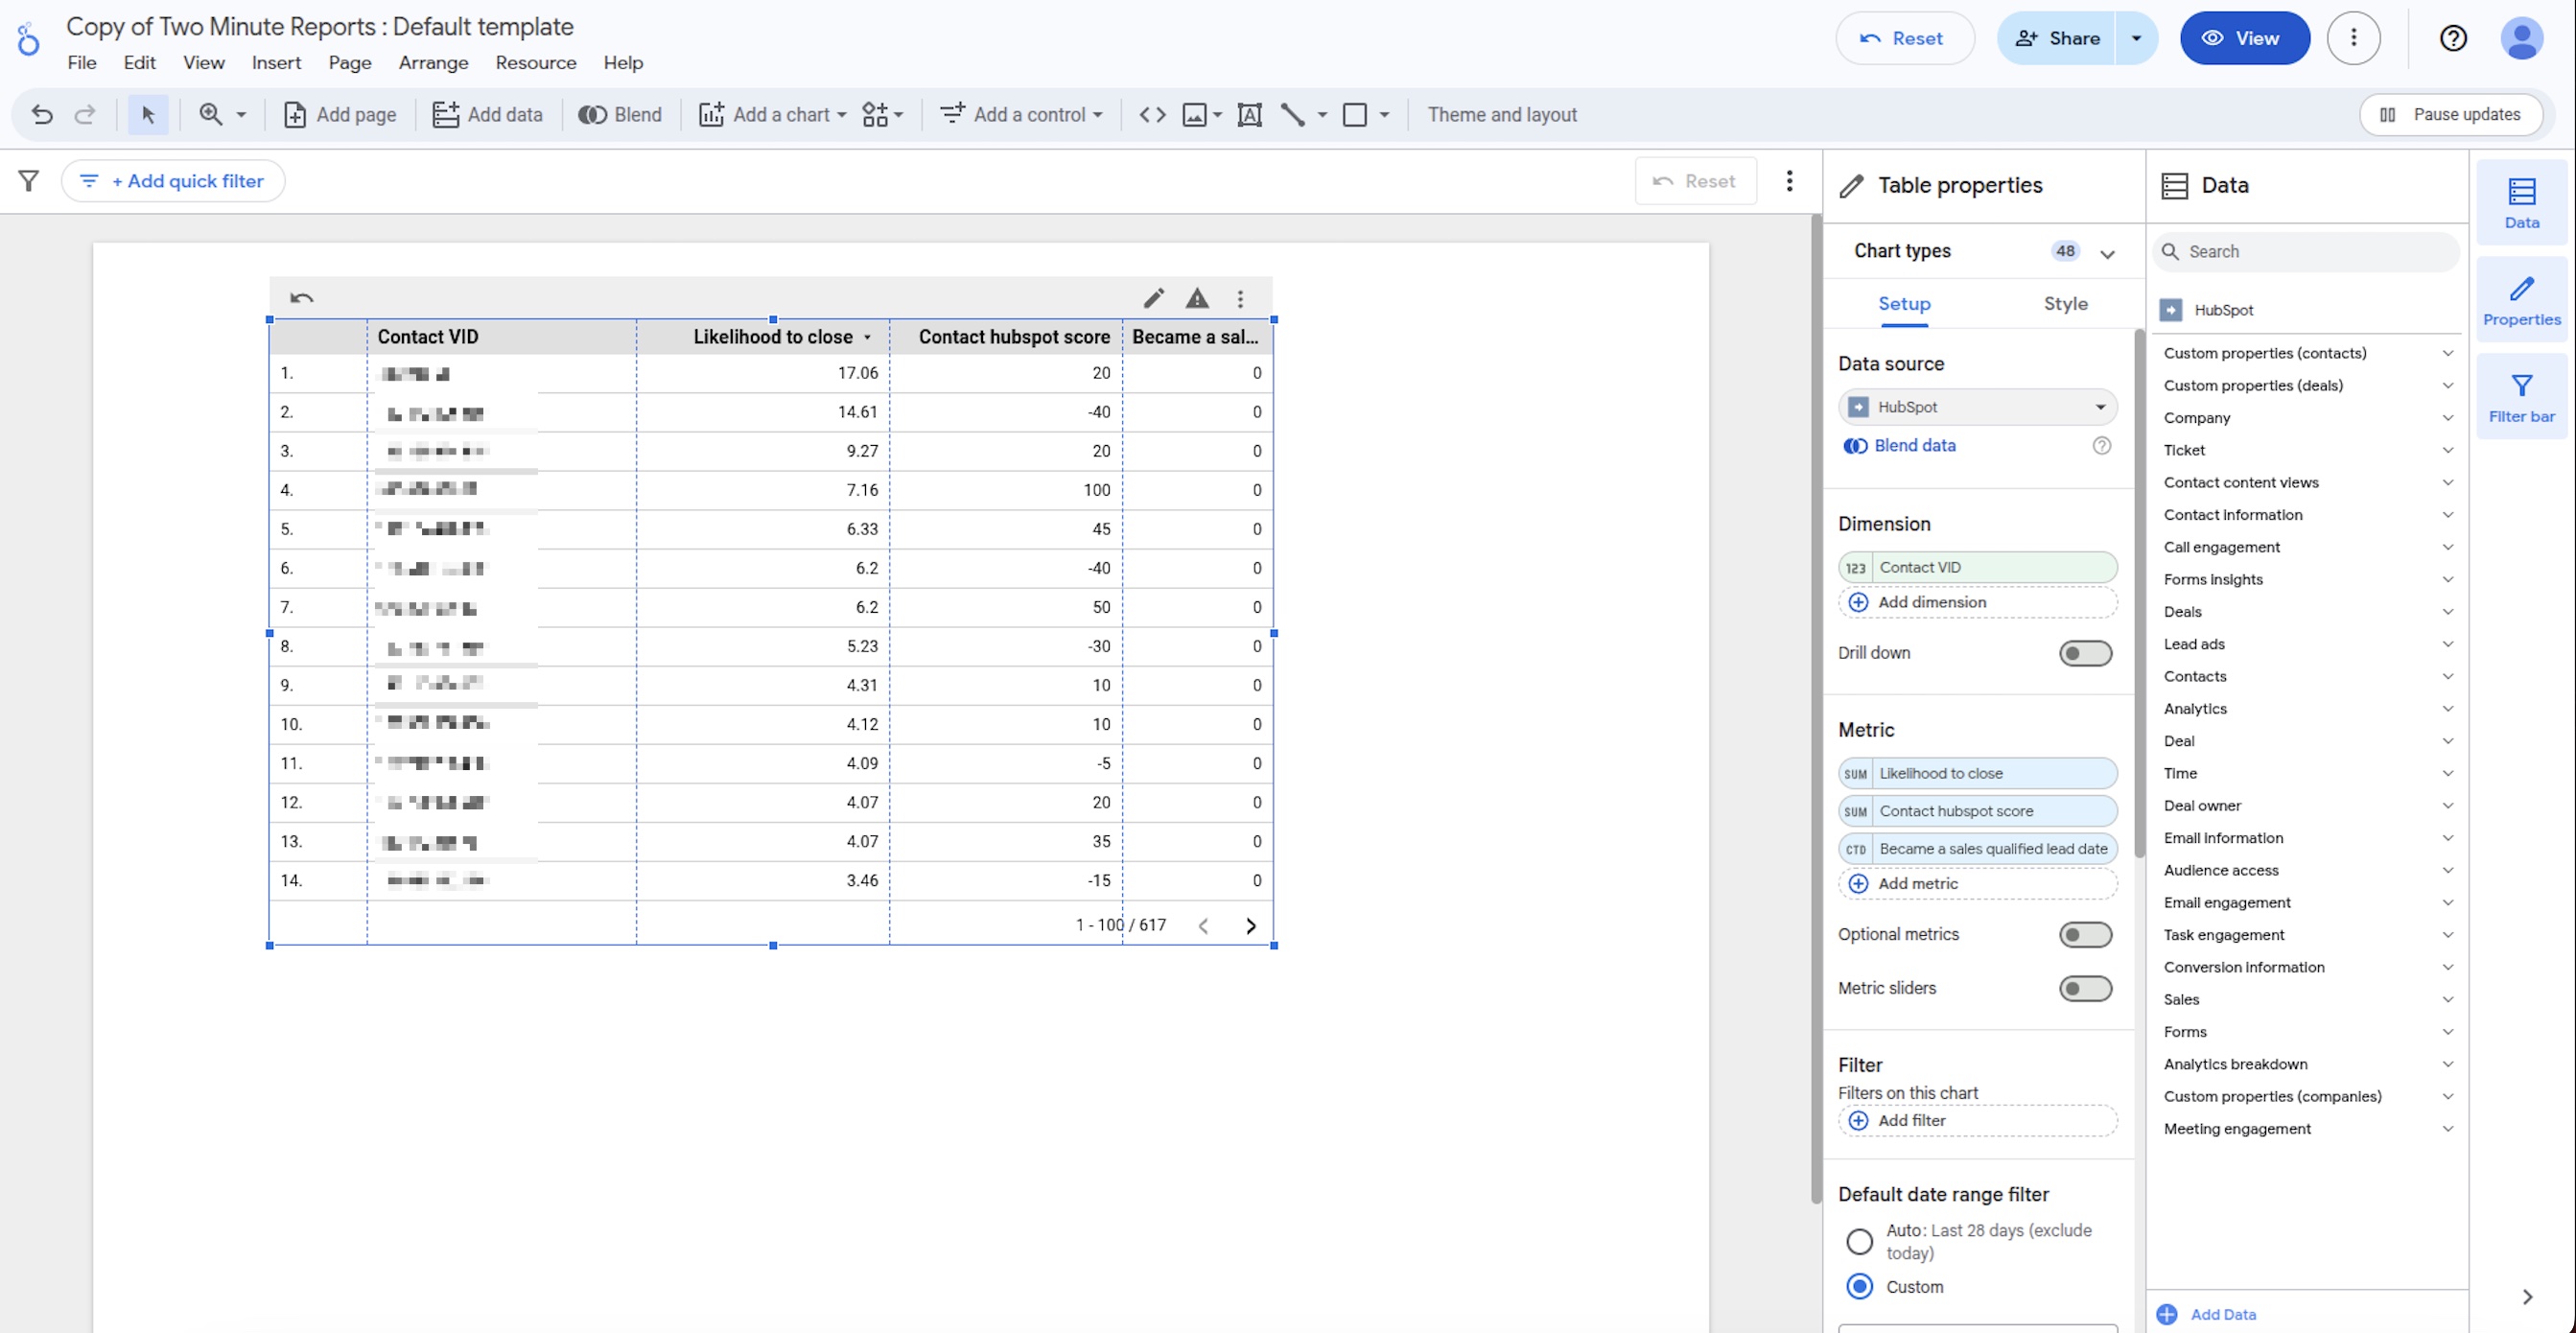
- To make your Looker Studio report compelling, use charts and visualizations. Click Add a chart and choose relevant chart types to configure your dashboard.
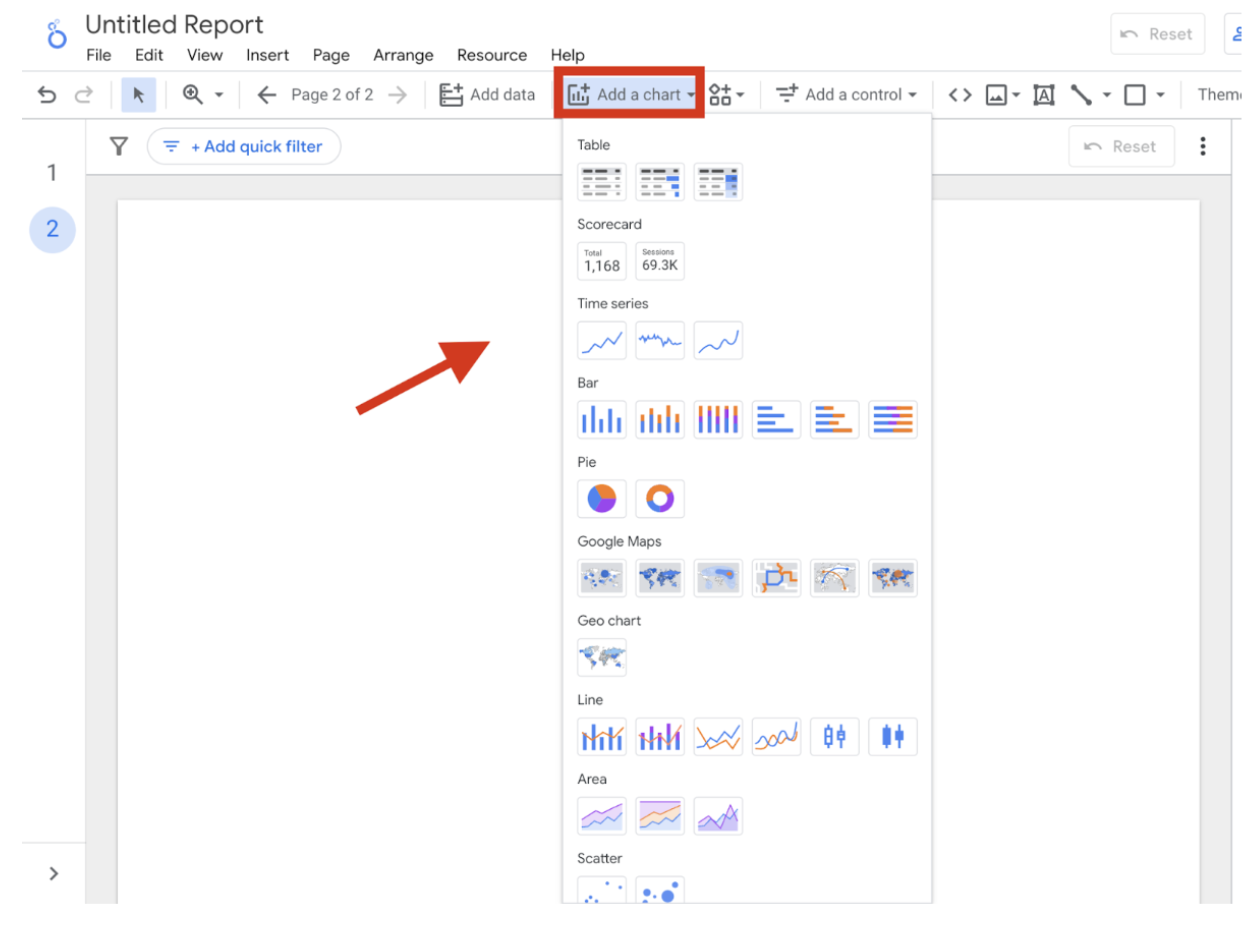
For instance, you can use bar charts to visualize key HubSpot metrics, such as email open rates, CTR, and lead conversion rates. These insights enable you to identify which campaigns are generating the most engagement and conversions, allowing you to refine your marketing strategies.
Note: We’ve also listed some common issues marketers face when running reports on Looker Studio, along with practical solutions to address them. Read the full article here.
We hope you found this article helpful. If you have any questions, please contact our support team via [email protected].