Streamlining reporting starts with connecting the right client accounts. By integrating only the necessary accounts, you can access relevant client-level insights faster and deliver actionable Looker Studio reports – all through an easy-to-use, organized interface.
Now, let me walk you through the step-by-step process of creating a Connection in Looker Studio.
| 💡Terminologies used Connector: A Connector facilitates connectivity to a specific data source. For example, a Facebook Ads Connector provides connectivity to a Facebook Ads account. Connection: A Connection is a link between the data source and the Connector. For example, to get data from Google Ads, you must use the Google Ads Connector to create a Connection with your Google Ads account. |
Step 1: Visit the Two Minute Reports Hub and select the required Connector, as shown below.
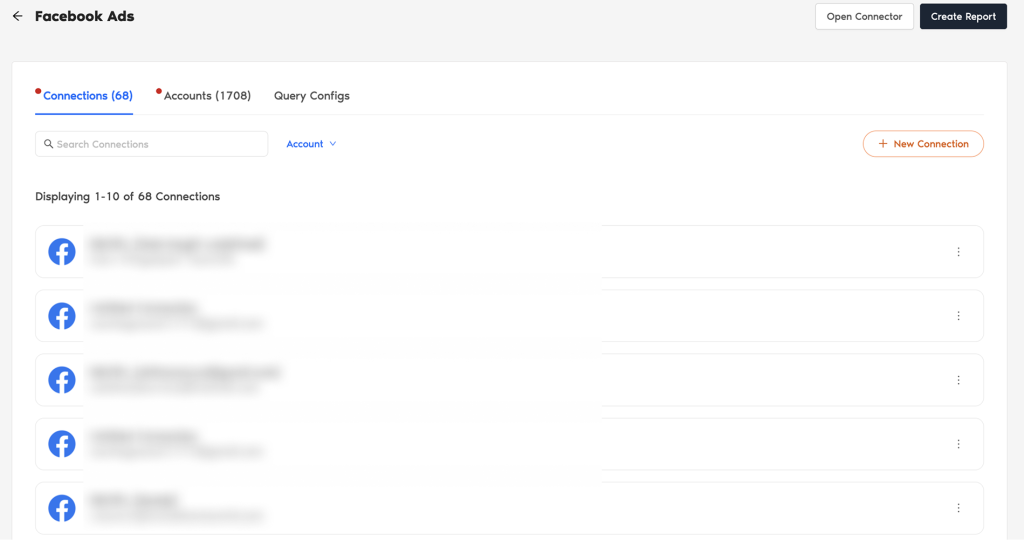
For instance, let us consider Facebook Ads. Once you click the Facebook Ads Connector, a dialog box appears.
Here you can visualize a unified view — Connections, Accounts and Query Configs.
- Connections – Easily access the Connections you create directly via the “New Connection”.
- Accounts – View the list of accounts mapped under respective Connections.
- Query Configs – Helps you group a list of accounts from which you can fetch and visualize data in your Looker Studio dashboard.
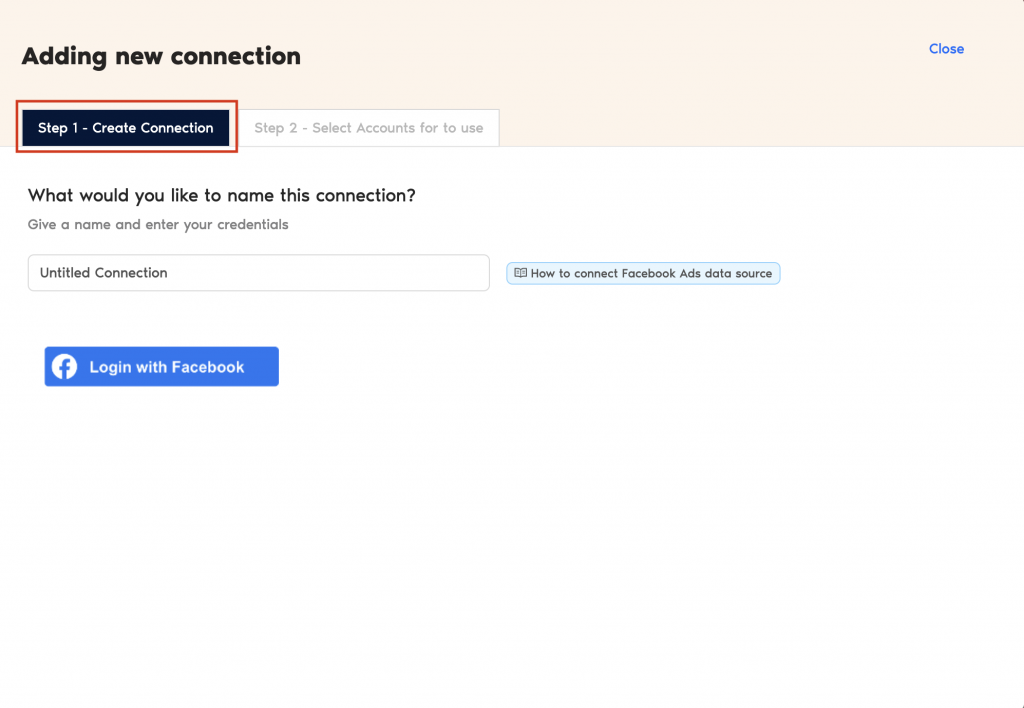
Step 2: To create a Connection, click “New Connection”. The “Adding new Connection” dialog box appears. Specify your Connection’s name and authenticate by entering the login credentials.

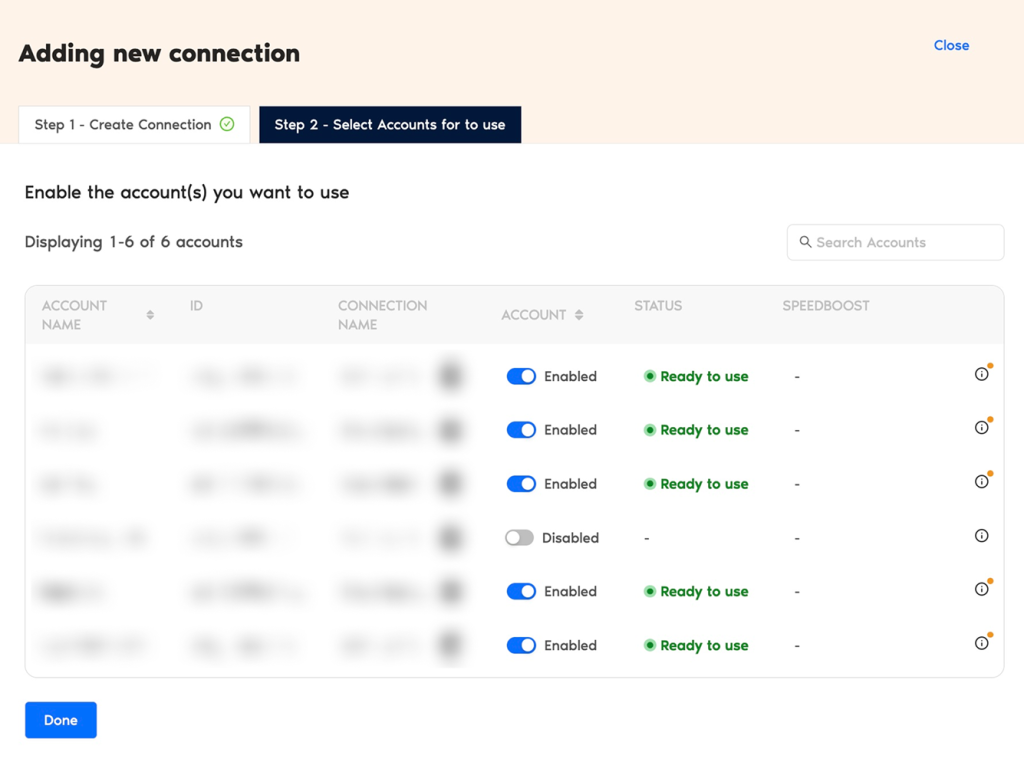
Step 3: Once the authentication is done, you can visualize a centralized interface that displays the account name, ID, Connection name, status, and Speedboost as shown below.
Step 4: You must enable the toggle for the accounts you want to run queries. Once done, the status will update to “Ready to use”, which means you can use the account to extract data and run queries. However, note that you cannot fetch data for disabled accounts.
Note: If your enabled account is in the “Warming up” stage, you can only retrieve data once the process is complete. This applies to Shopify and Amazon Ads connectors. You can view the progress right after the status to know the estimated time of completion.
That’s it! You’ve created a connection in Looker Studio. You are now ready for the next step: running queries to extract actionable insights. Check out “How to run a query in Looker Studio” to get started.
We hope you found this guide helpful. If you have any questions, please contact our support team via [email protected].

