Google Analytics 4 enables marketers to track, measure and optimize the performance of their websites, apps, or other digital properties using various metrics. Before connecting your GA4 data to Looker Studio, ensure you have the following permissions:
Required permissions
To access and view data in Google Analytics, you need a Google Account with Viewer access at both the Property and View levels. This official documentation provides more information about access management in Google Analytics.
Once you confirm these prerequisites, follow the steps below to connect your GA4 data to Looker Studio via Two Minute Reports.
Step 1: Streamline your GA4 account in Looker Studio
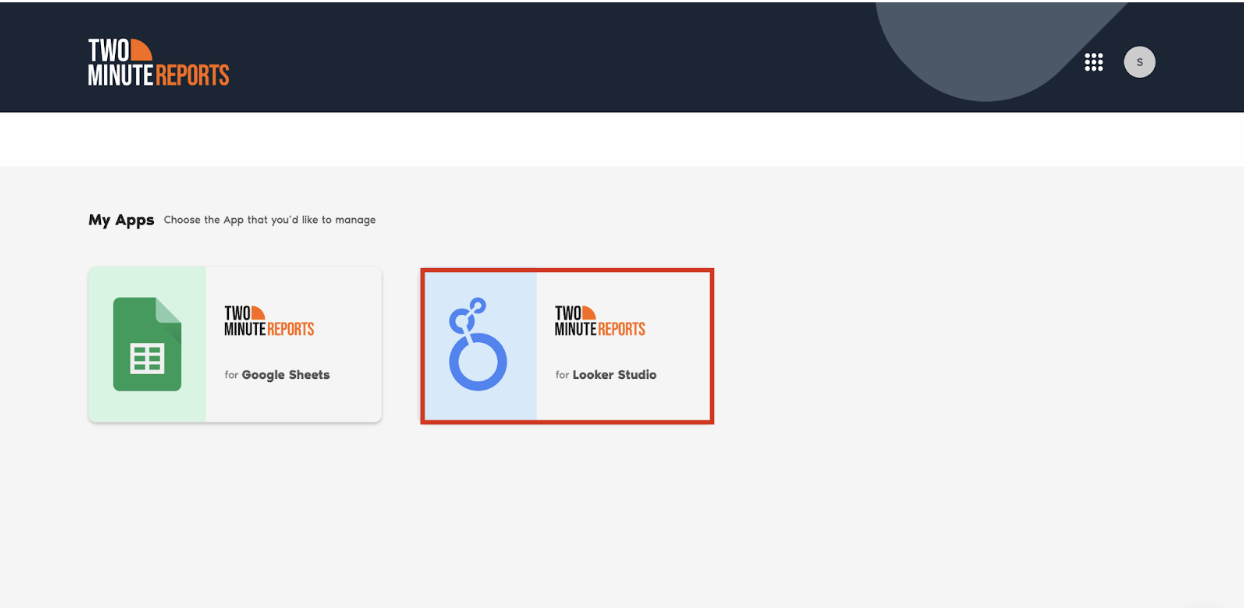
- Go to https://apps.gox.ai/. Select Two Minute Reports for Looker Studio.
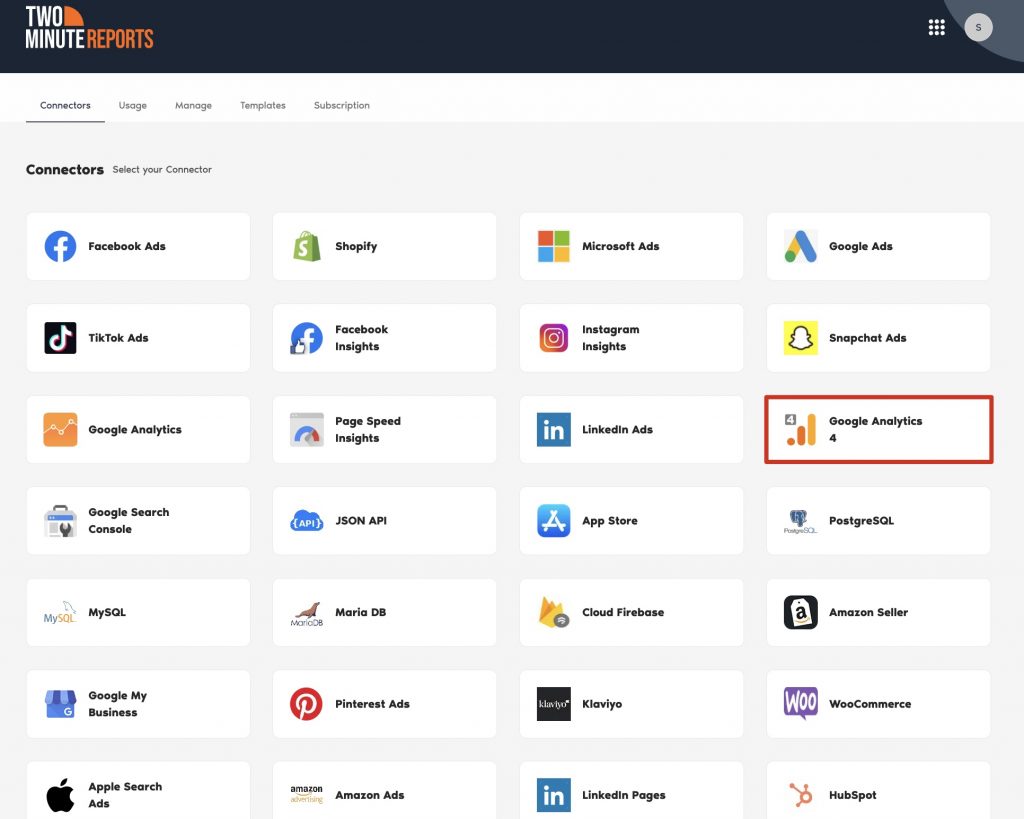
- Choose Google Analytics 4 from the list of Connectors.
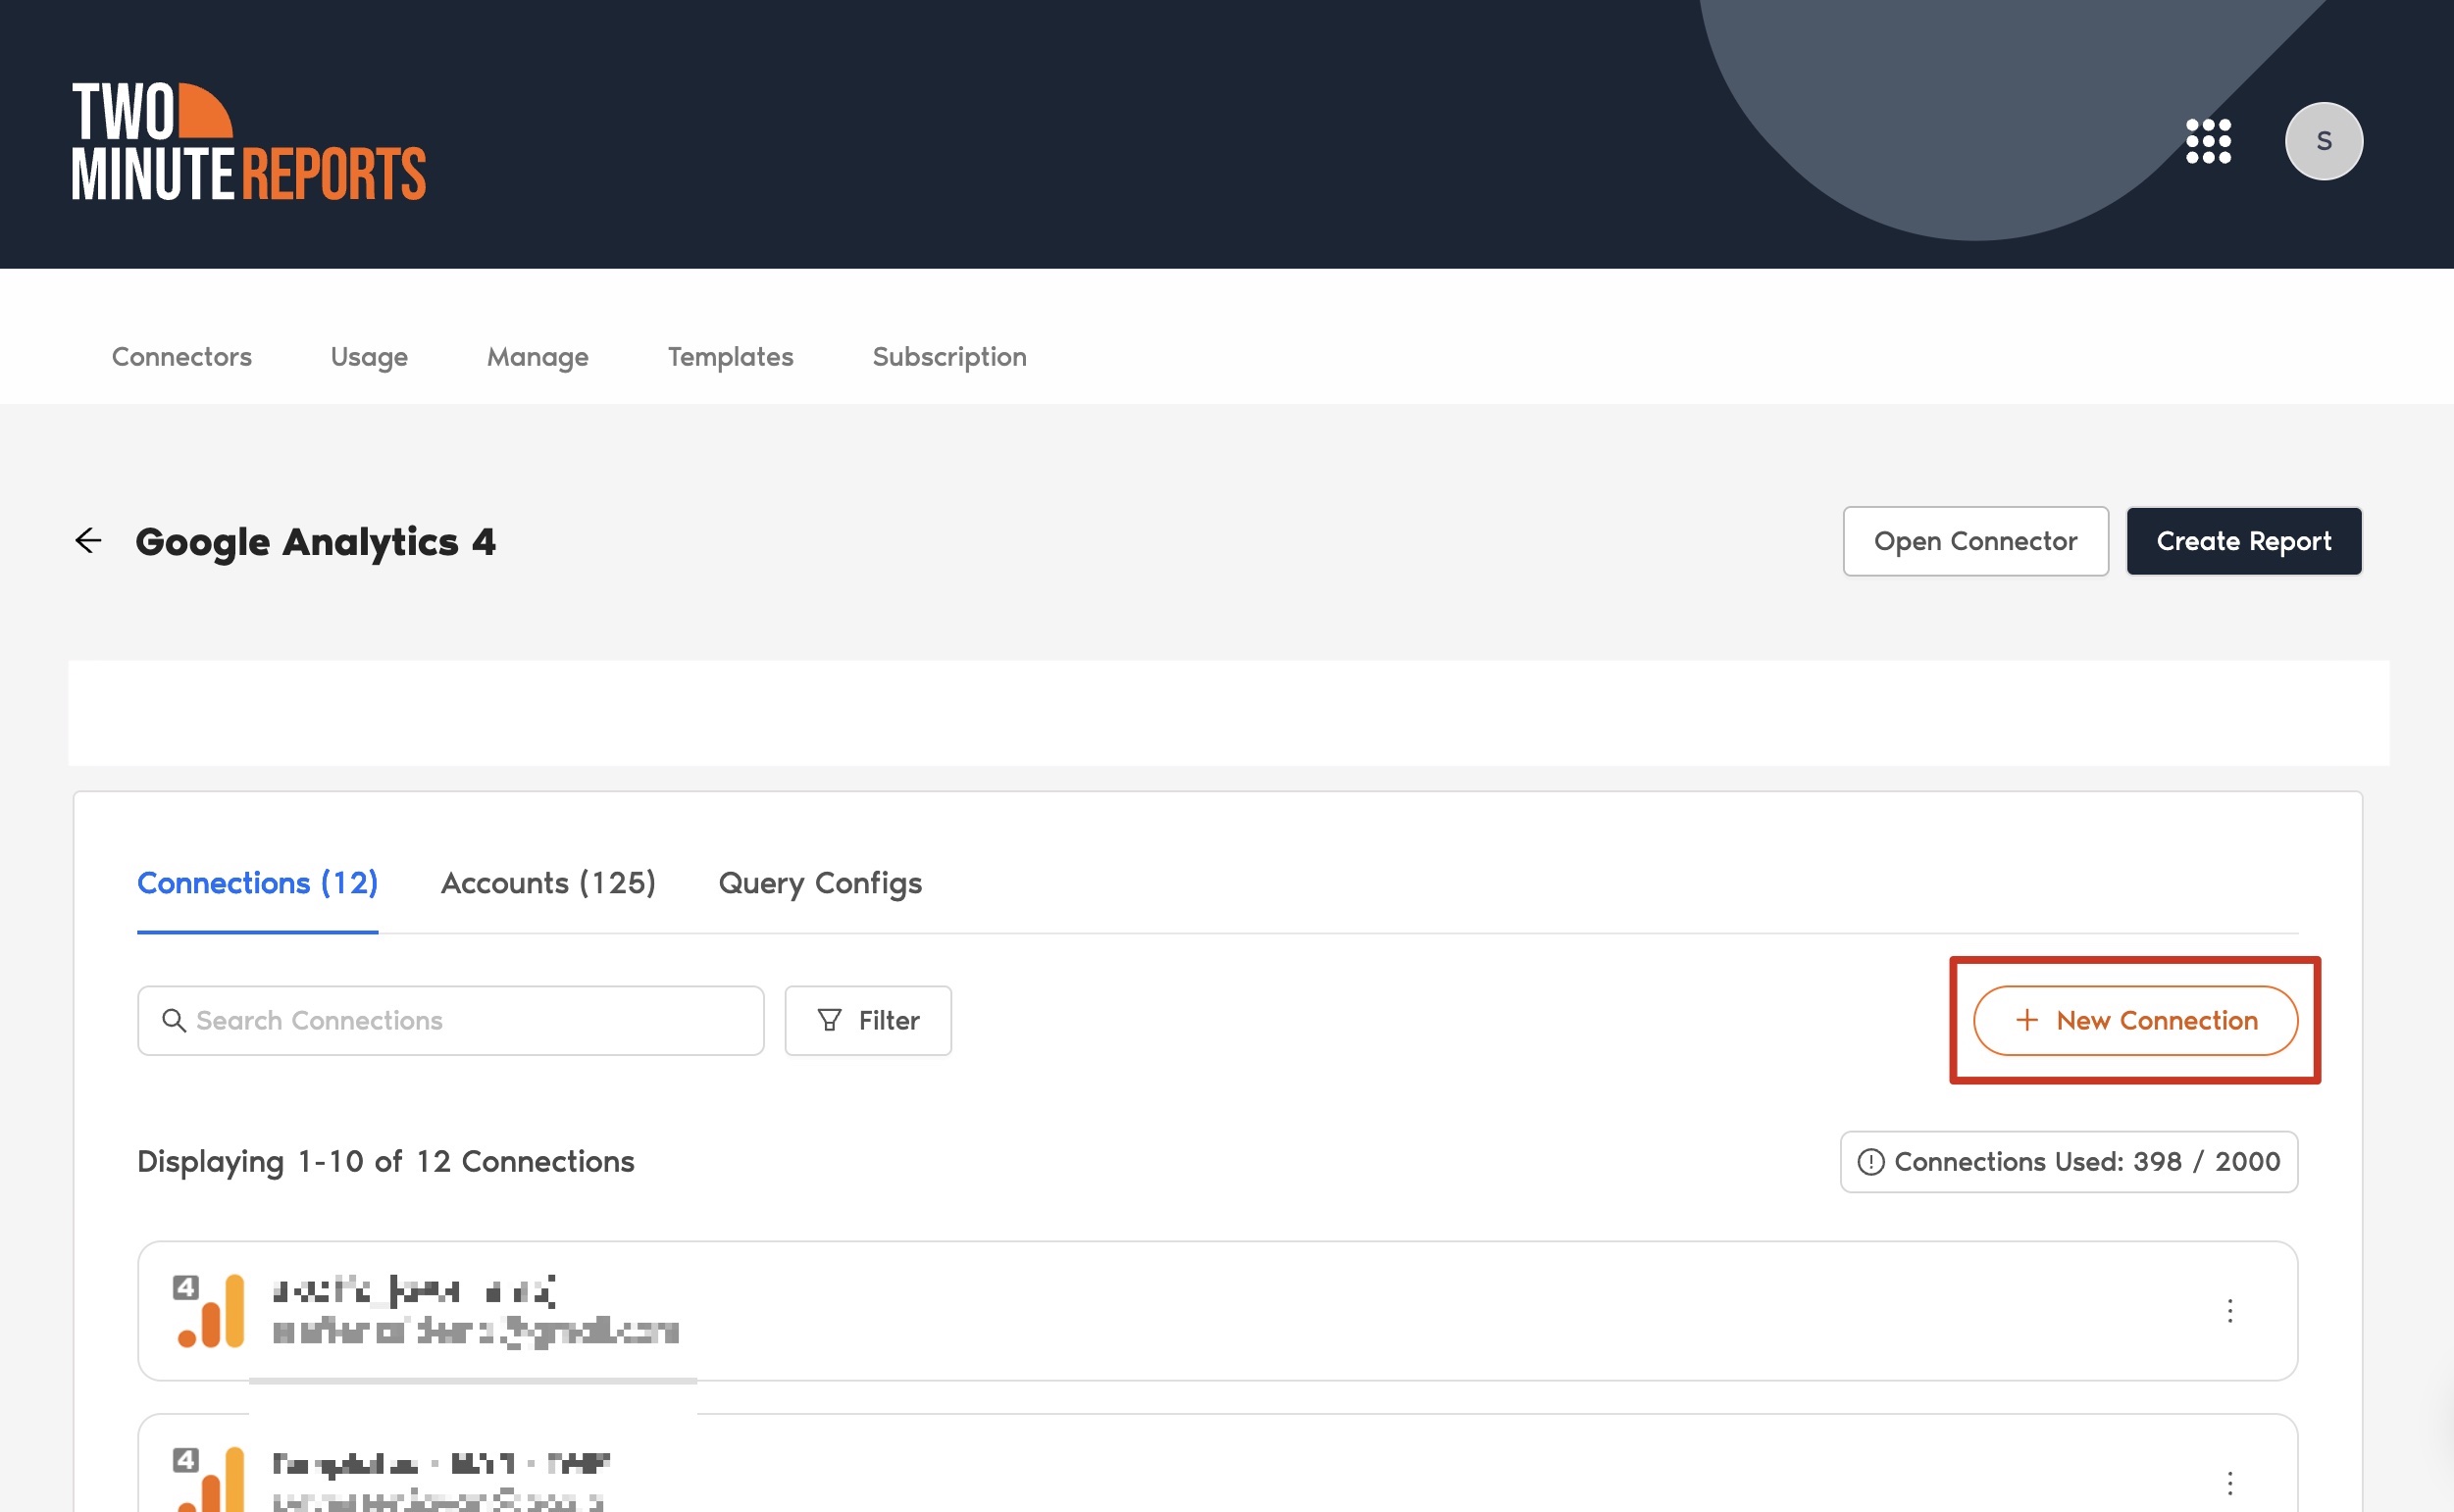
- Next, connect your GA4 data. Click New Connection to start creating your Connection in Looker Studio.
In the Adding new connection dialog box, follow these steps to connect your GA4 data:
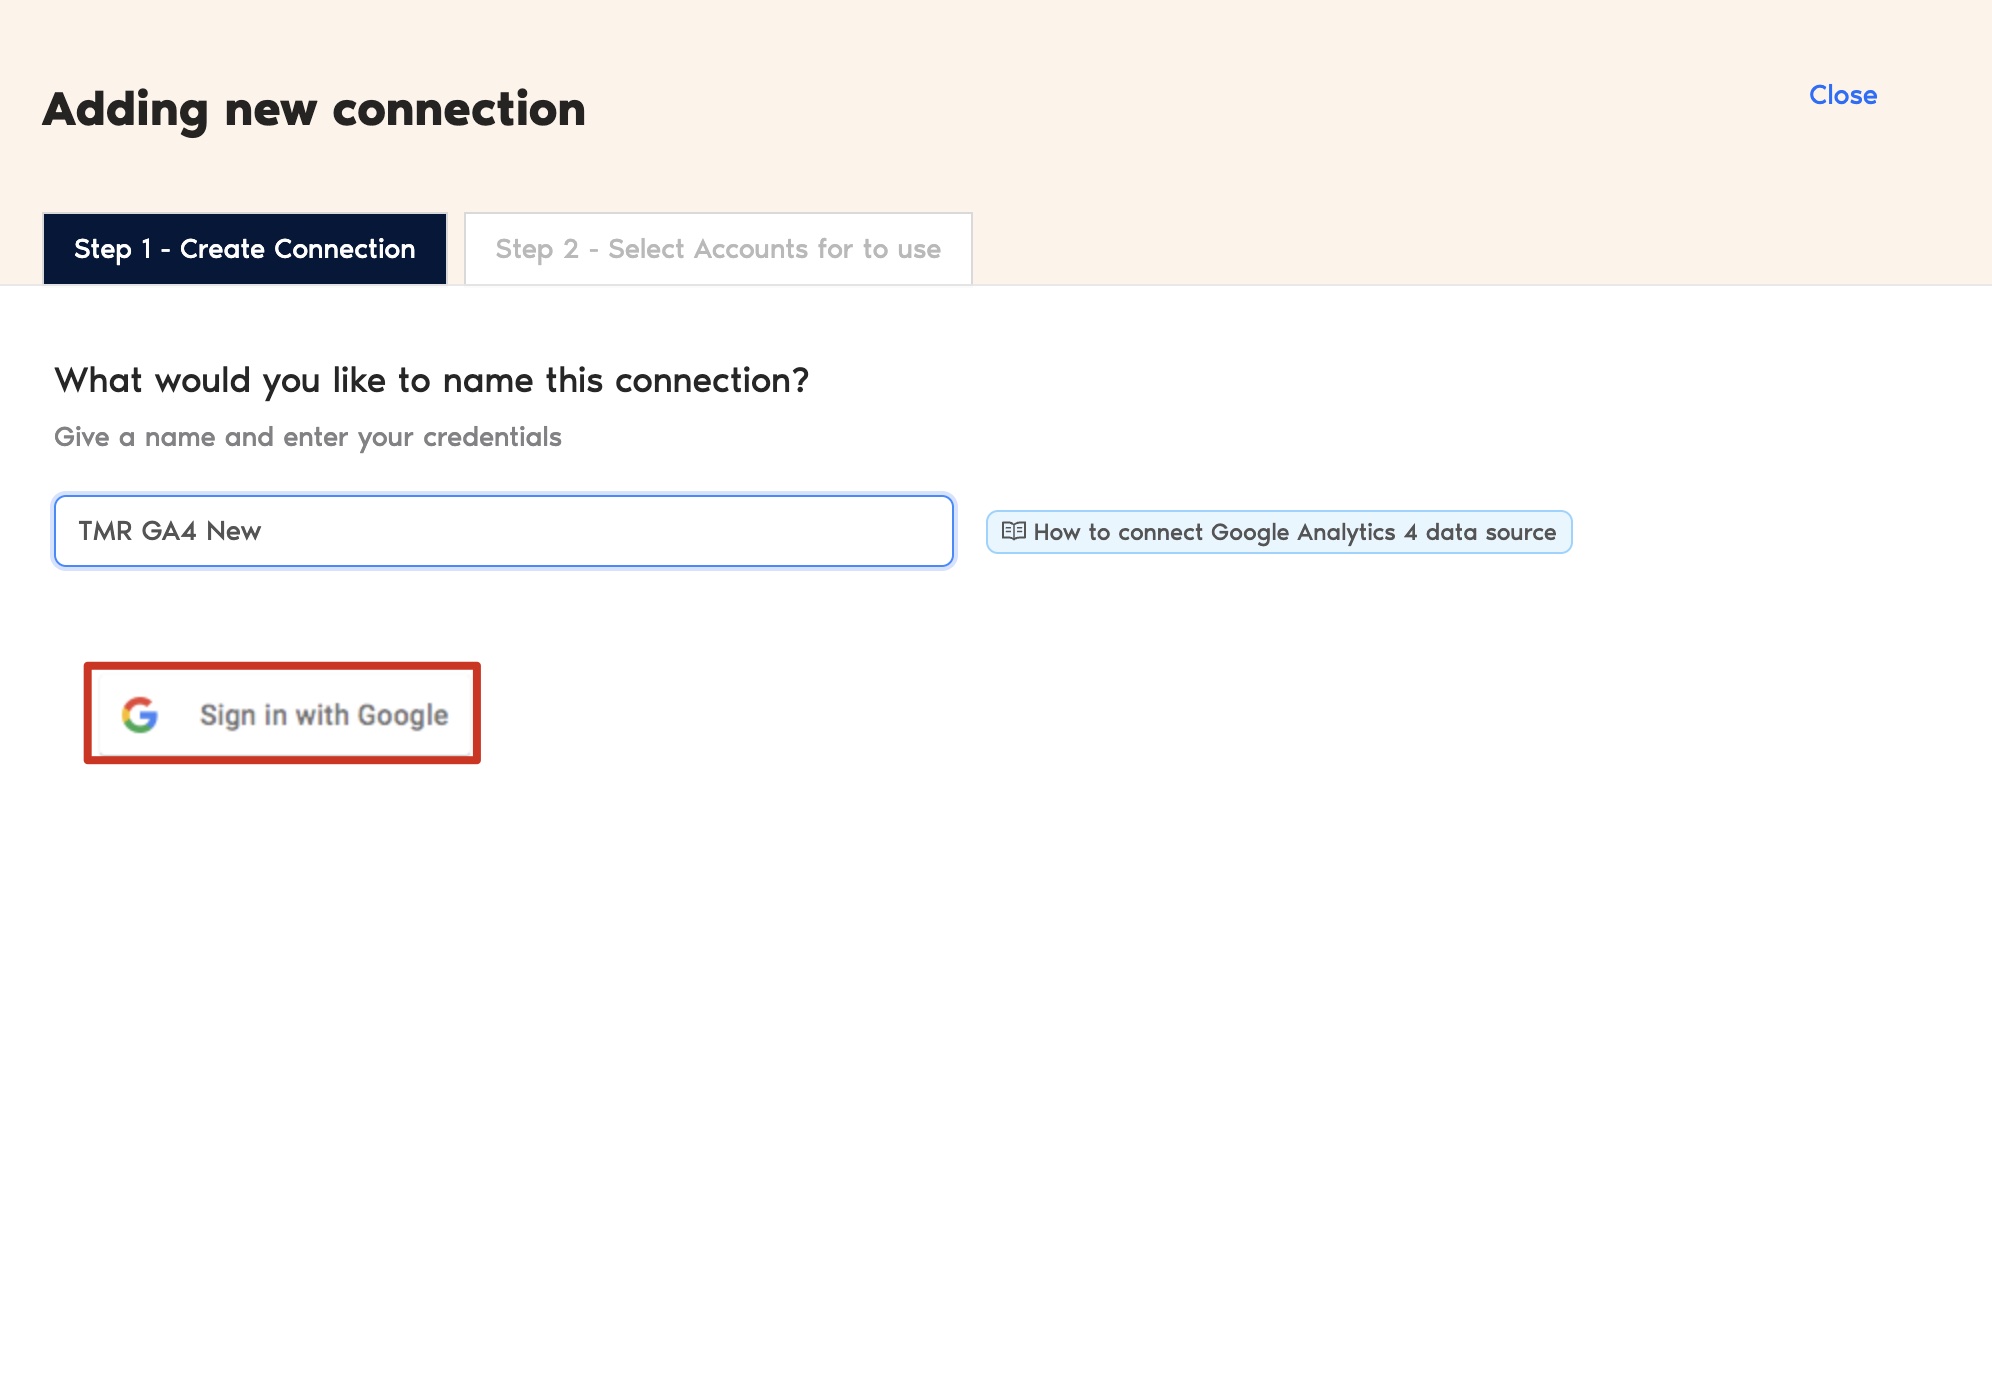
- Creating a Connection: Name your Connection and authorize the Gmail account linked to your GA4 account.
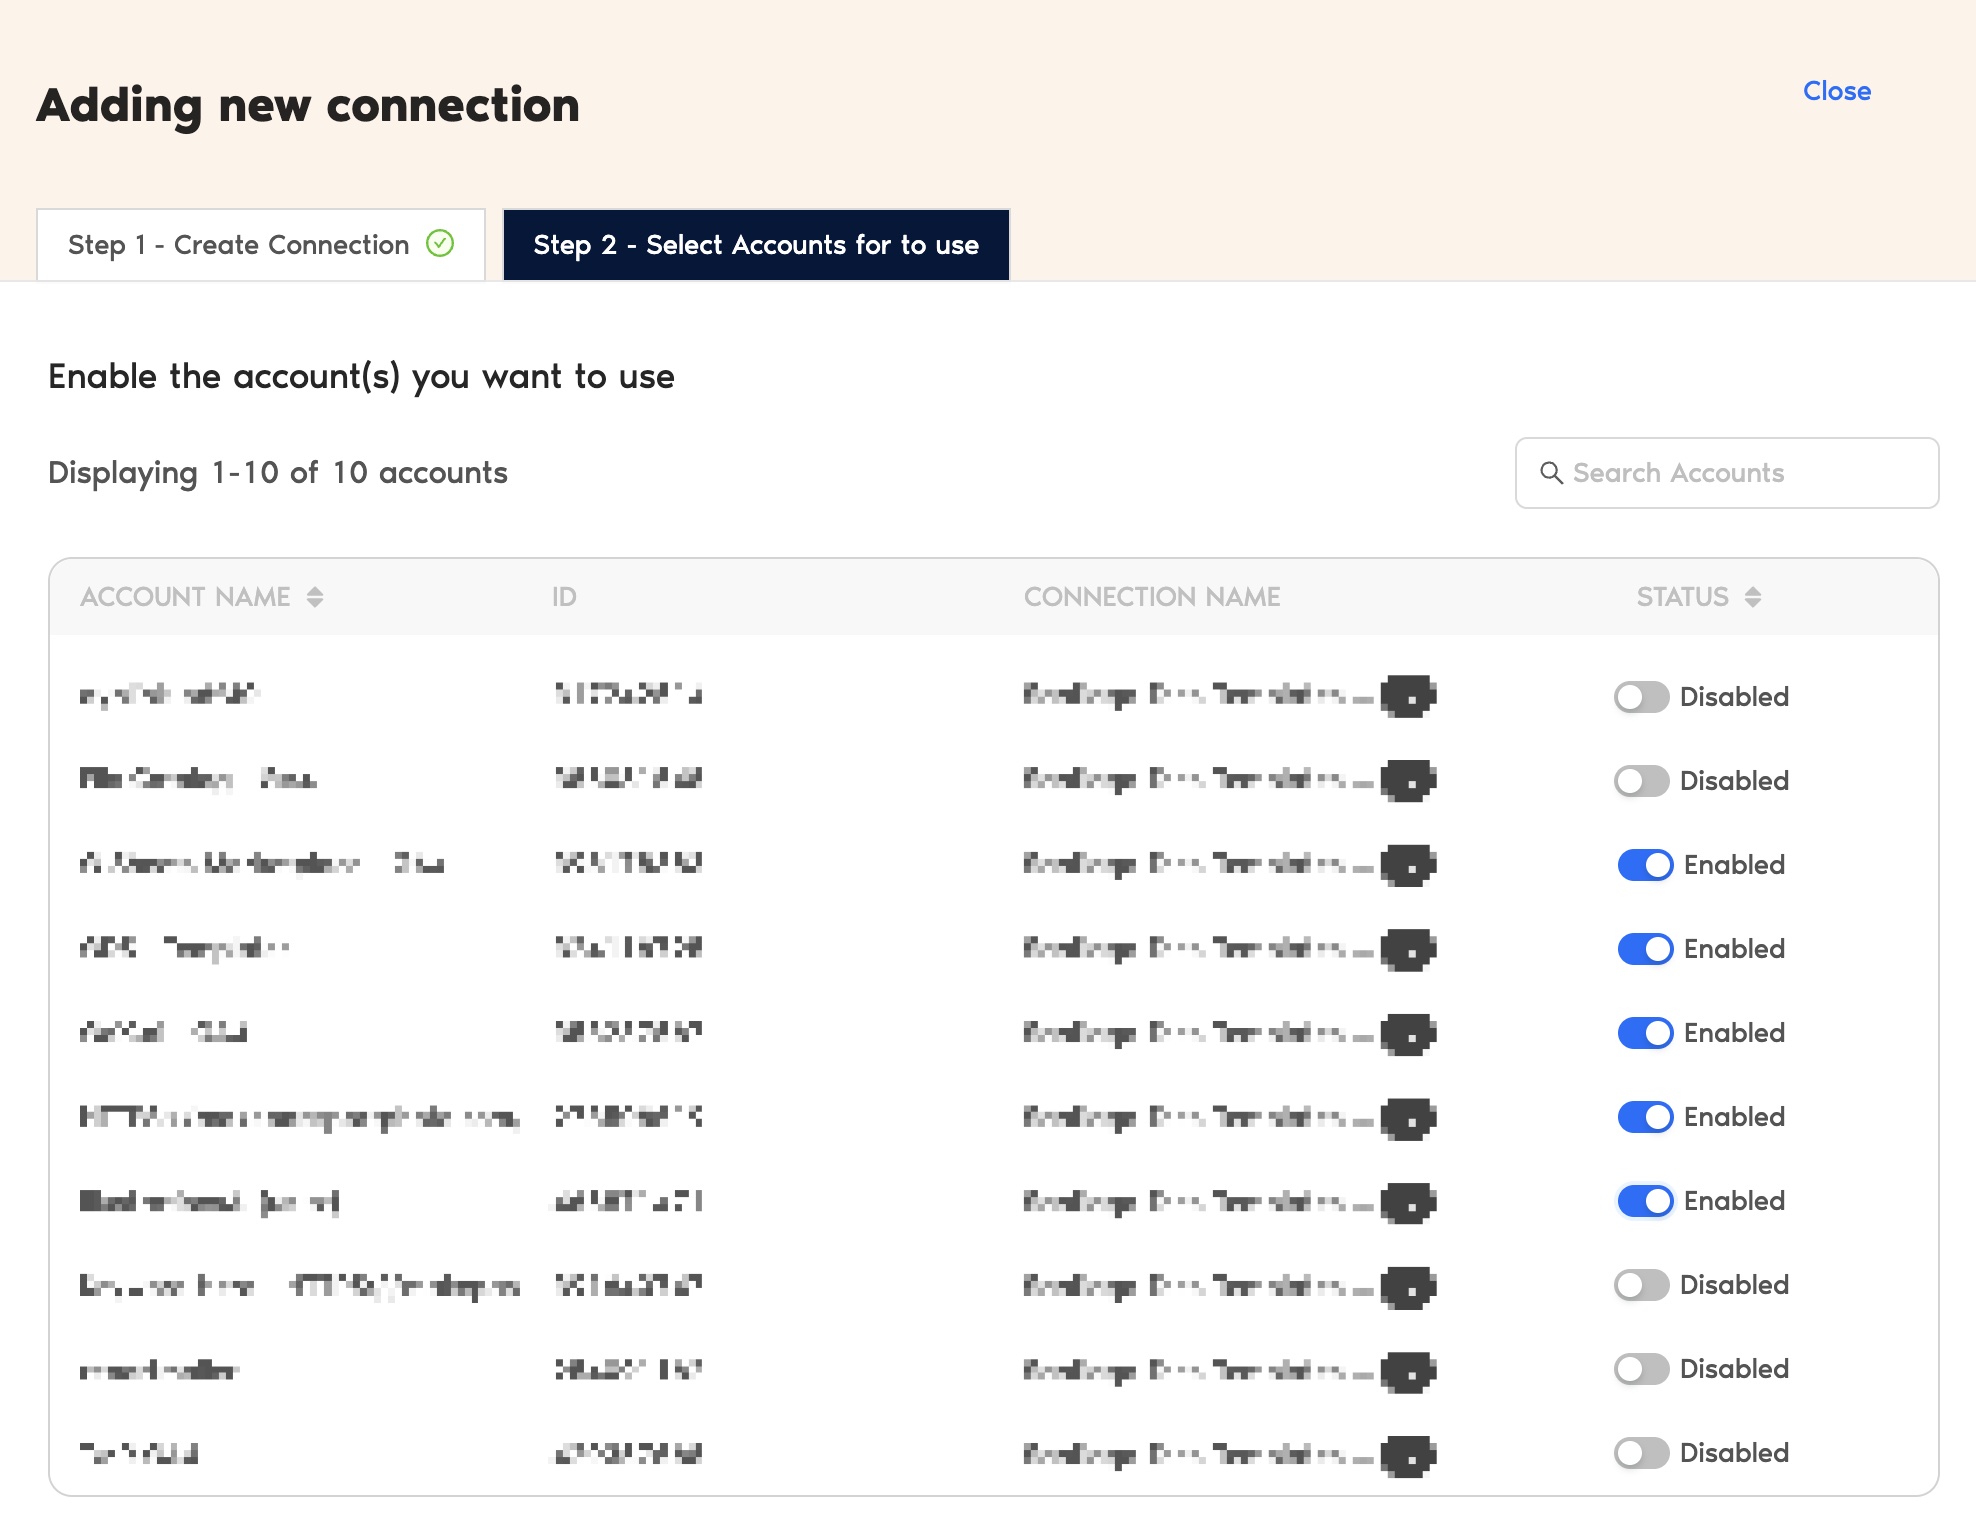
- Select accounts for use: Once authenticated, enable the necessary accounts to extract actionable performance insights as shown above. Note that you can only create reports for the enabled accounts.
And that’s it. You can now configure your GA4 account to extract meaningful results.
Step 2: Configure your GA4 account with TMR
- In the Query Configs section, click + Add New.
| Query Config lets you group multiple accounts, making it easier to view centralized insights in your Looker Studio dashboard. |
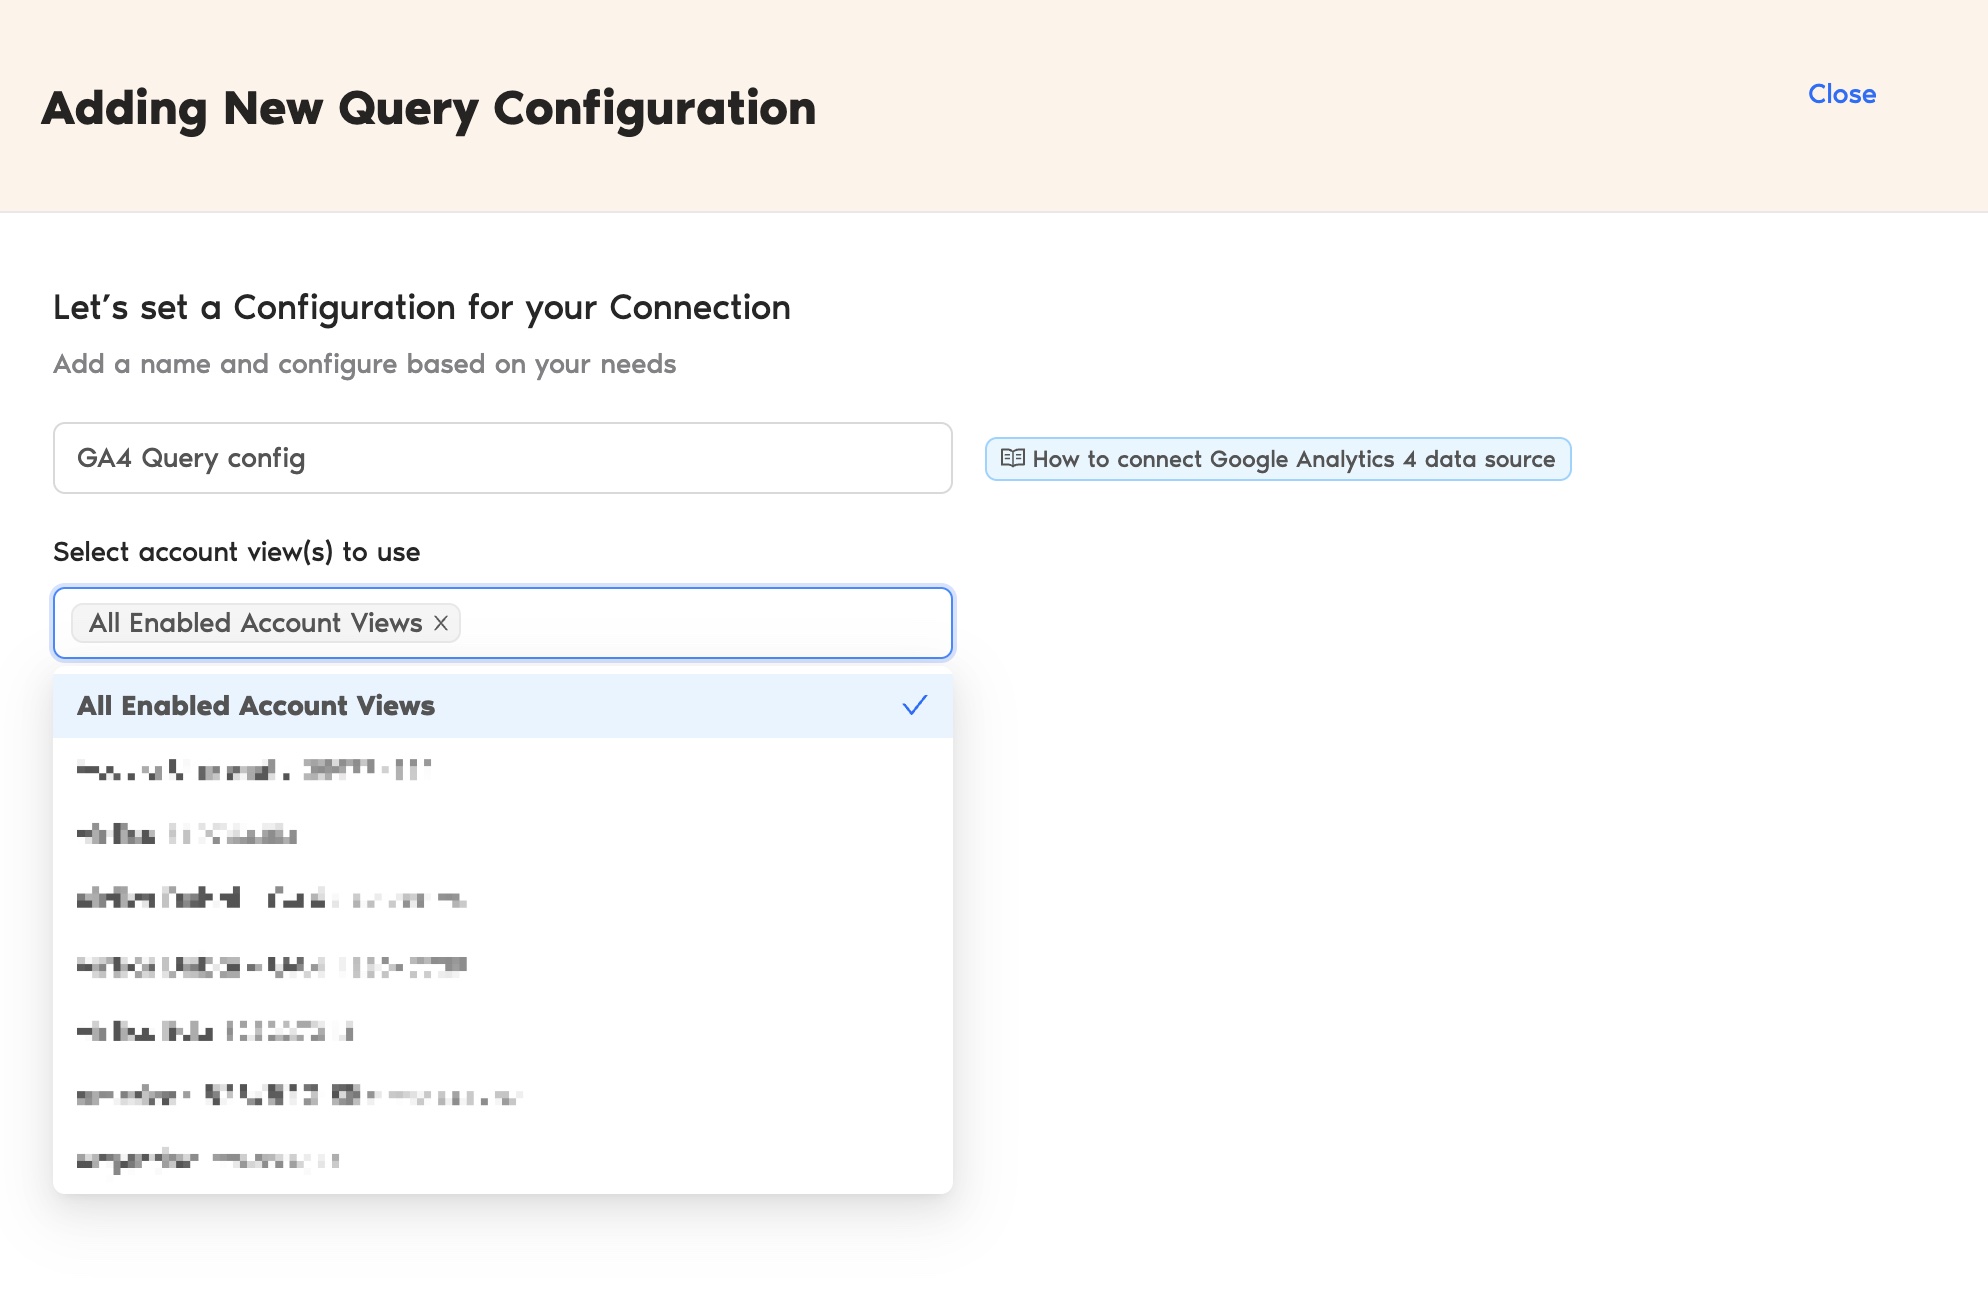
The Adding New Query Configuration dialog box appears. Here you can:
- Name the query config.
- Select (from the list of enabled) GA4 accounts from the dropdown.
- Configure your GA4 report.
Once done, click Save.
You’ve successfully created a new configuration, which you can use to extract data for your Looker Studio reports.
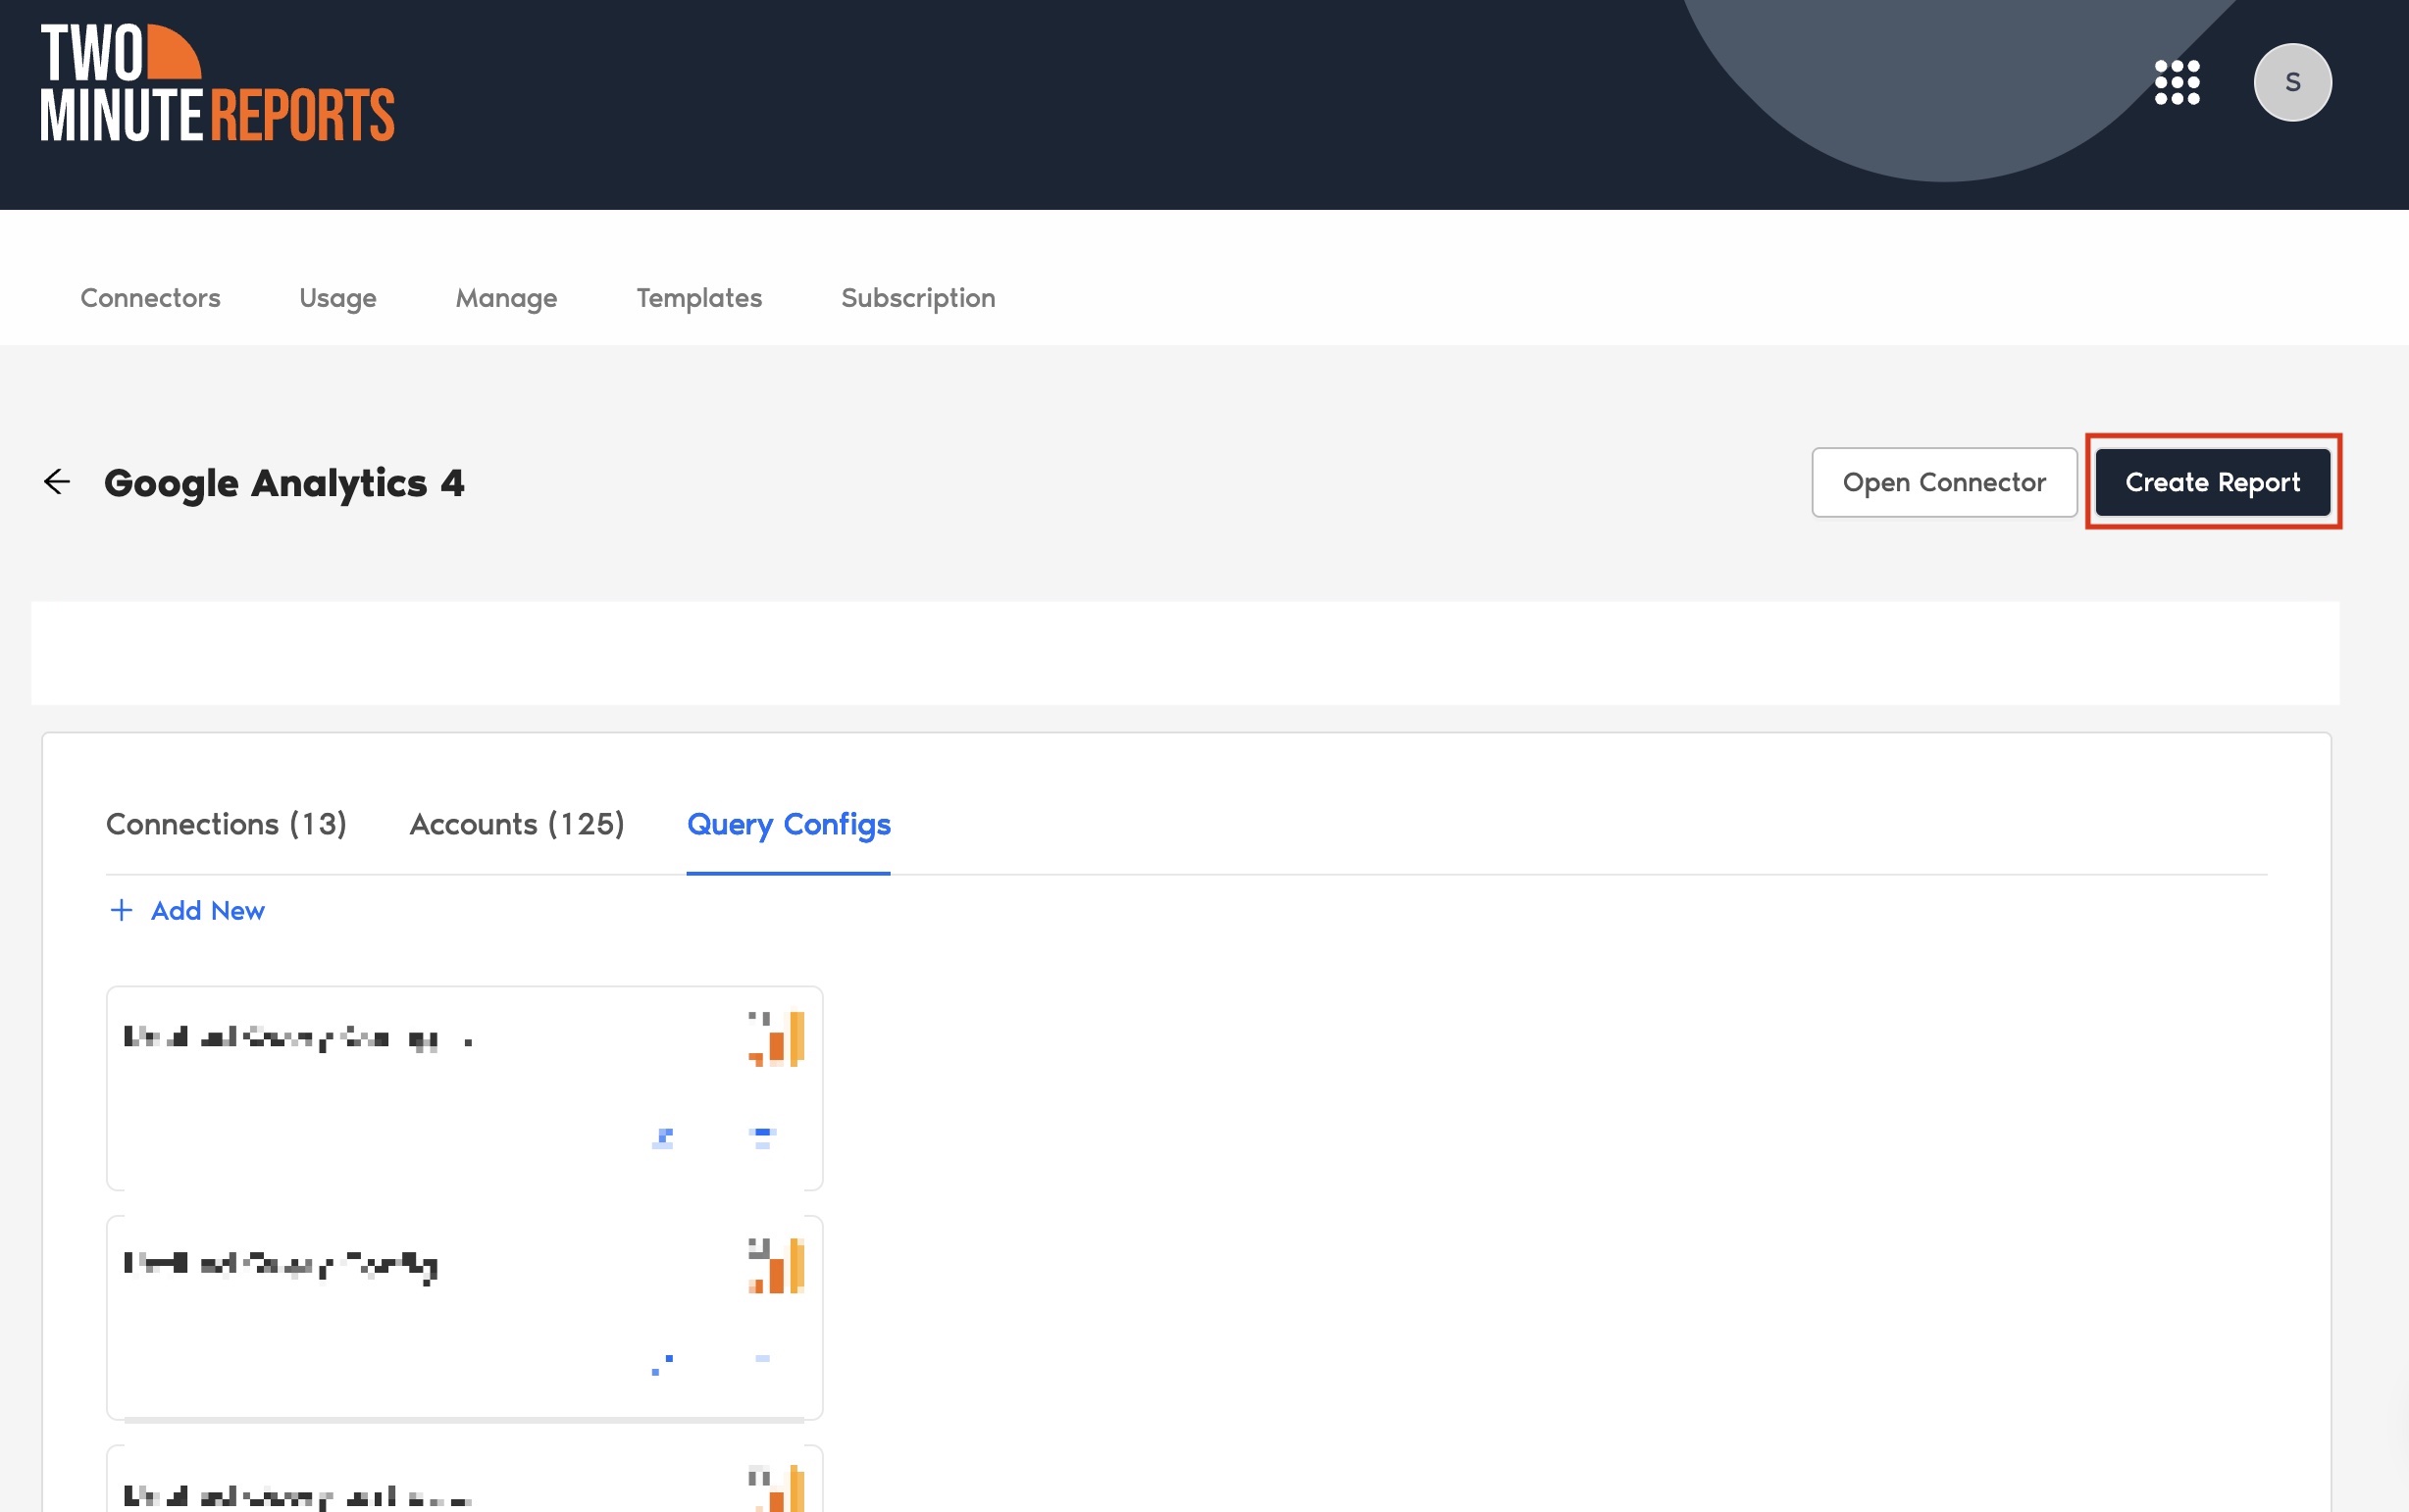
Step 3: Create a GA4 report with TMR in Looker Studio
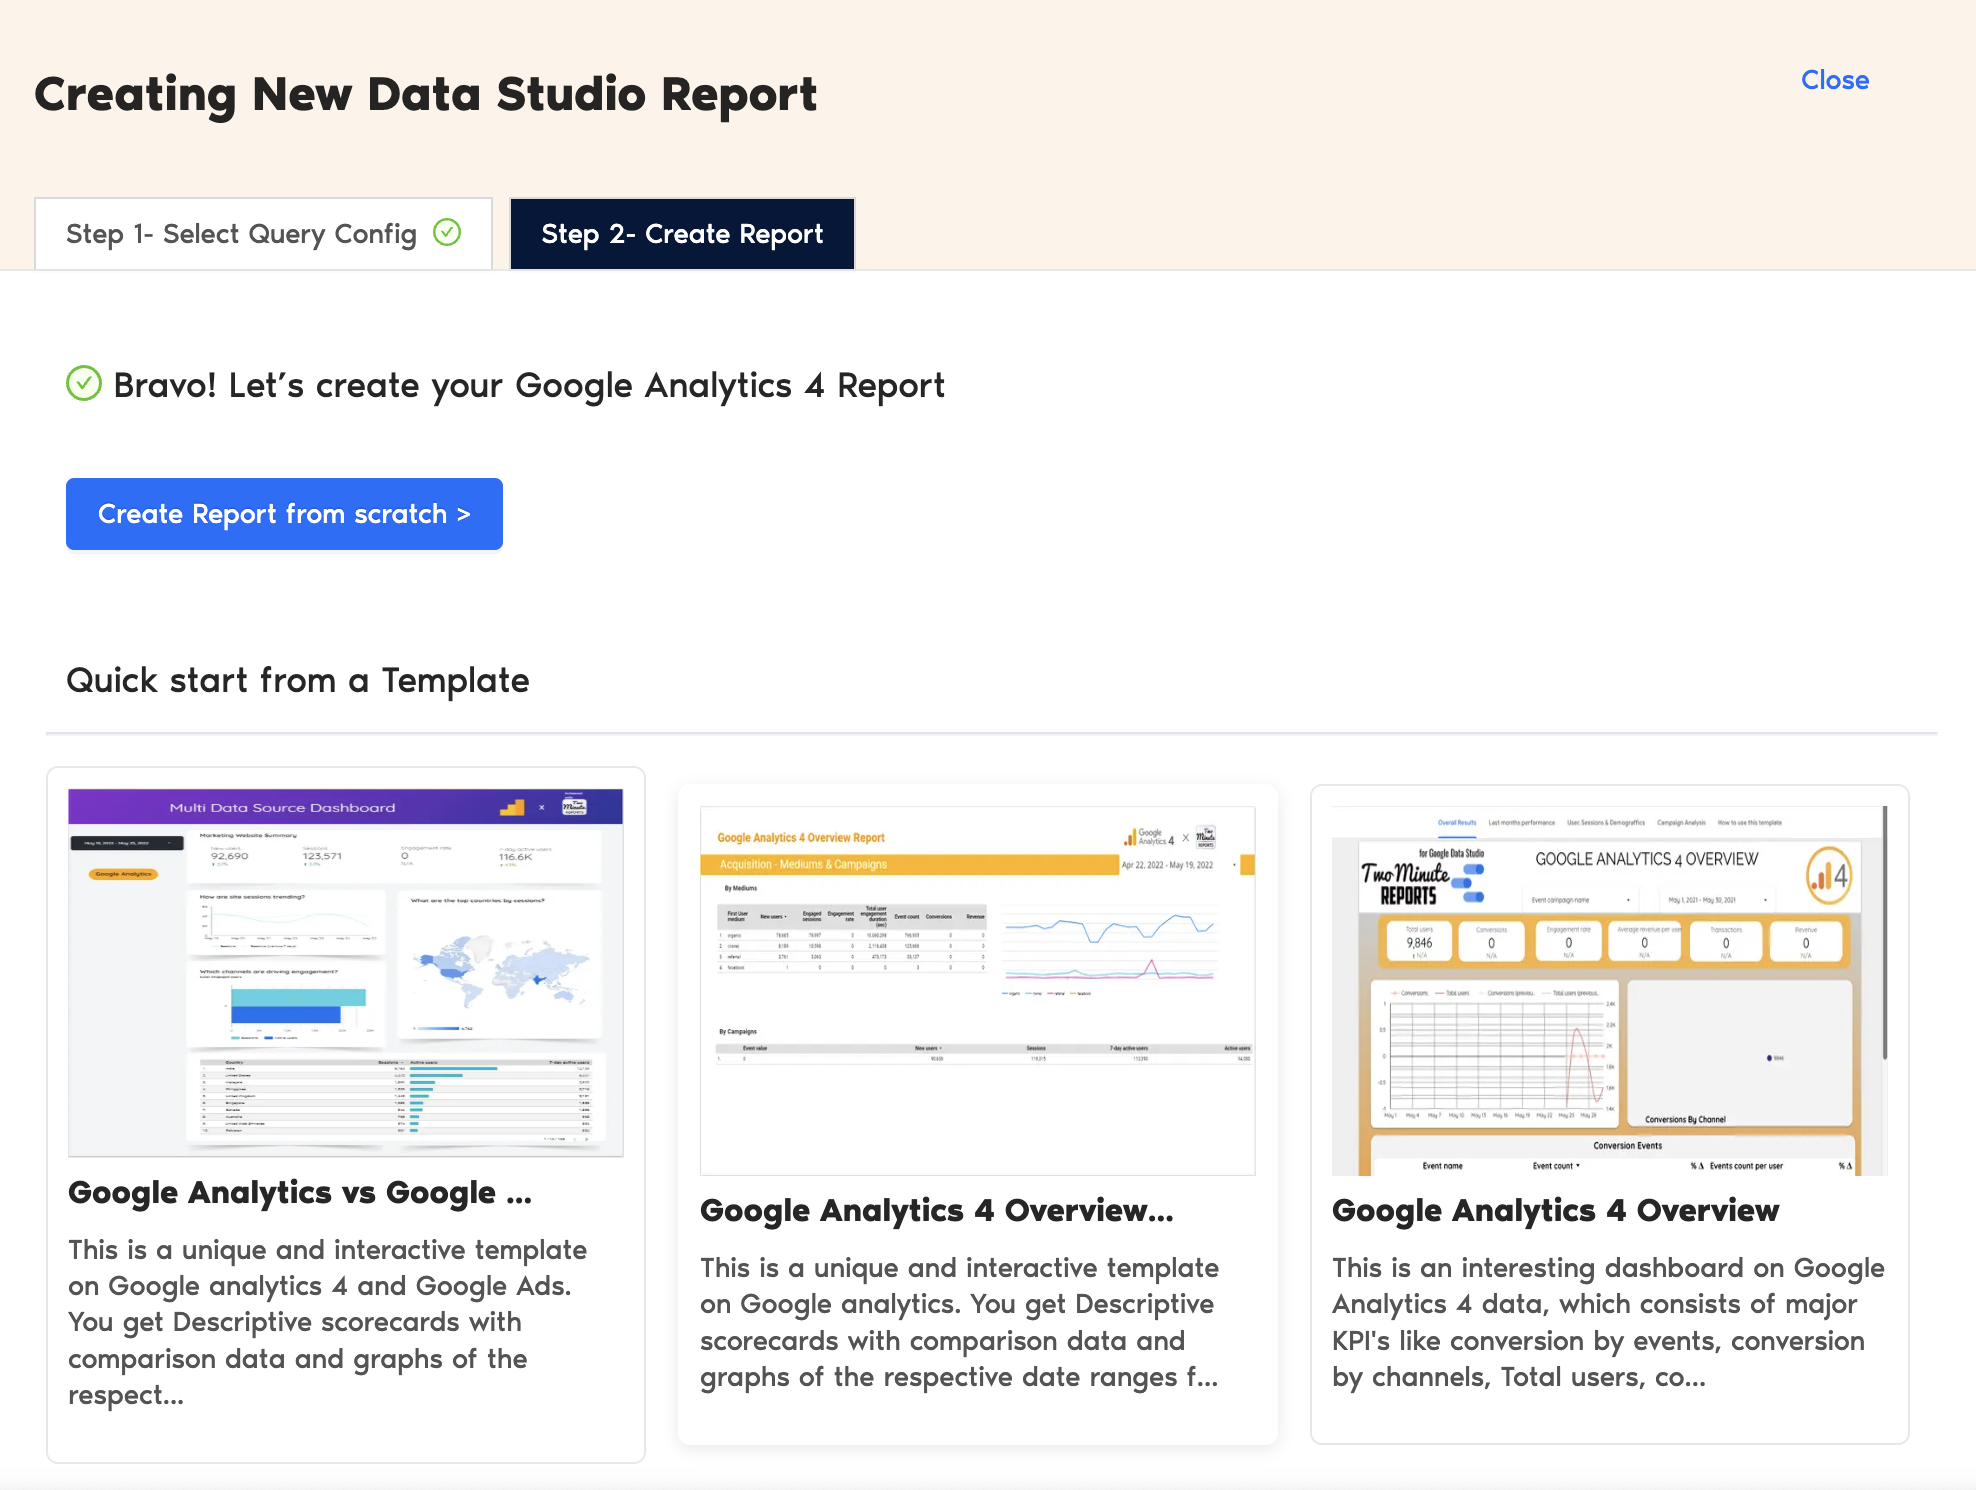
- After creating the Query Config, click Create Report in the top-right corner, as shown below:
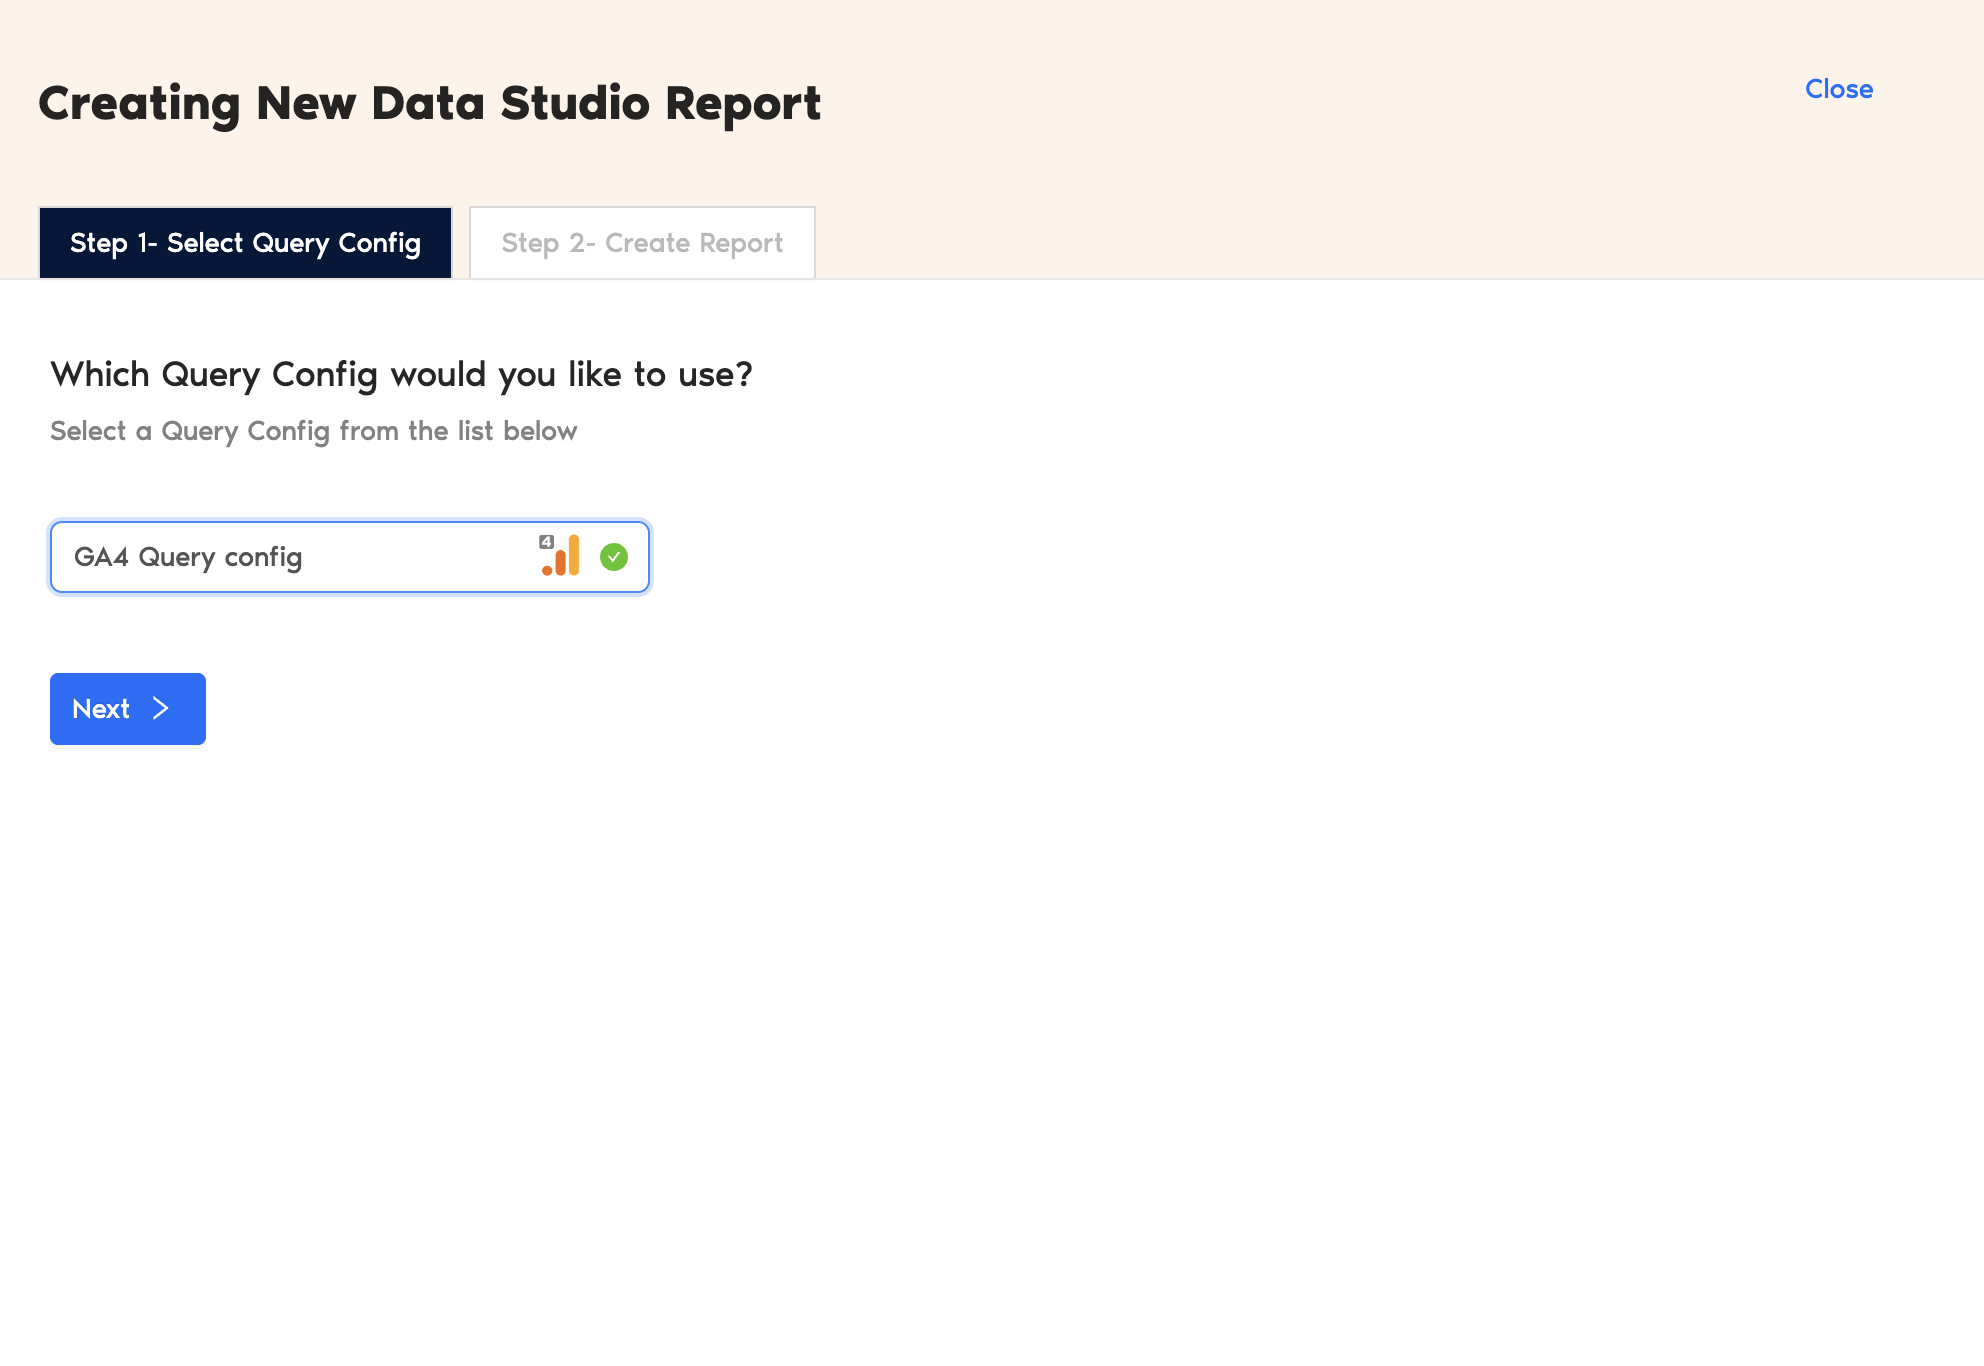
- From the list of options, select the Query Config you just created (in our case, it’s ‘GA4 Query config’) and click Next. Choose ‘Create report from scratch’ to open the Looker Studio dashboard.
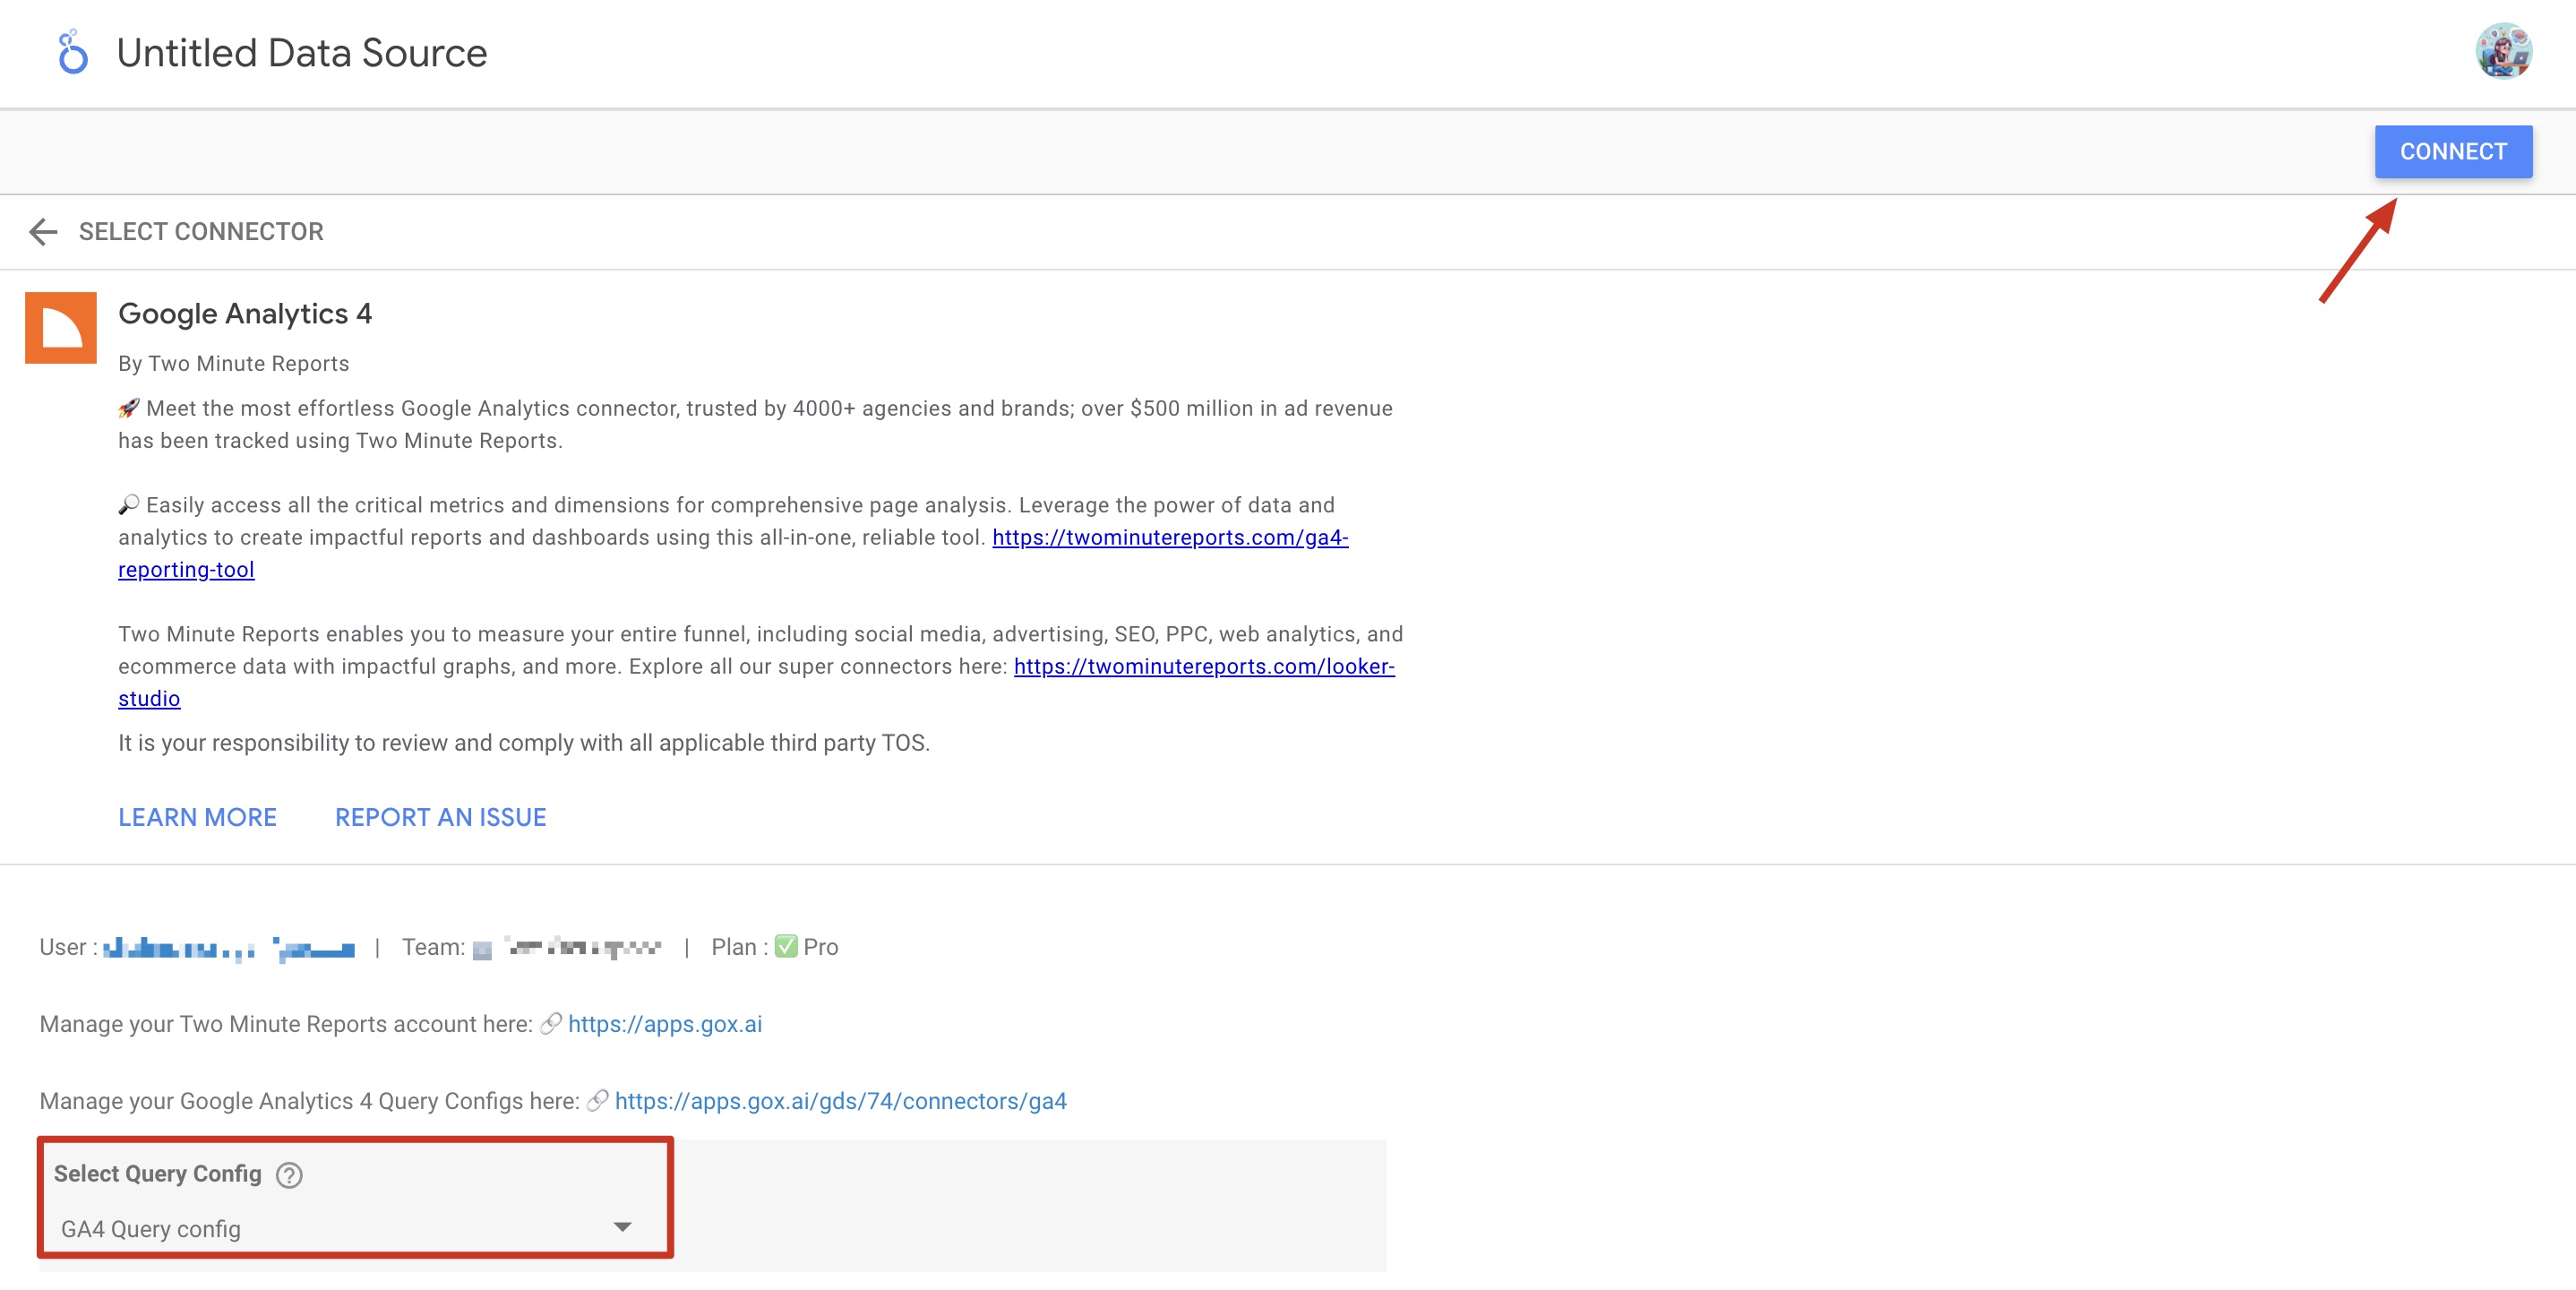
- Once the dashboard opens, select your team and the required Query Config from the dropdown menu. Then, click Connect in the top-right corner.
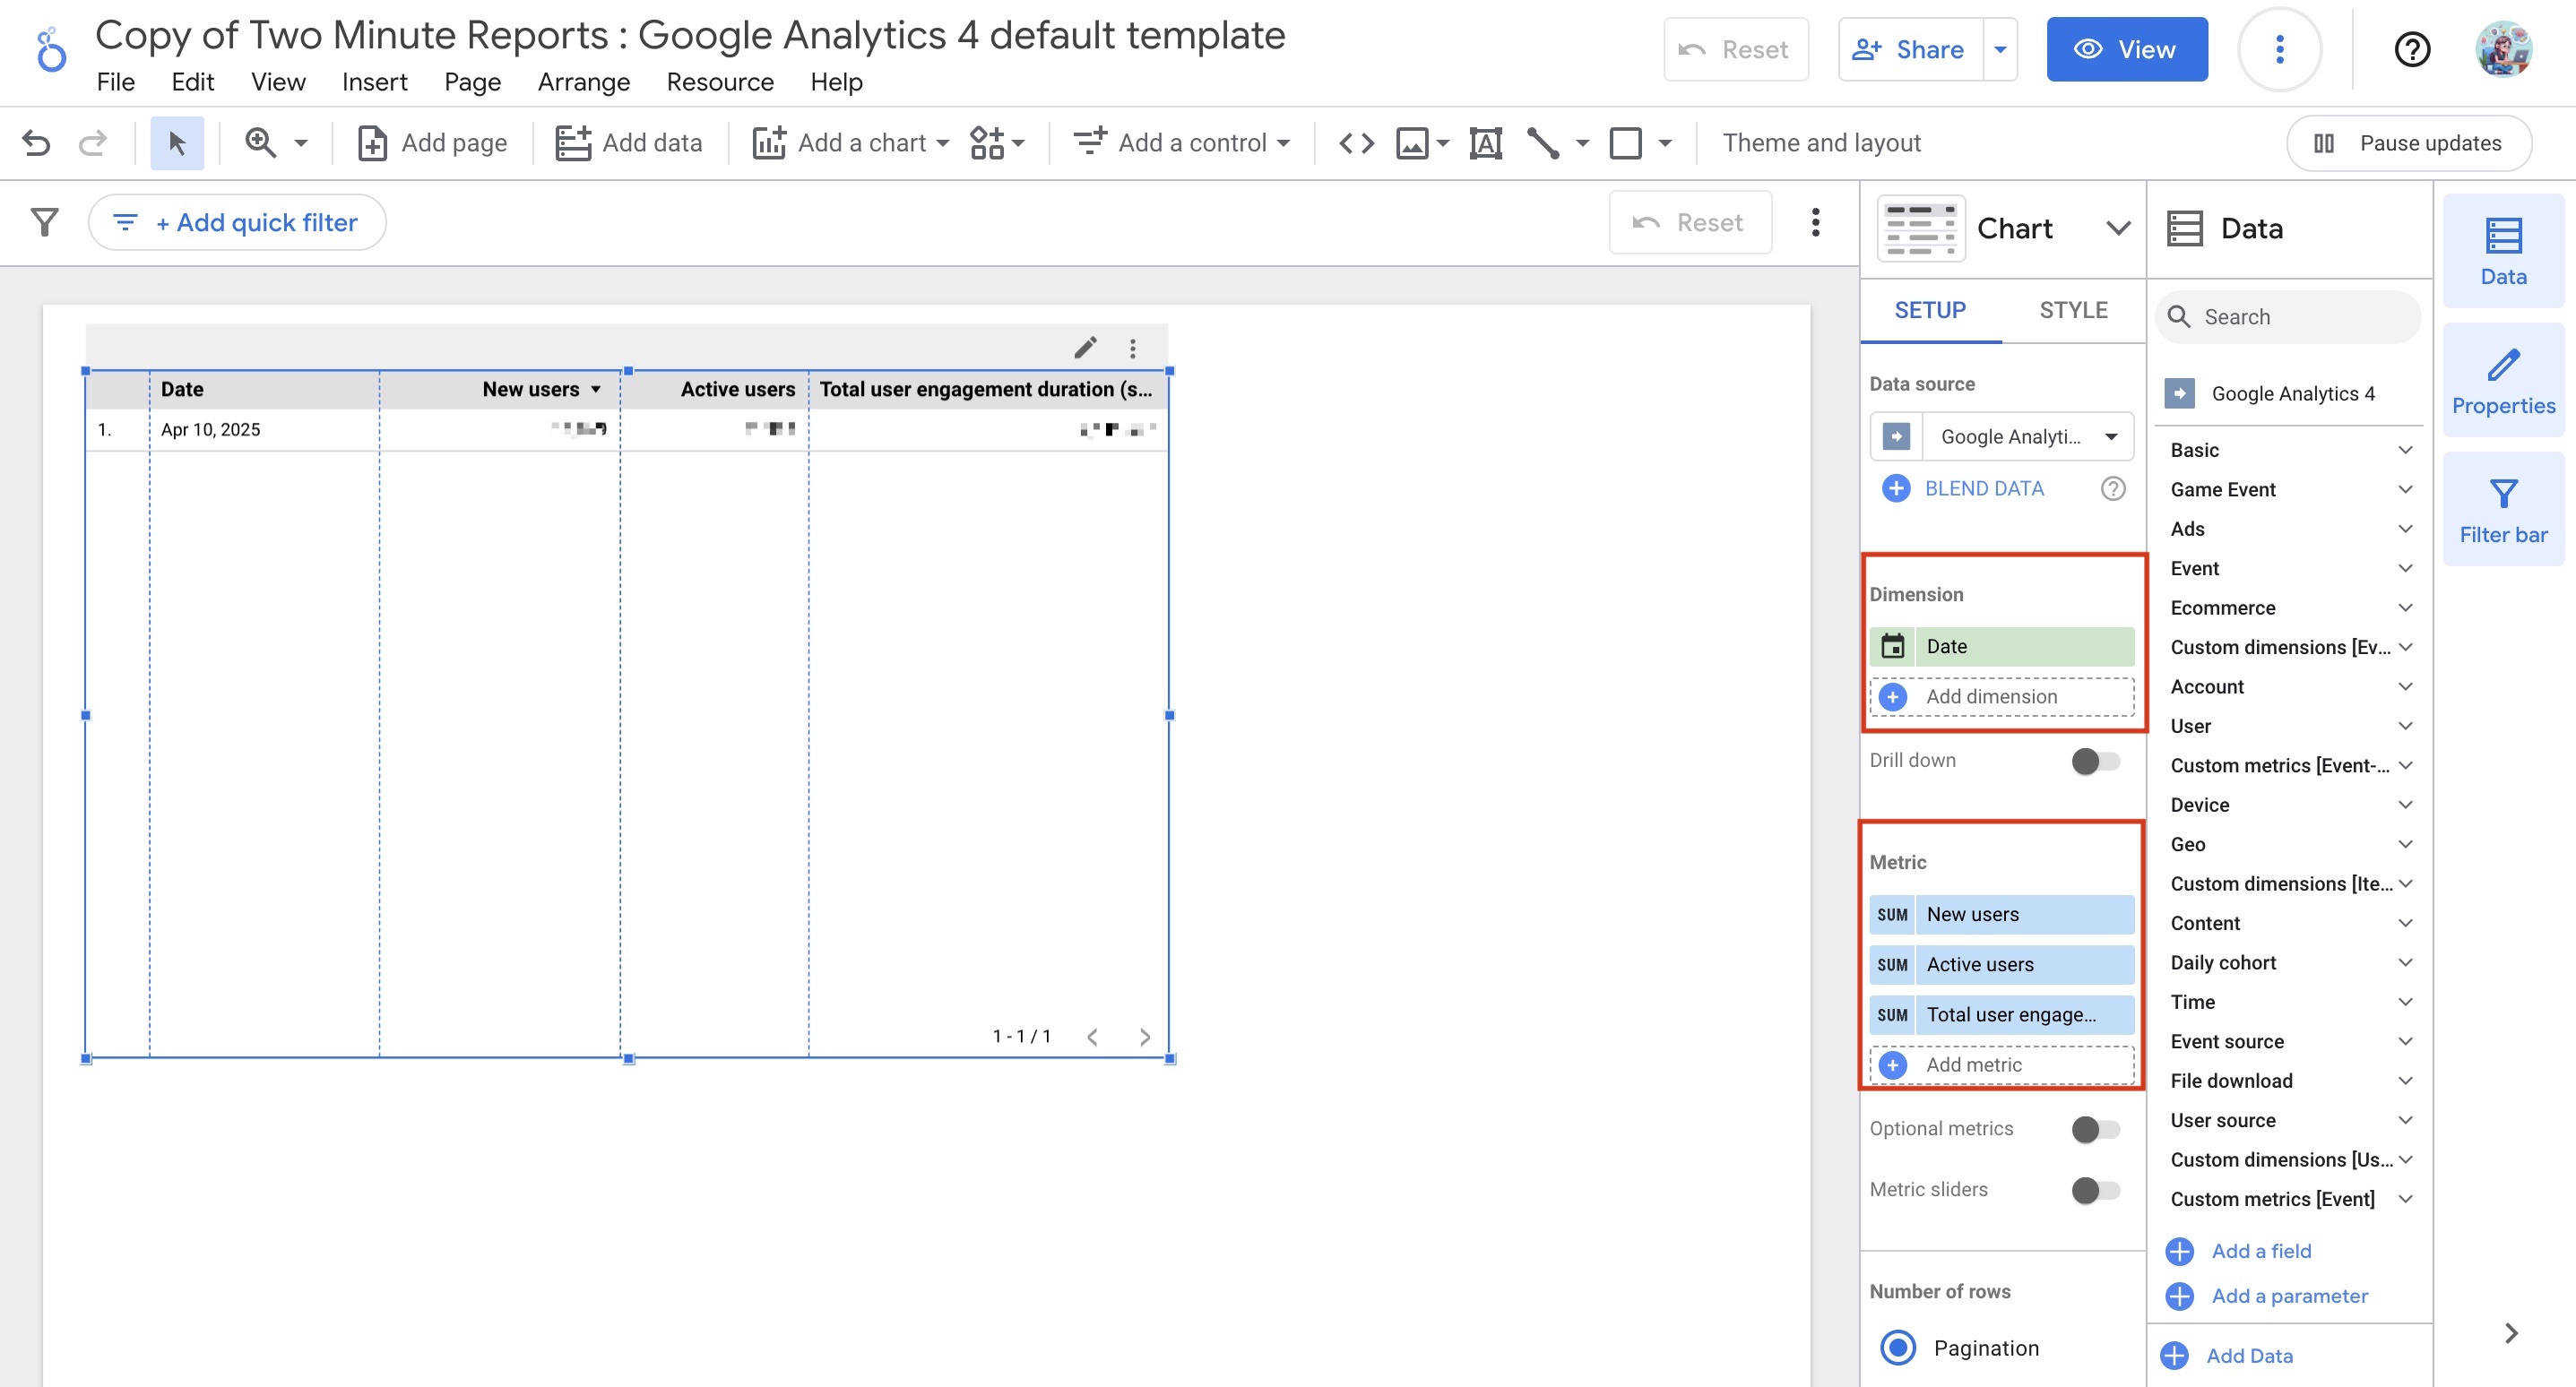
- After clicking Create Report, you’ll be directed to the Looker Studio dashboard, where you can drag and drop key GA4 metrics and dimensions to analyze and track performance insights for your website, app, or campaign more efficiently.
- To enhance your Looker Studio report, use charts and visualizations. Click Add a chart and choose relevant chart types to configure your GA4 dashboard.
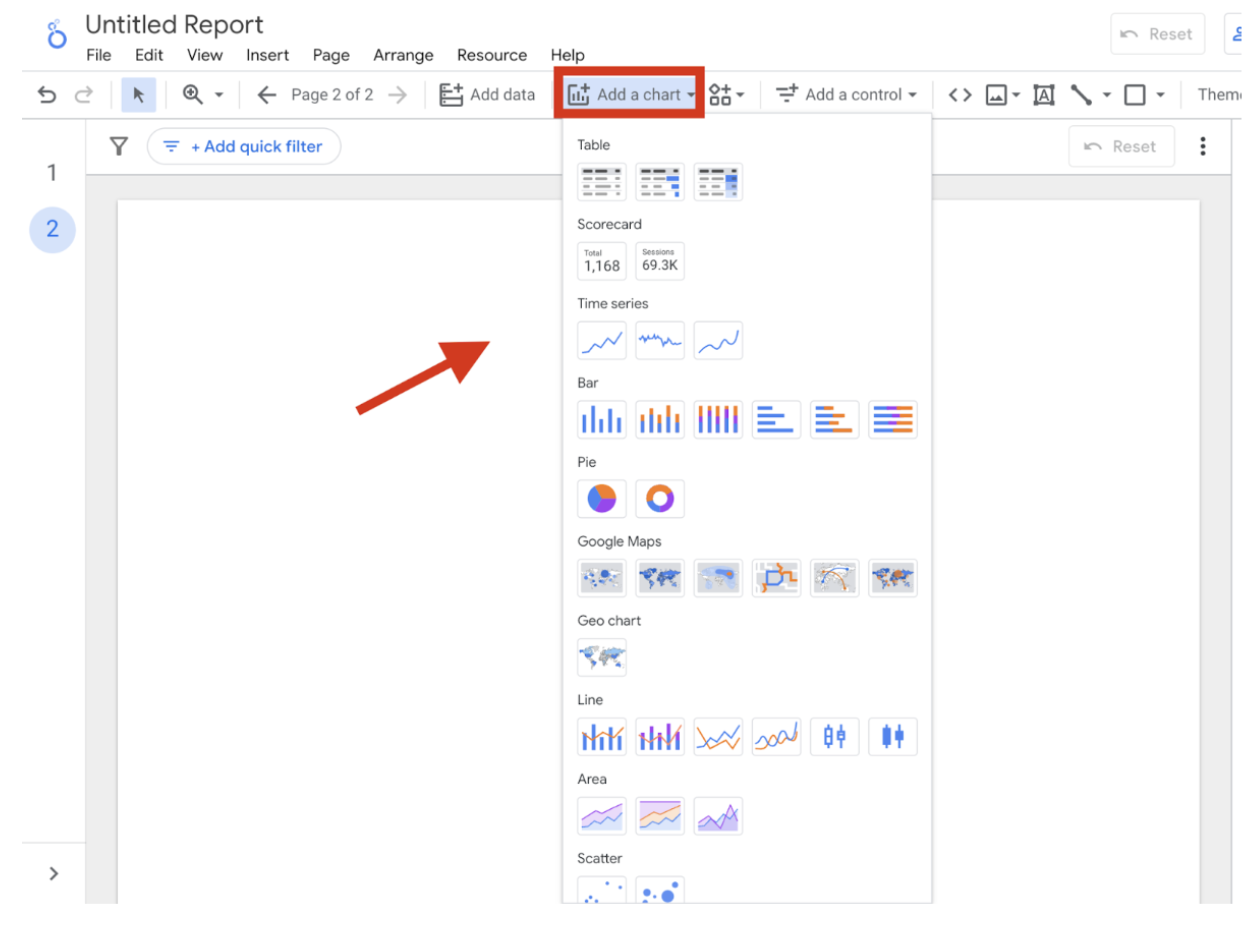
For example, bar charts can effectively showcase performance trends such as user engagement, traffic sources, and session durations. You can also add scorecards highlighting key performance indicators (KPIs) like active users, conversion rates, and average engagement rates.
Note: Too many charts and visualizations may slow down your Looker Studio dashboard. Try following our five tips to increase the speed of your Looker Studio reports for better performance.
We hope you found this article helpful. If you have any questions, please contact our support team via [email protected].