Summarize this blog post with:
GoHighLevel can tell you almost everything about your leads, opportunities, and campaigns. The tricky part is getting all of that information into a report that someone can understand at a glance.
If you’re already using Google Data Studio for reporting, connecting it with GoHighLevel can give you a much clearer picture of the data. You can bring your key metrics into one dashboard, customize the dashboard according to your needs, and make reports easier to share with clients or your team.
In this guide, I’ll show you how to connect GoHighLevel to Data Studio using Two Minute Reports step by step and build your CRM dashboard within minutes.
How to Connect GoHighLevel to Google Data Studio?
You can connect GoHighLevel to Data Studio through the Two Minute Reports Hub. It is your centralized workspace for adding, managing, and organizing your GoHighLevel accounts. Here’s how to get started:
Step 1: Create a Connection
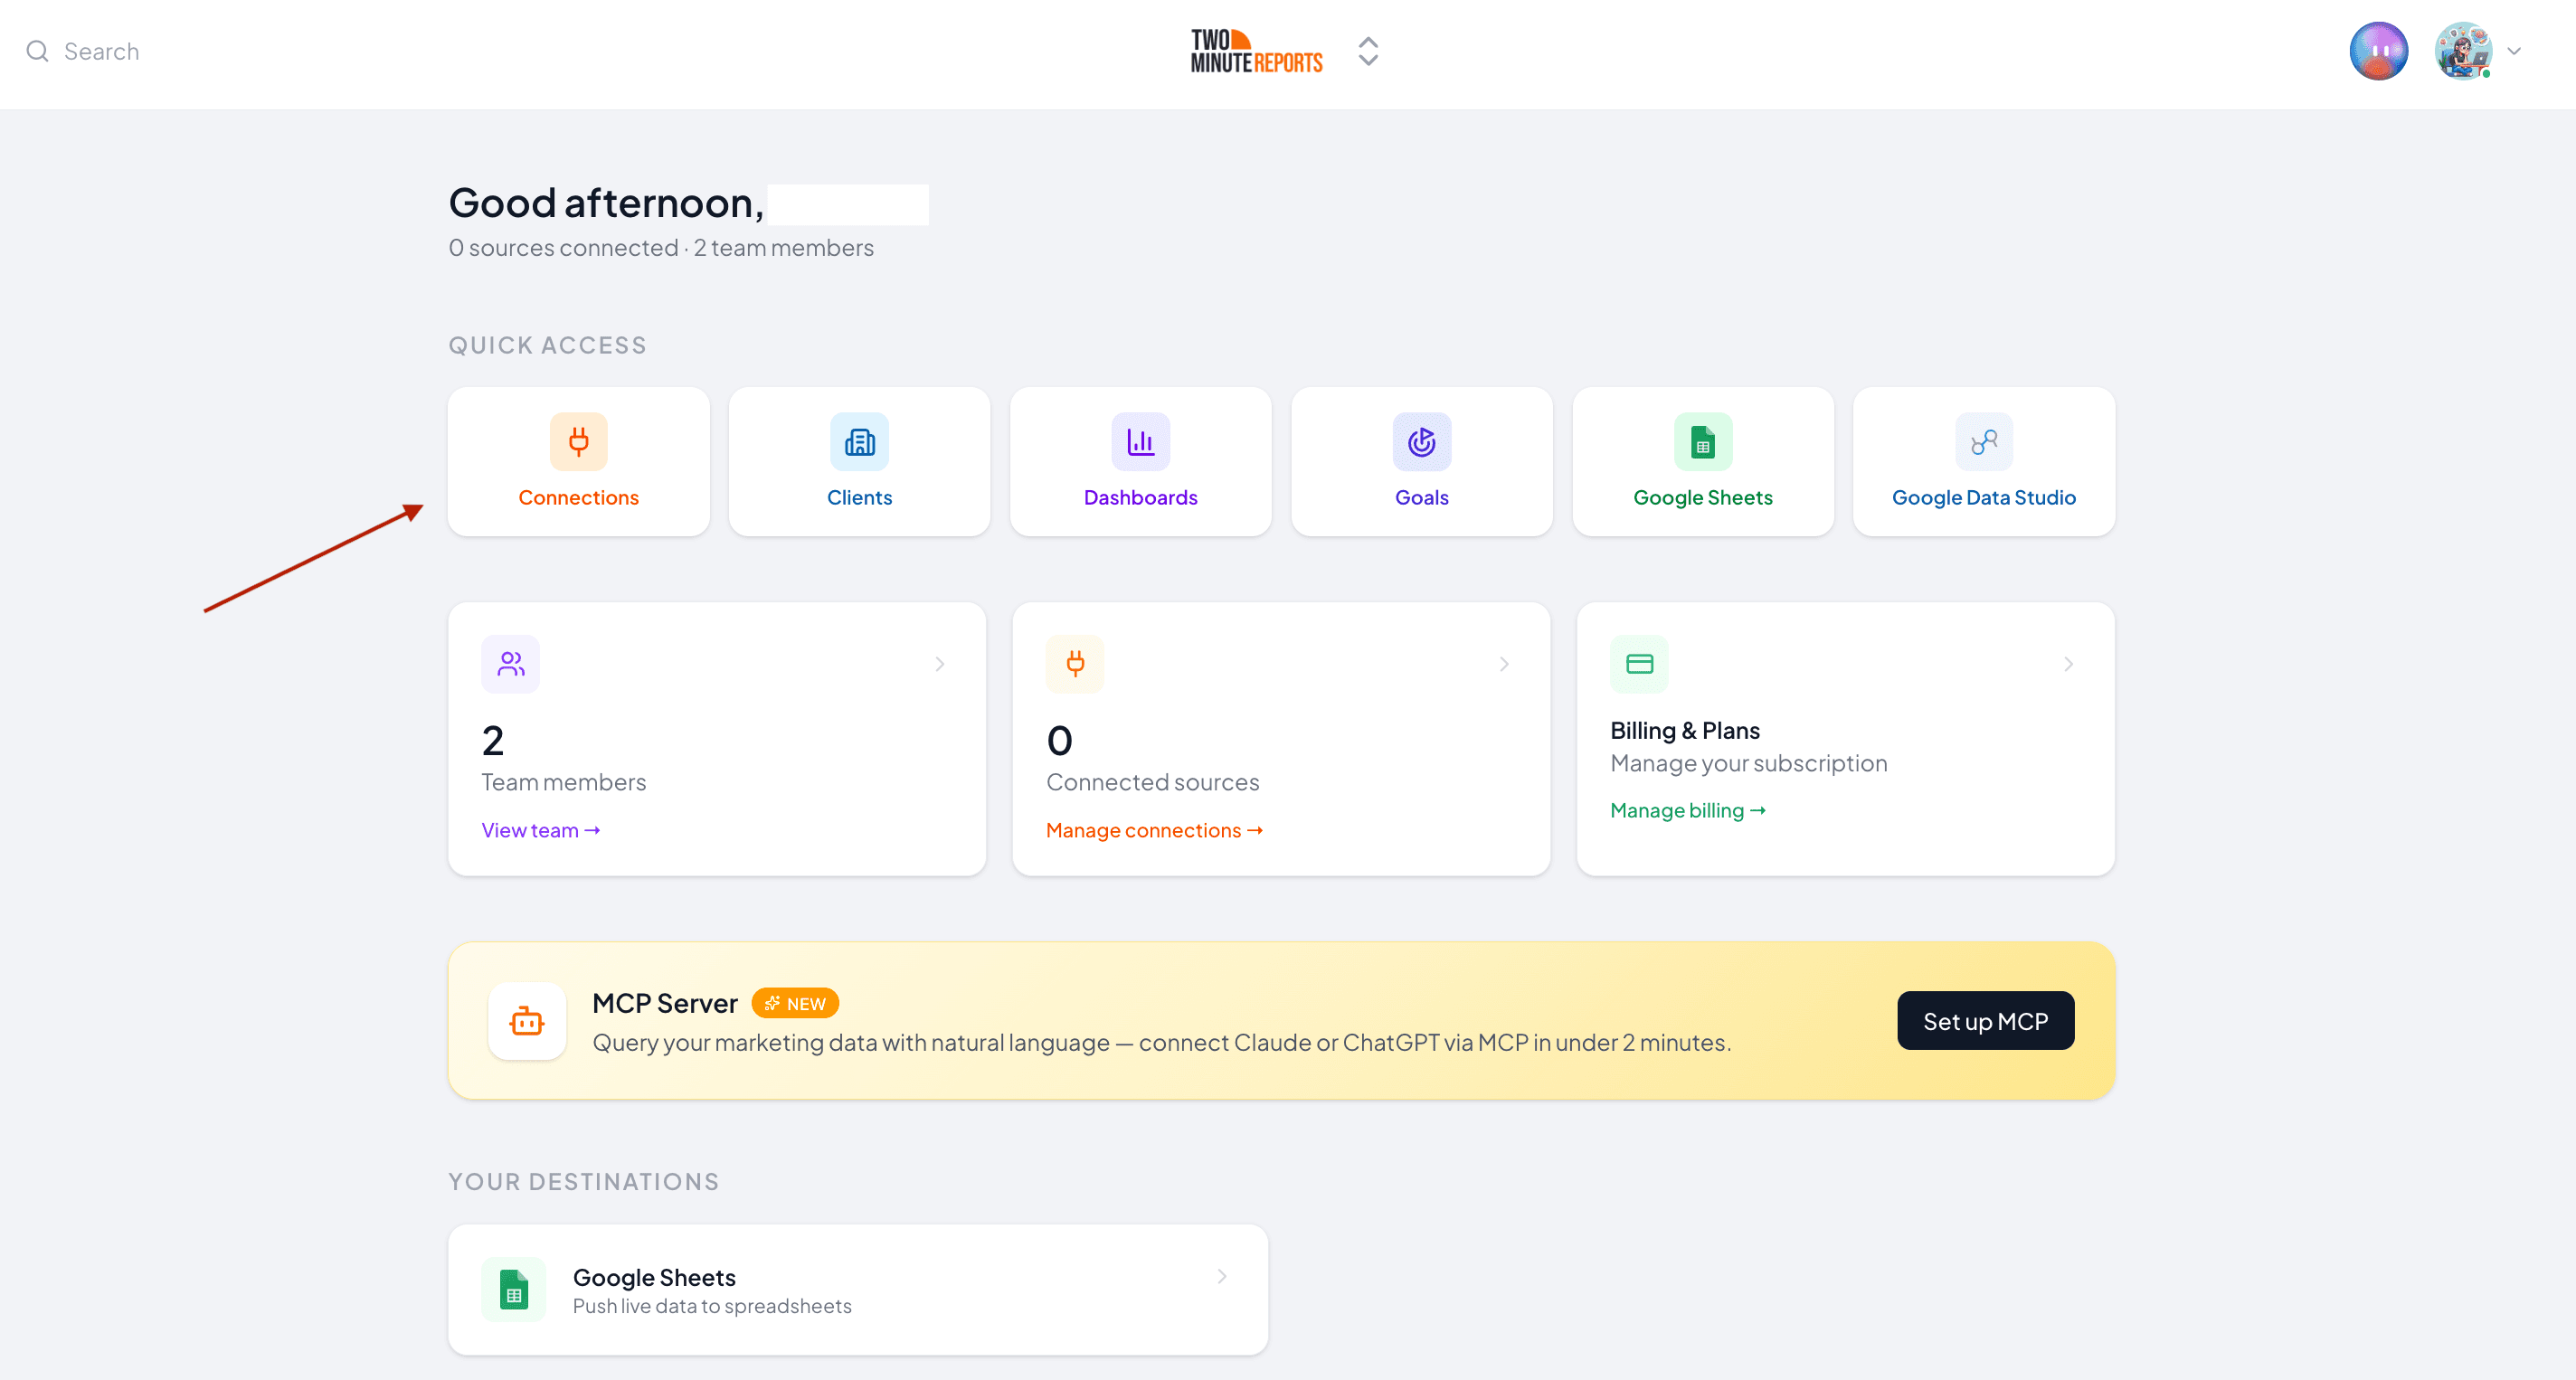
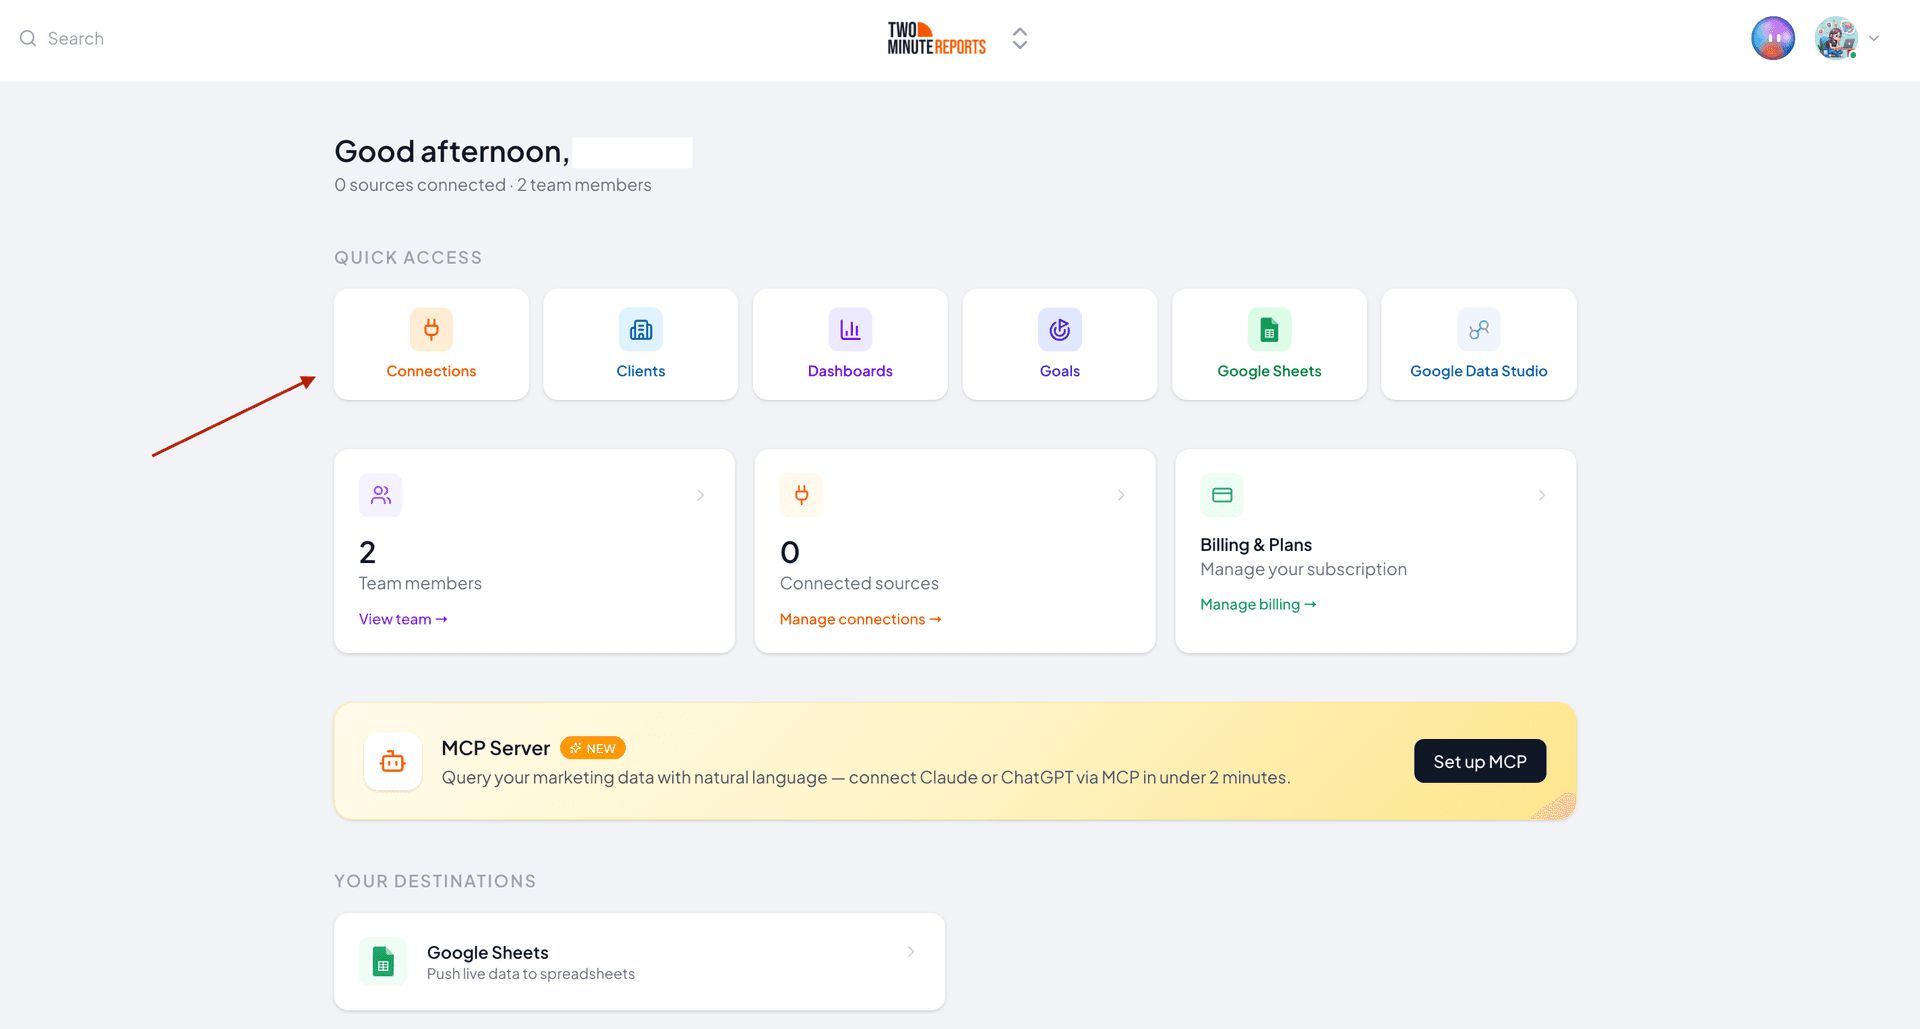
1. Go to hub.twominutereports.com and click Connections → Create Connection
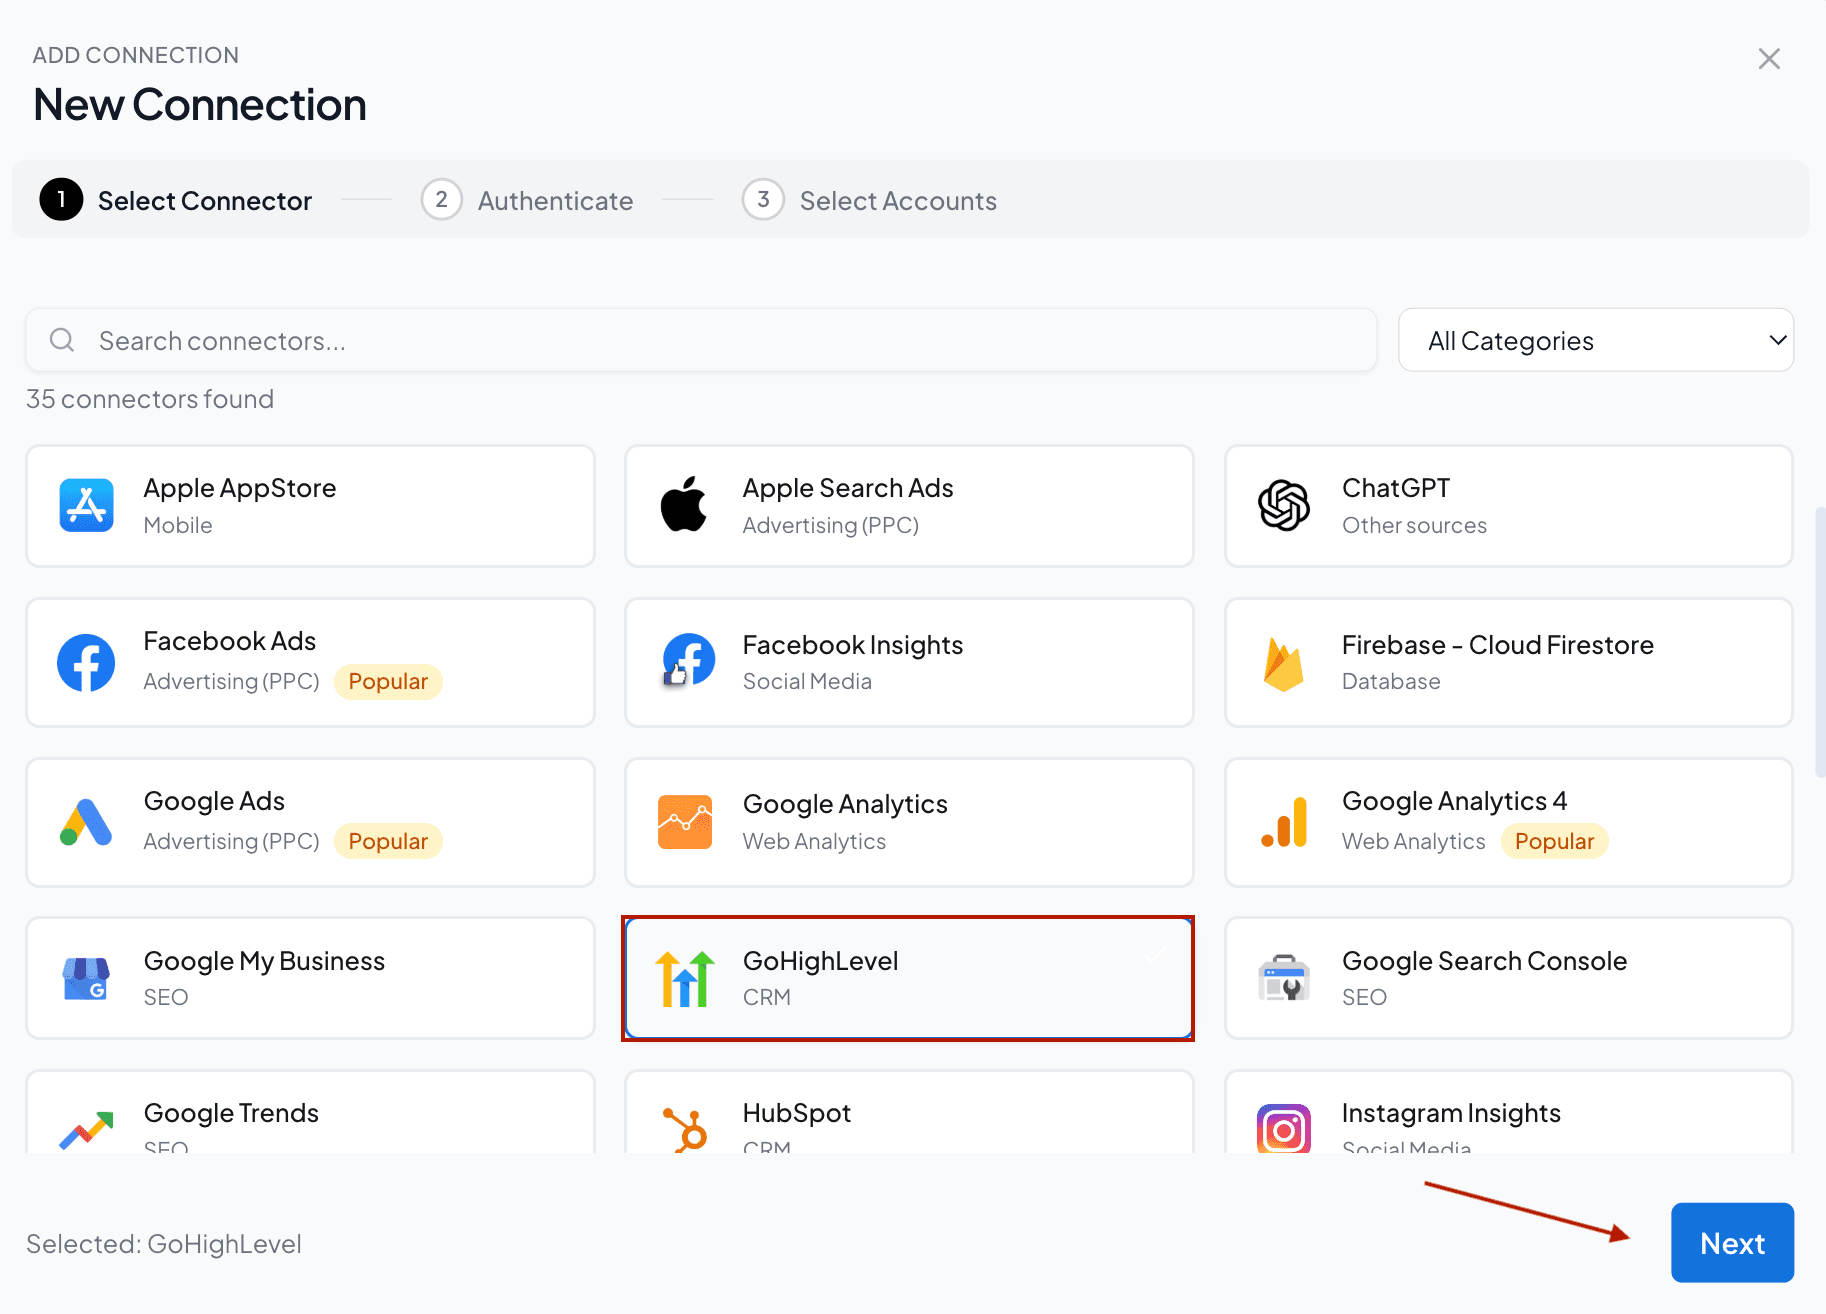
2. Inside the dialog box, complete these three steps:
- Select GoHighLevel from the list of options.
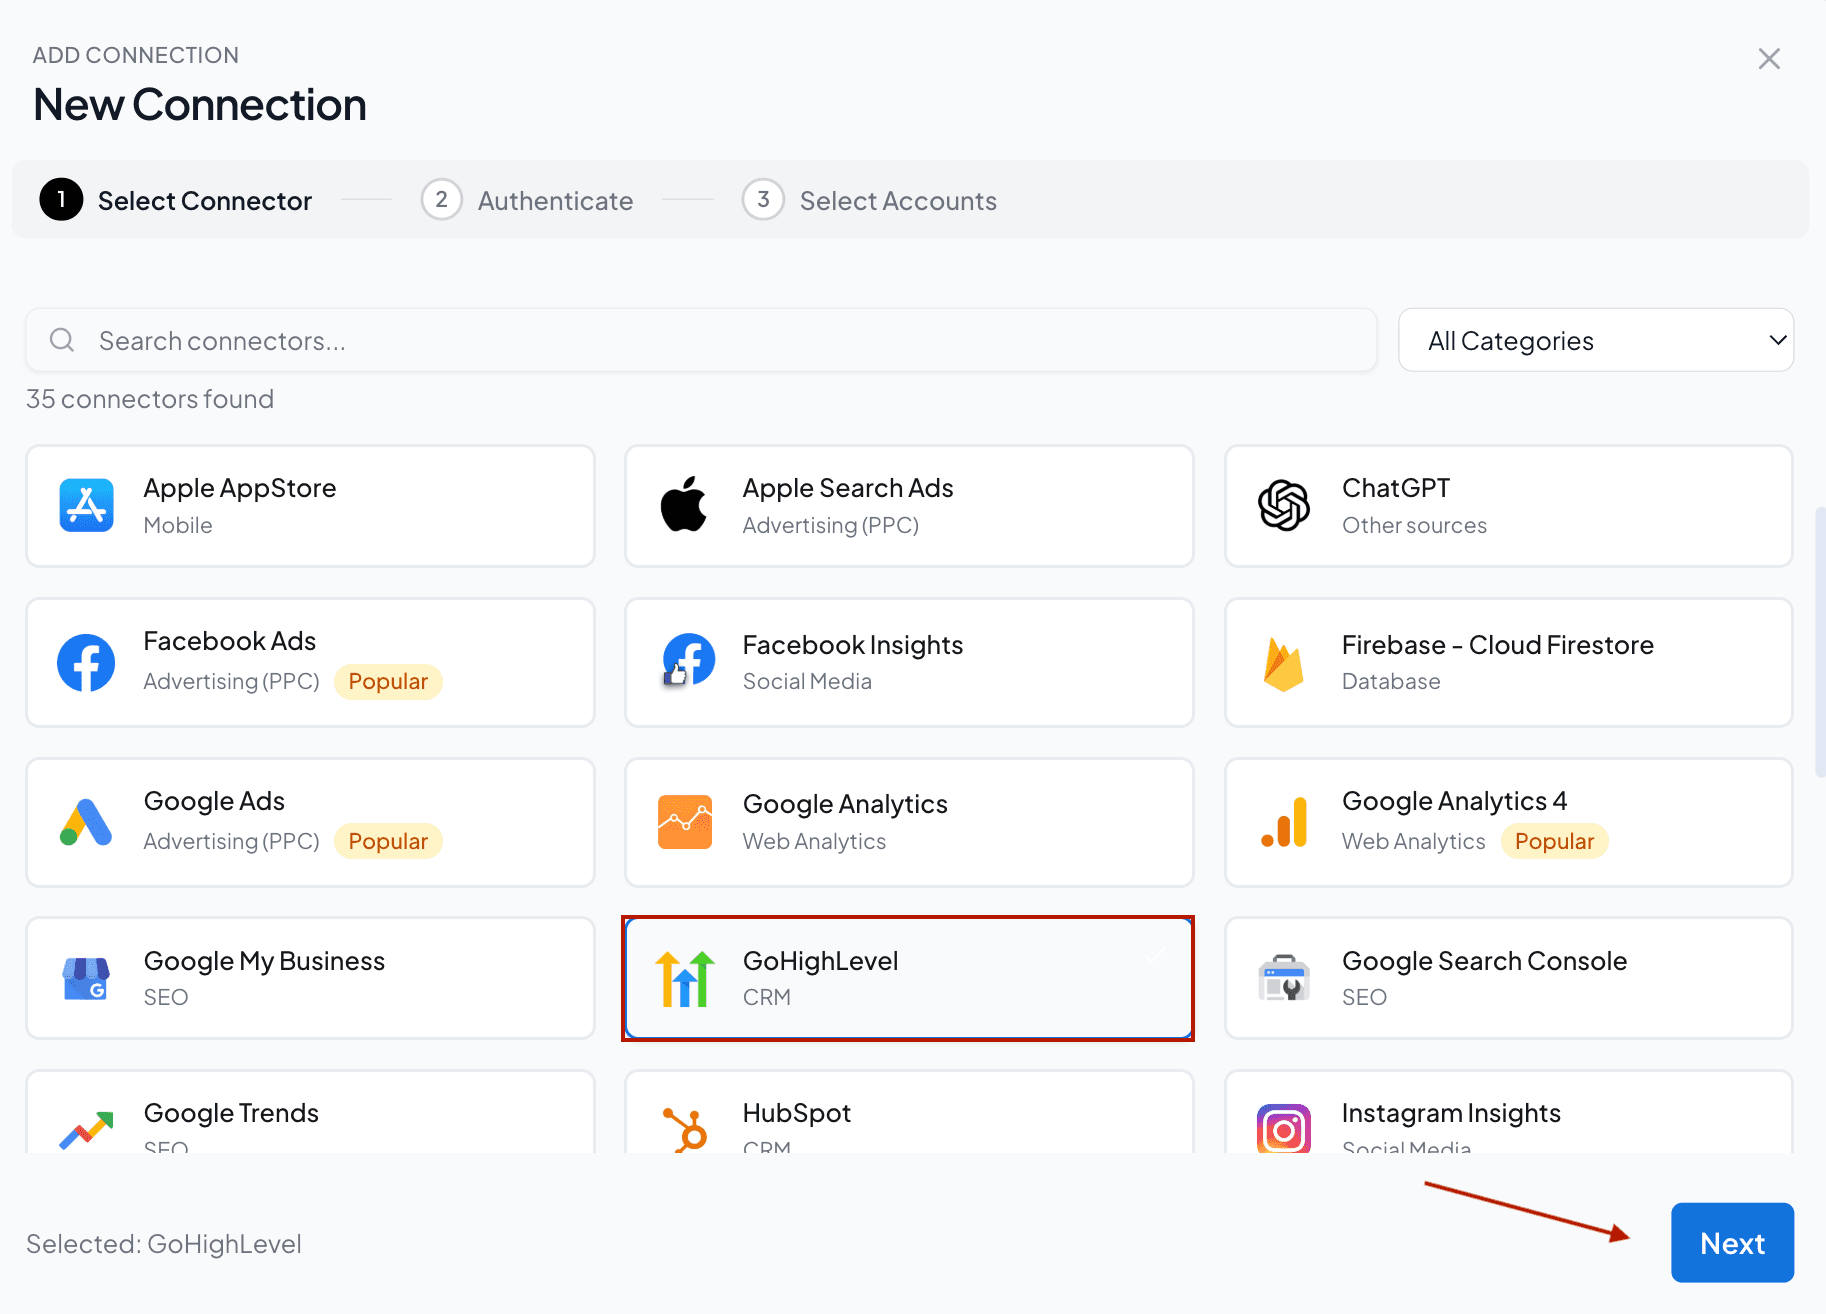
- Enter the name of your connection, and choose the connection type. Select the Private Integration token and paste the token. Paste the location ID (sub-account ID) as well. For more information, please refer to our GoHighLevel documentation.
- Once done, enable the GoHighLevel accounts you want to analyze performance. Please note that you can’t query disabled accounts.
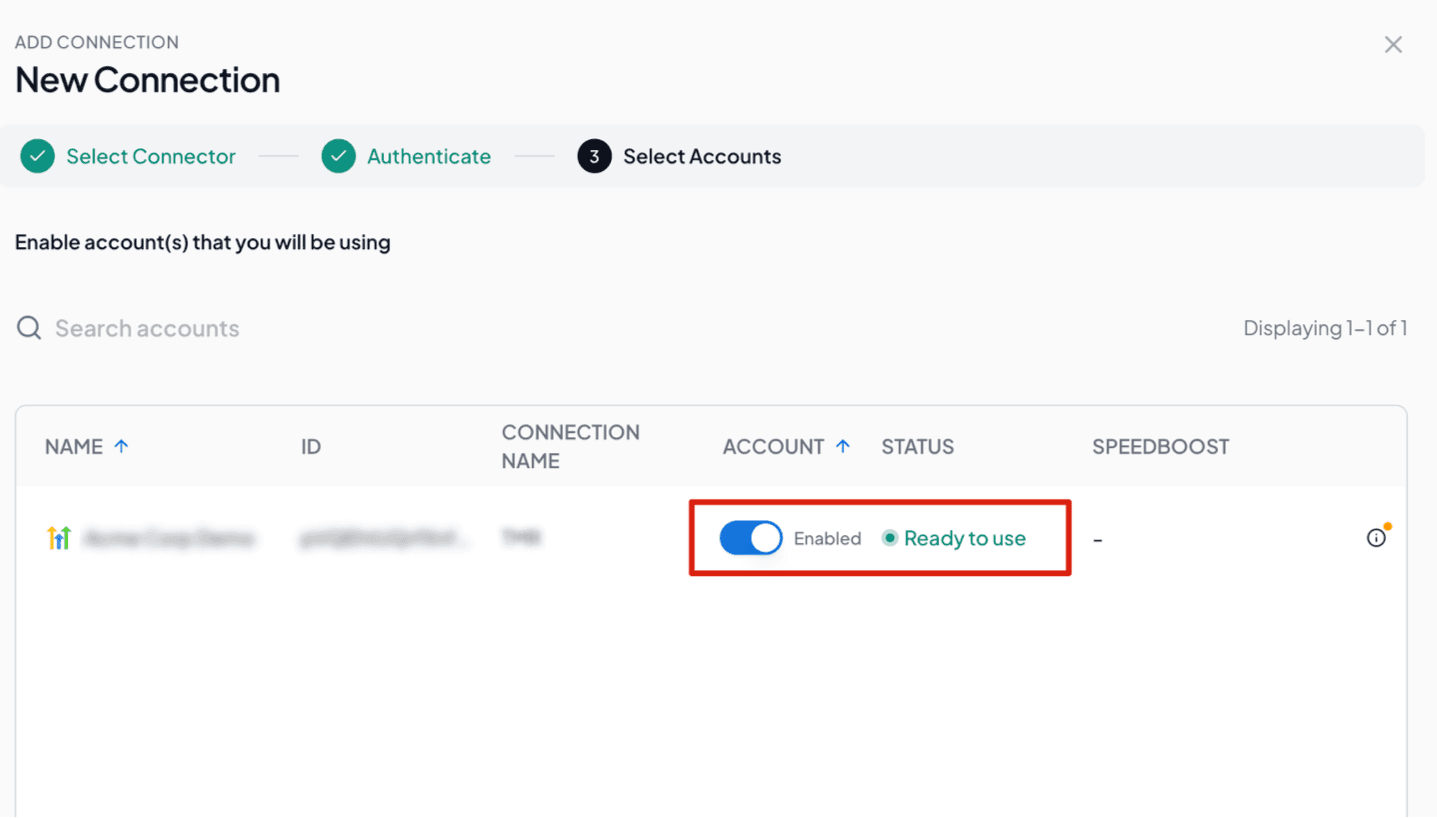
Note: With Speedboost, you can handle large volumes of GoHighLevel datasets and create blazing-fast Looker Studio dashboards without any delay. This is an exclusive technology built by Two Minute Reports to enable scalable client reporting.
3. Once done, go back to the Hub Homepage, click Google Data Studio and proceed with the steps below to build your GoHighLevel dashboard in Data Studio.
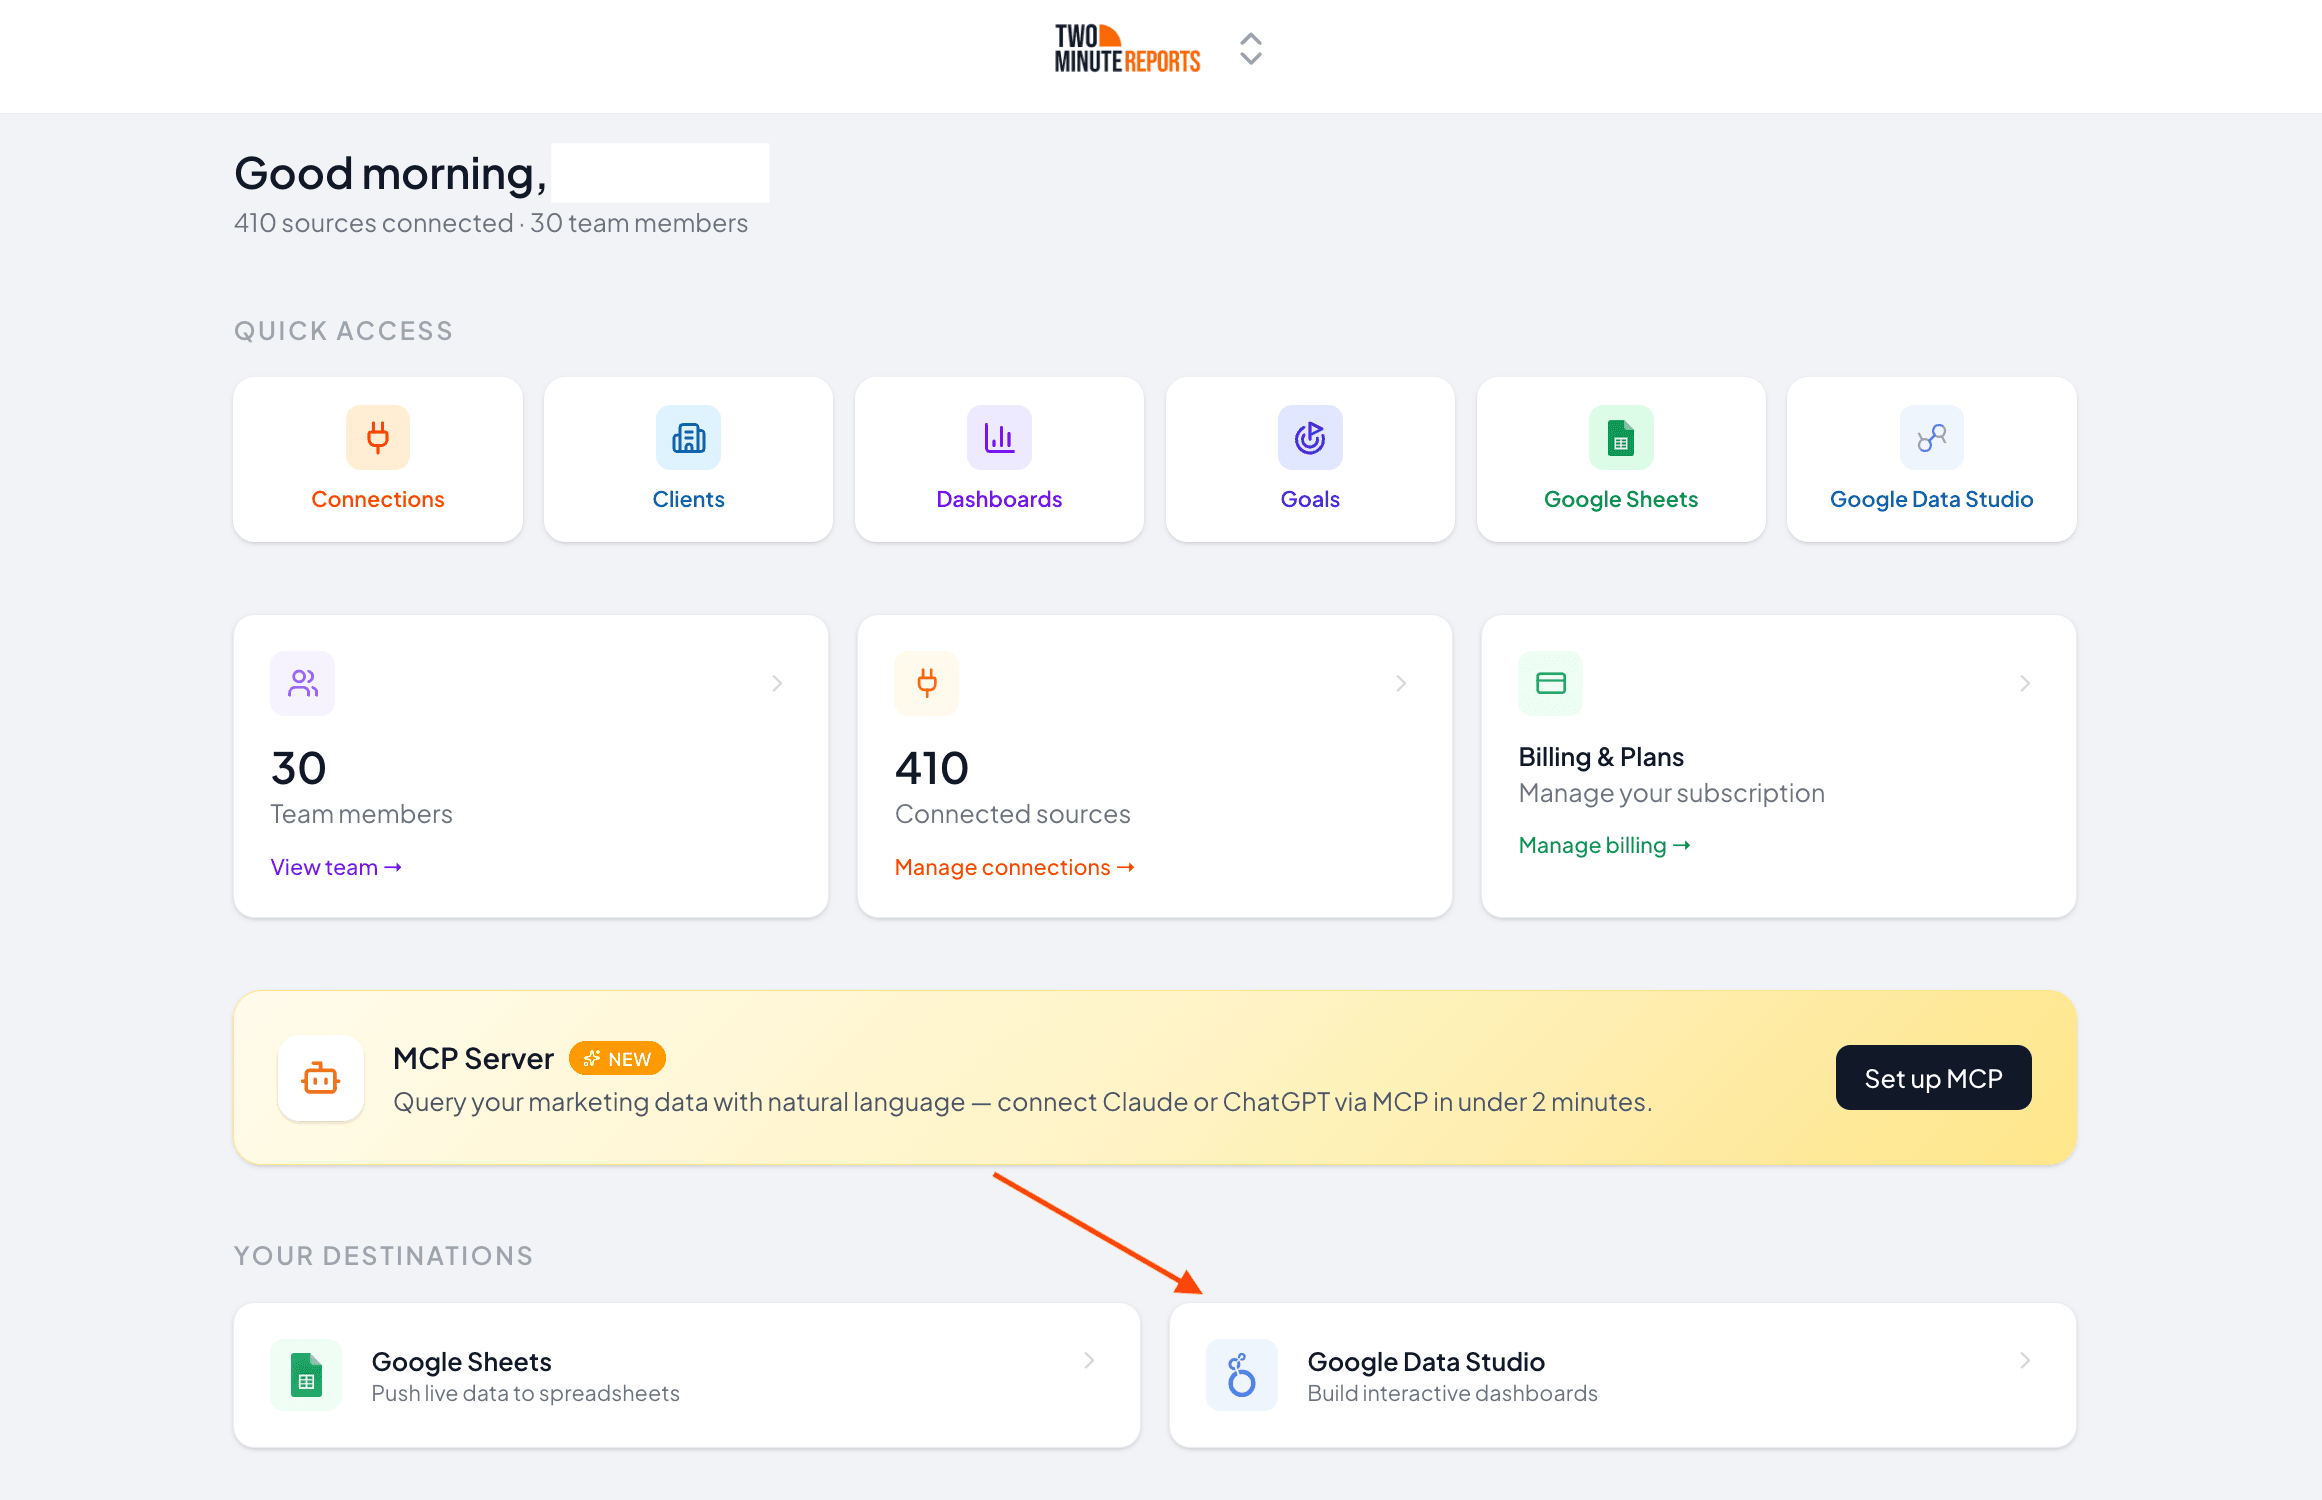
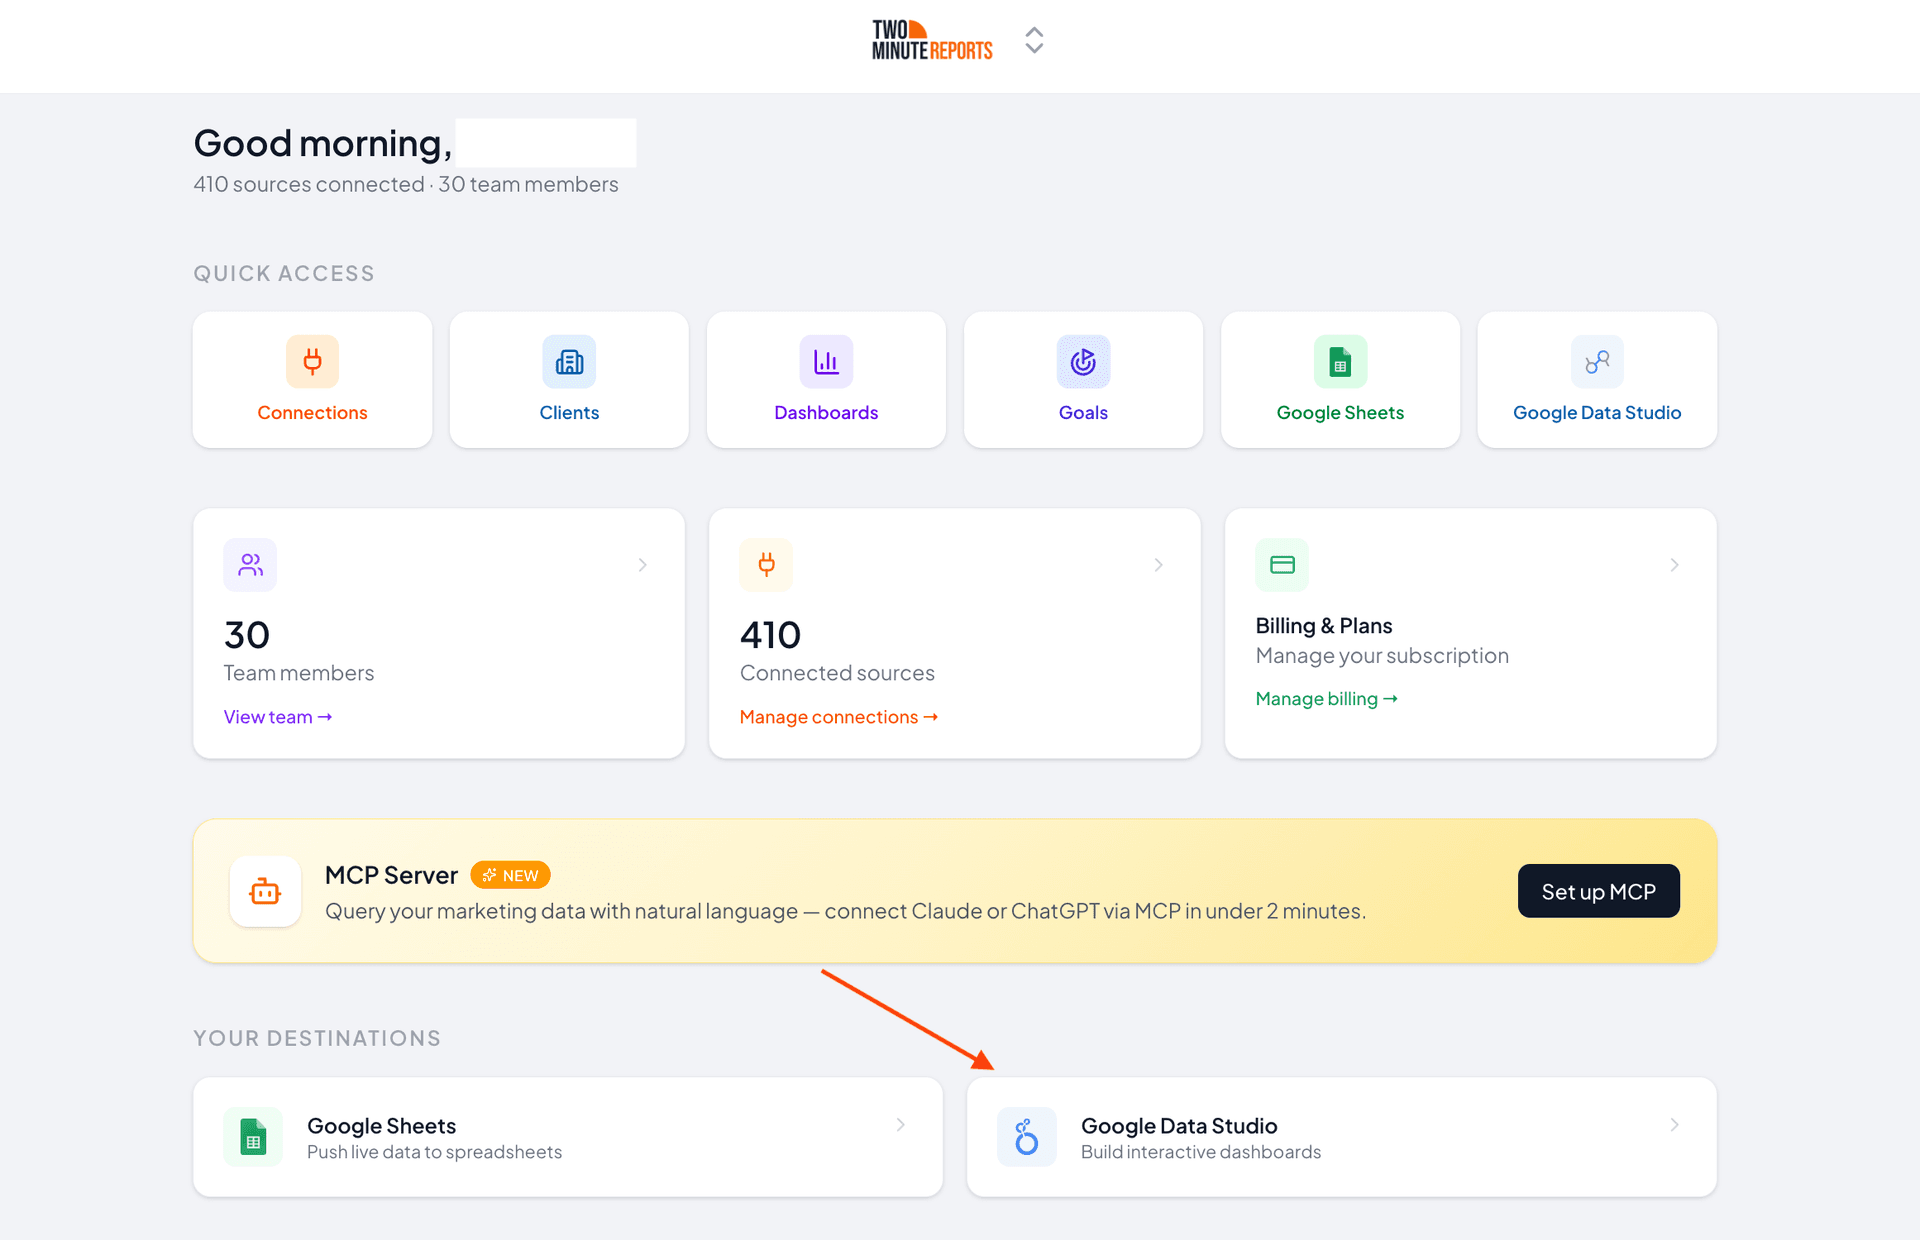
Step 2: Configure Your GoHighLevel Data in Data Studio
- Once you’re in the Google Data Studio menu, click Create Report.
- Select the GoHighLevel Data Studio connector from the list.
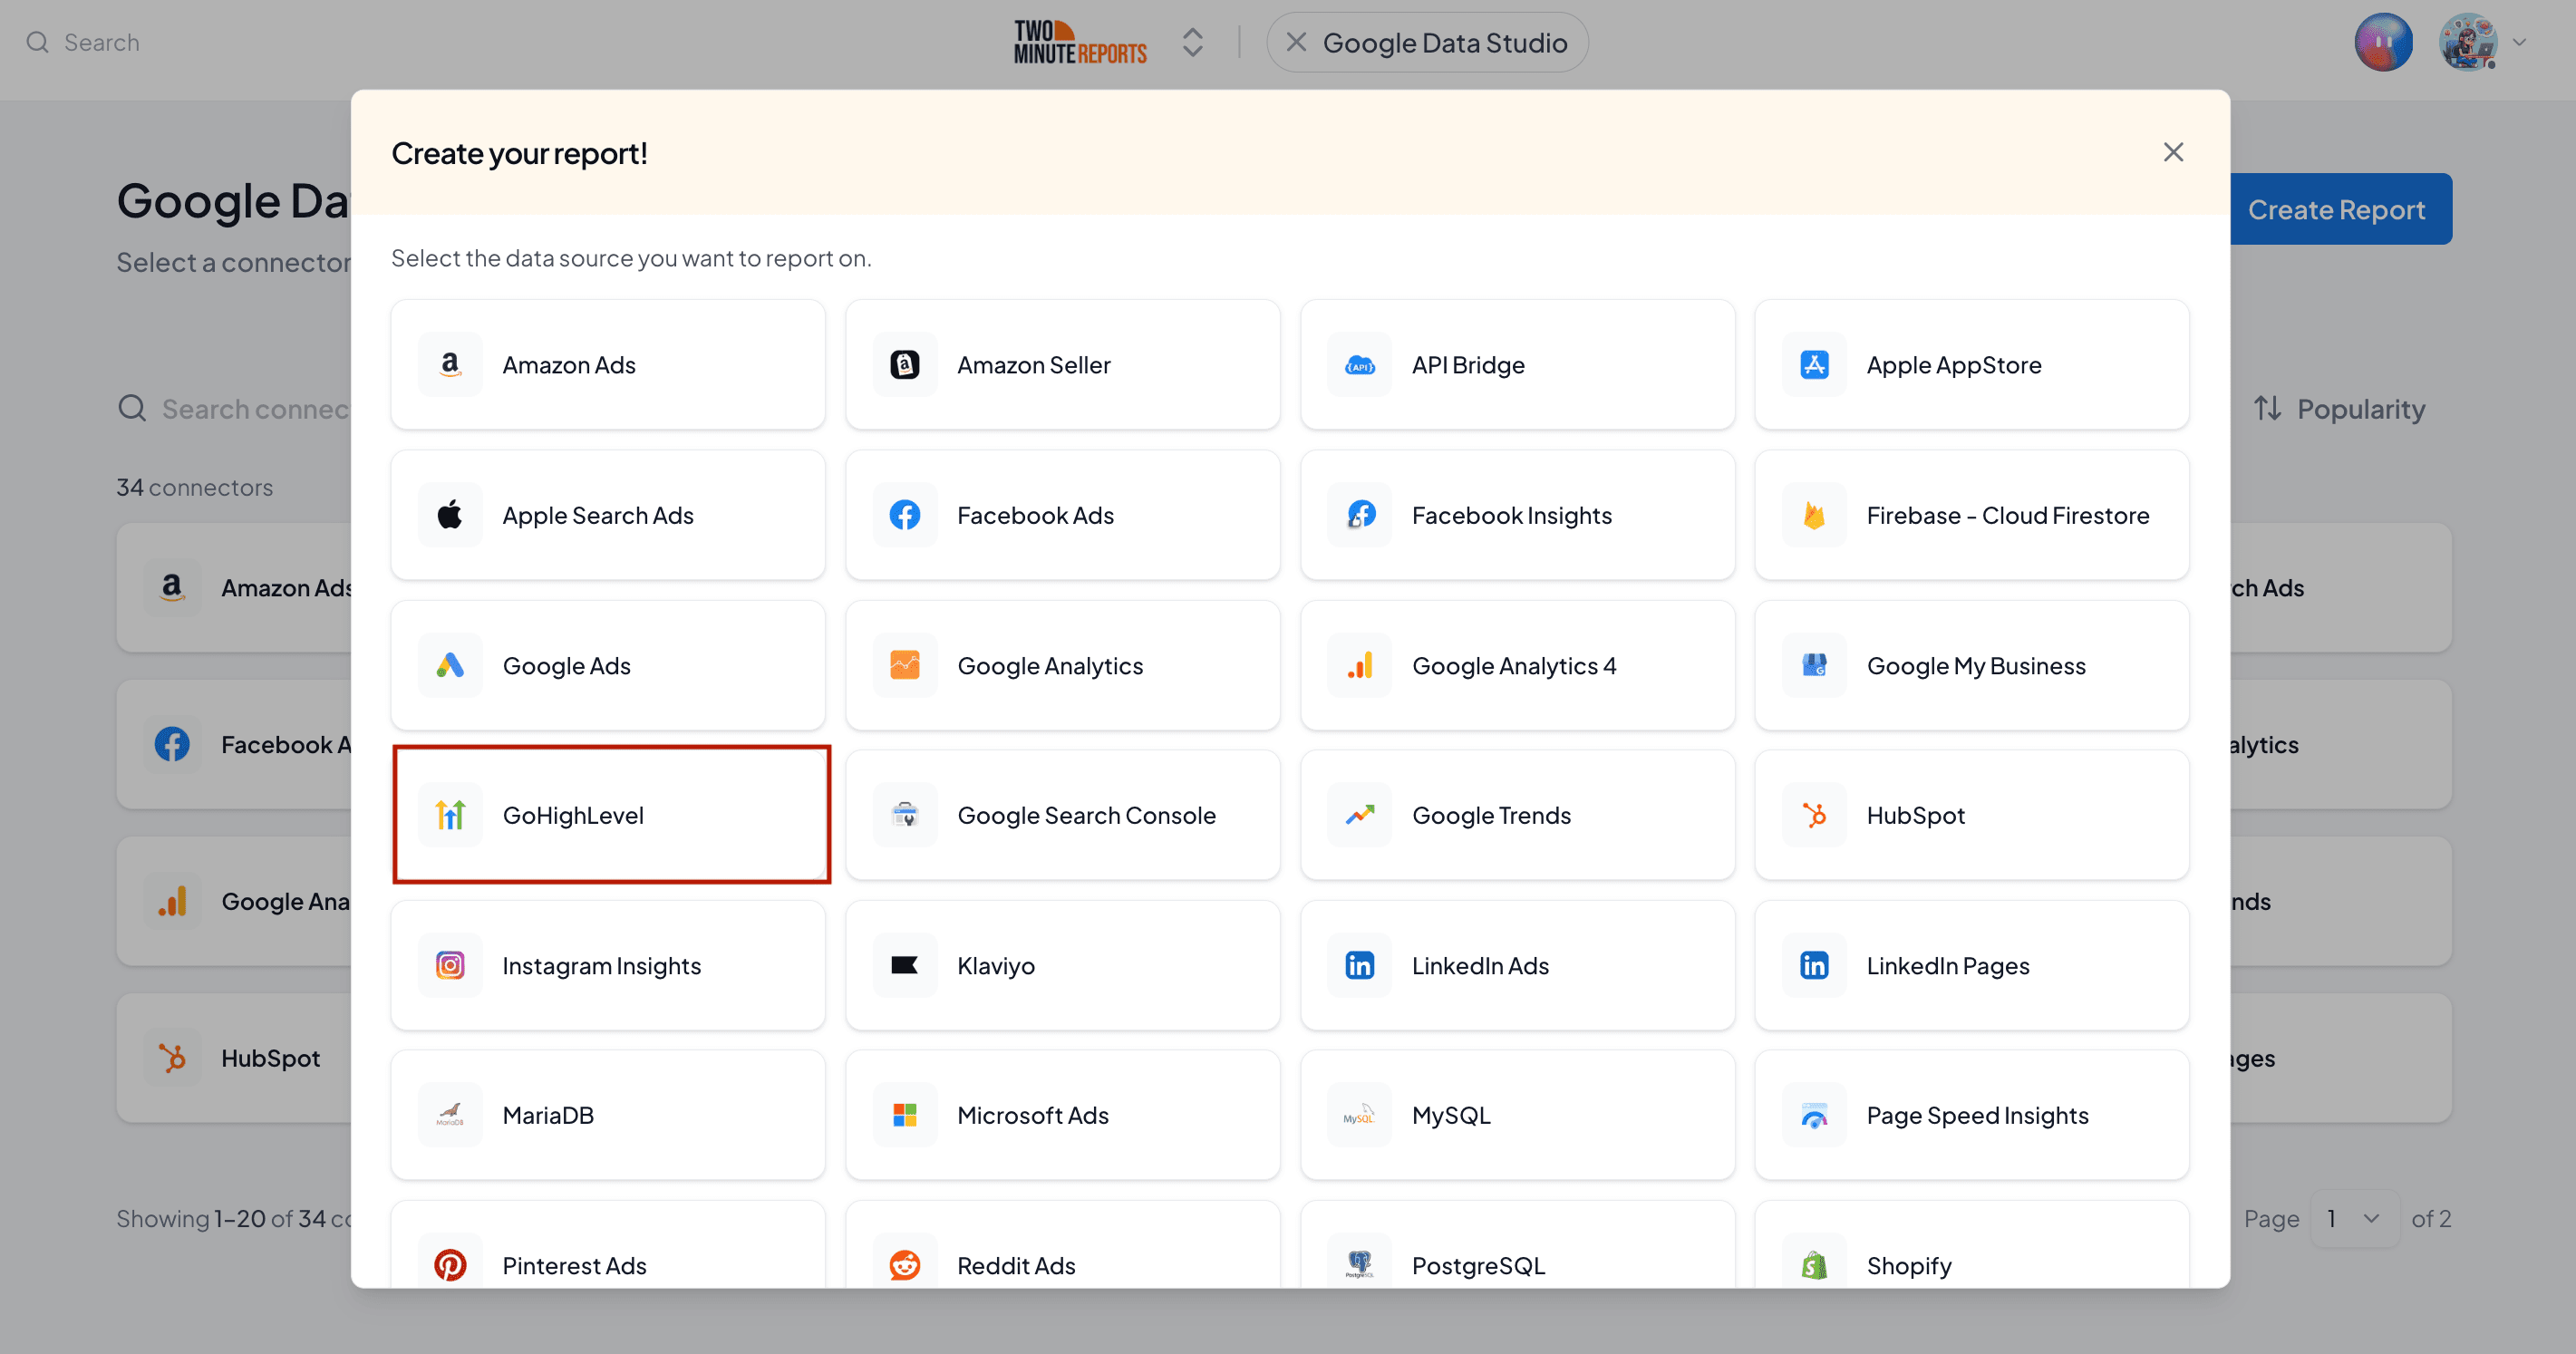
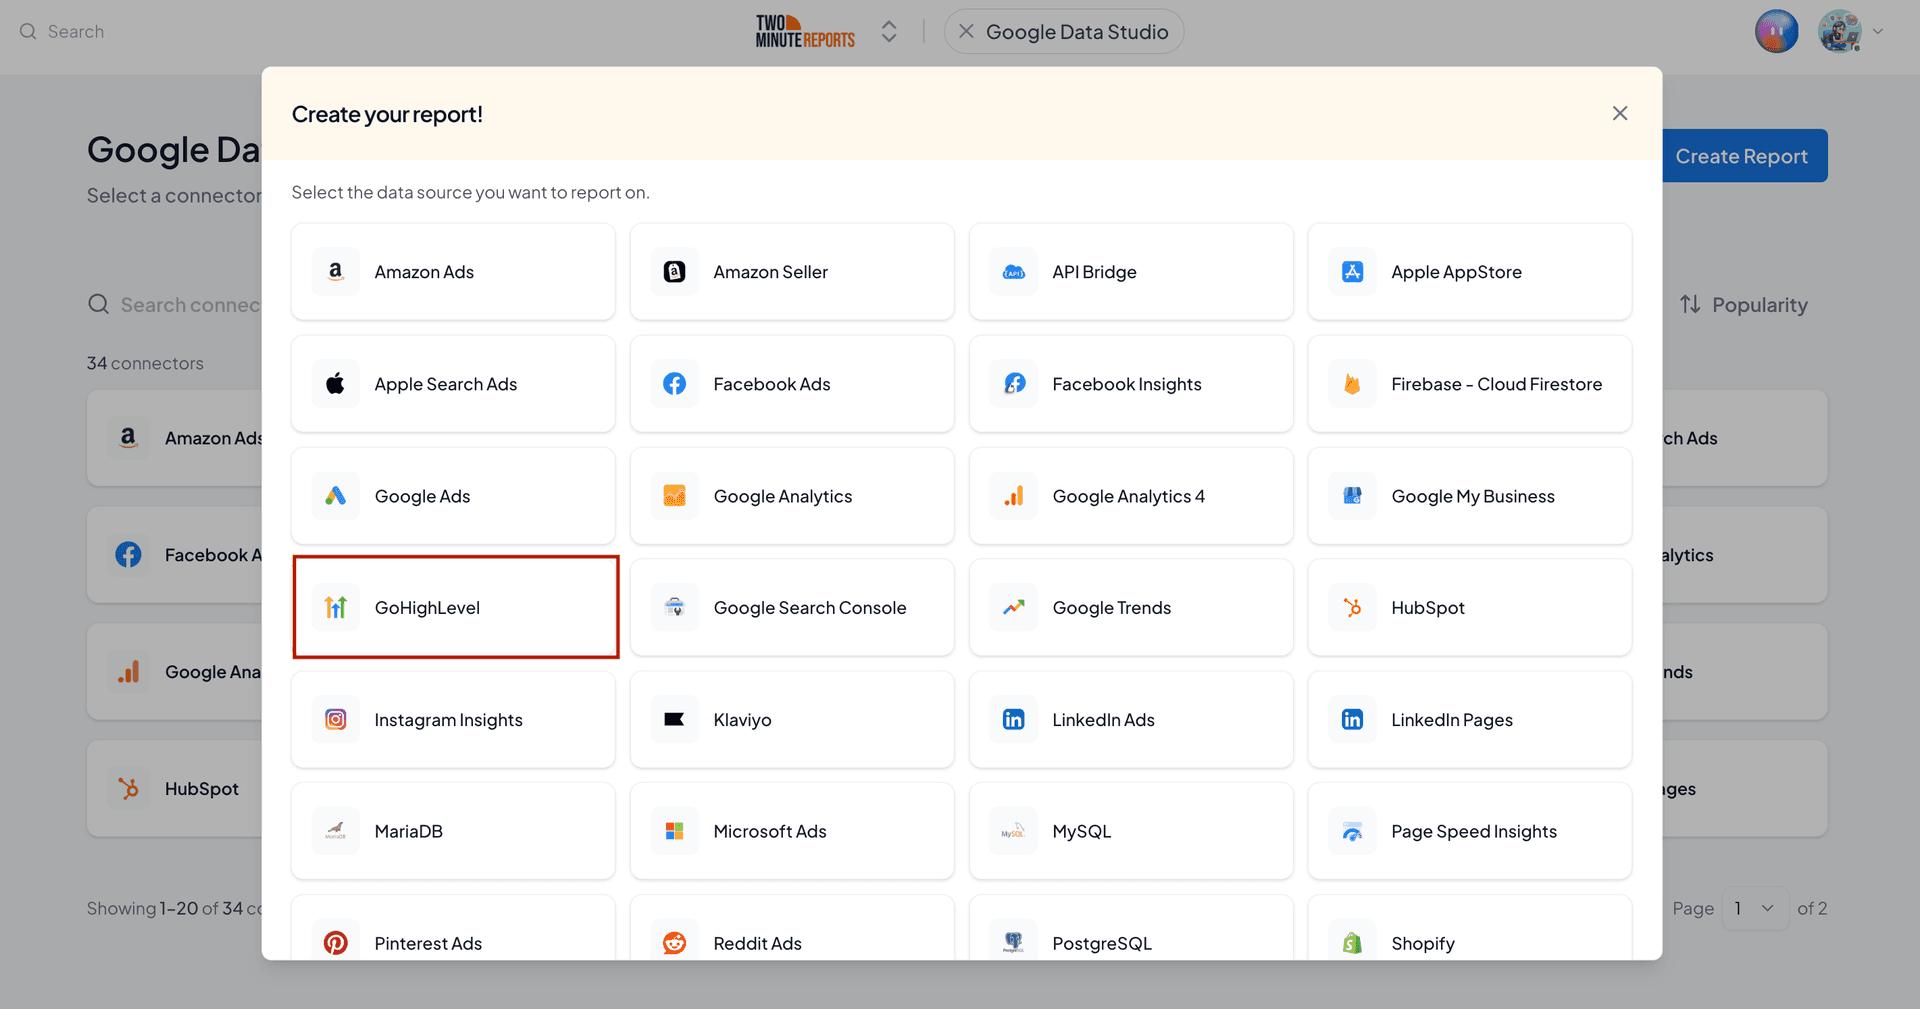
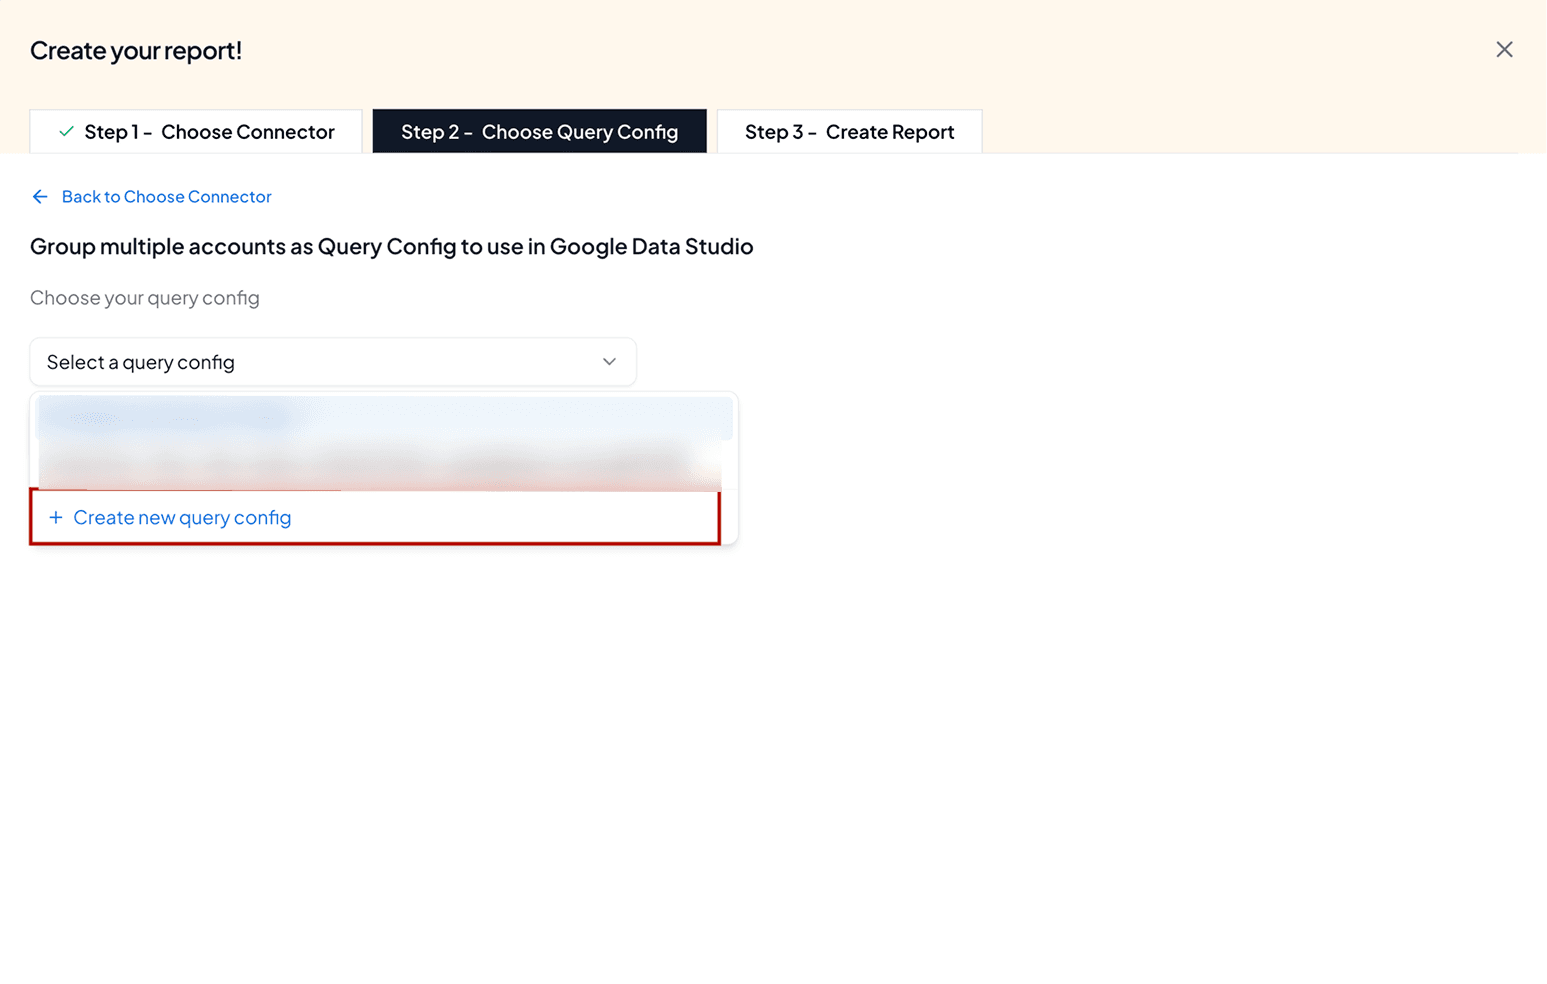
- In Step 2 (Choose Query Config dropdown), click +Create new query config.
Query Config lets you group multiple accounts, making it easier to access centralized insights in your Data Studio dashboard.
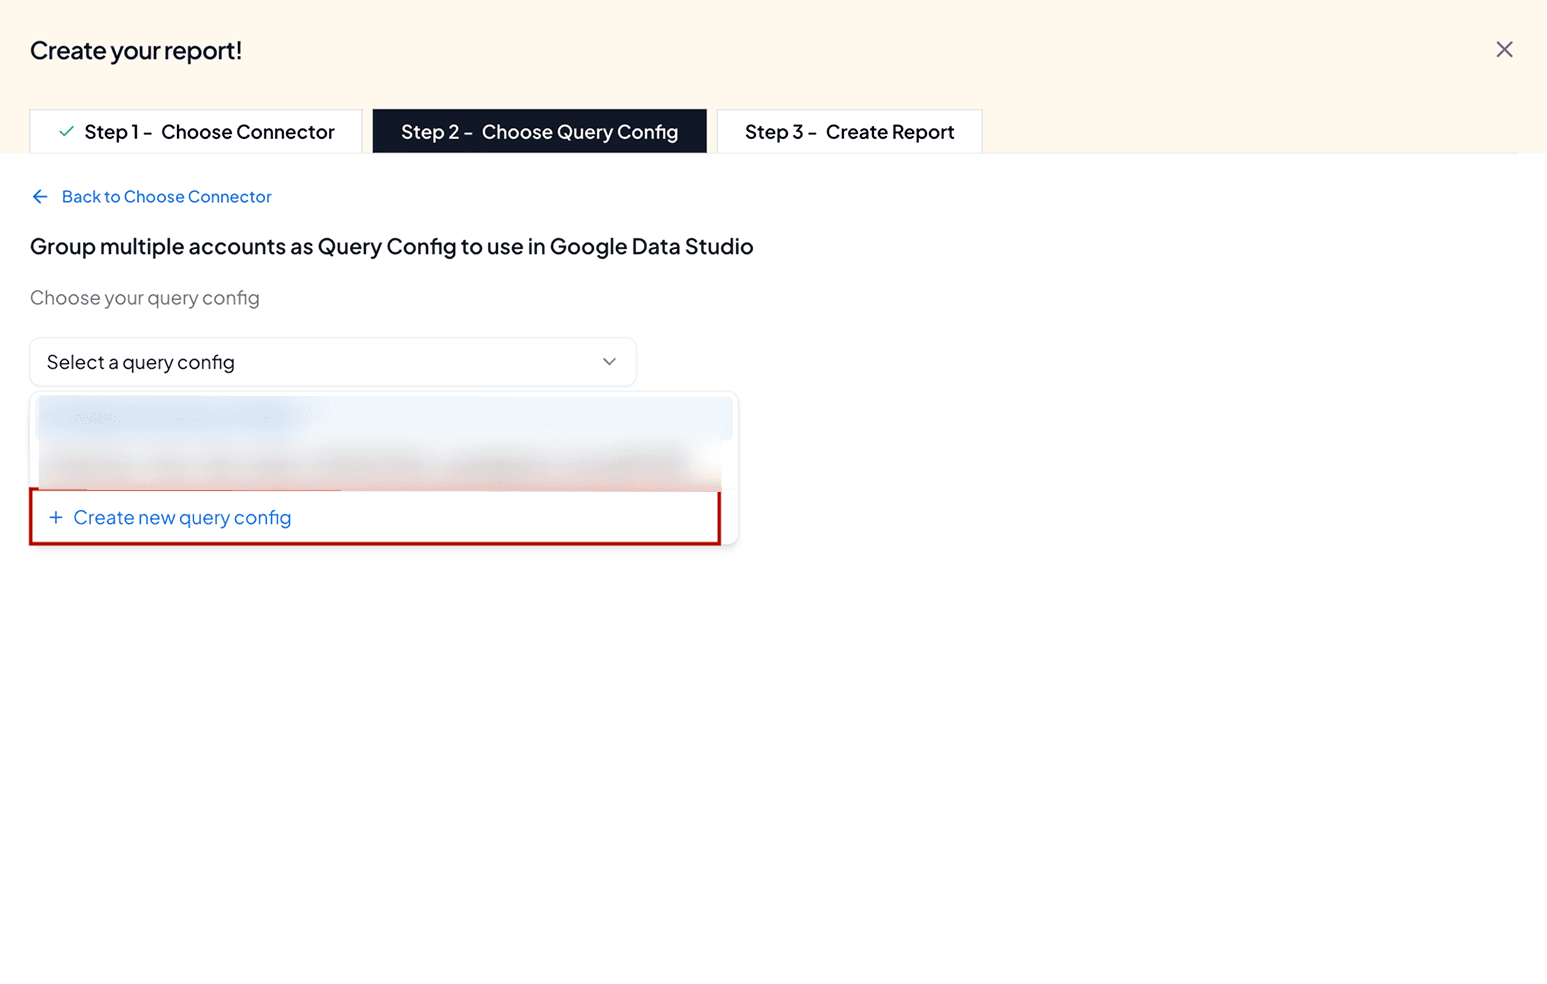
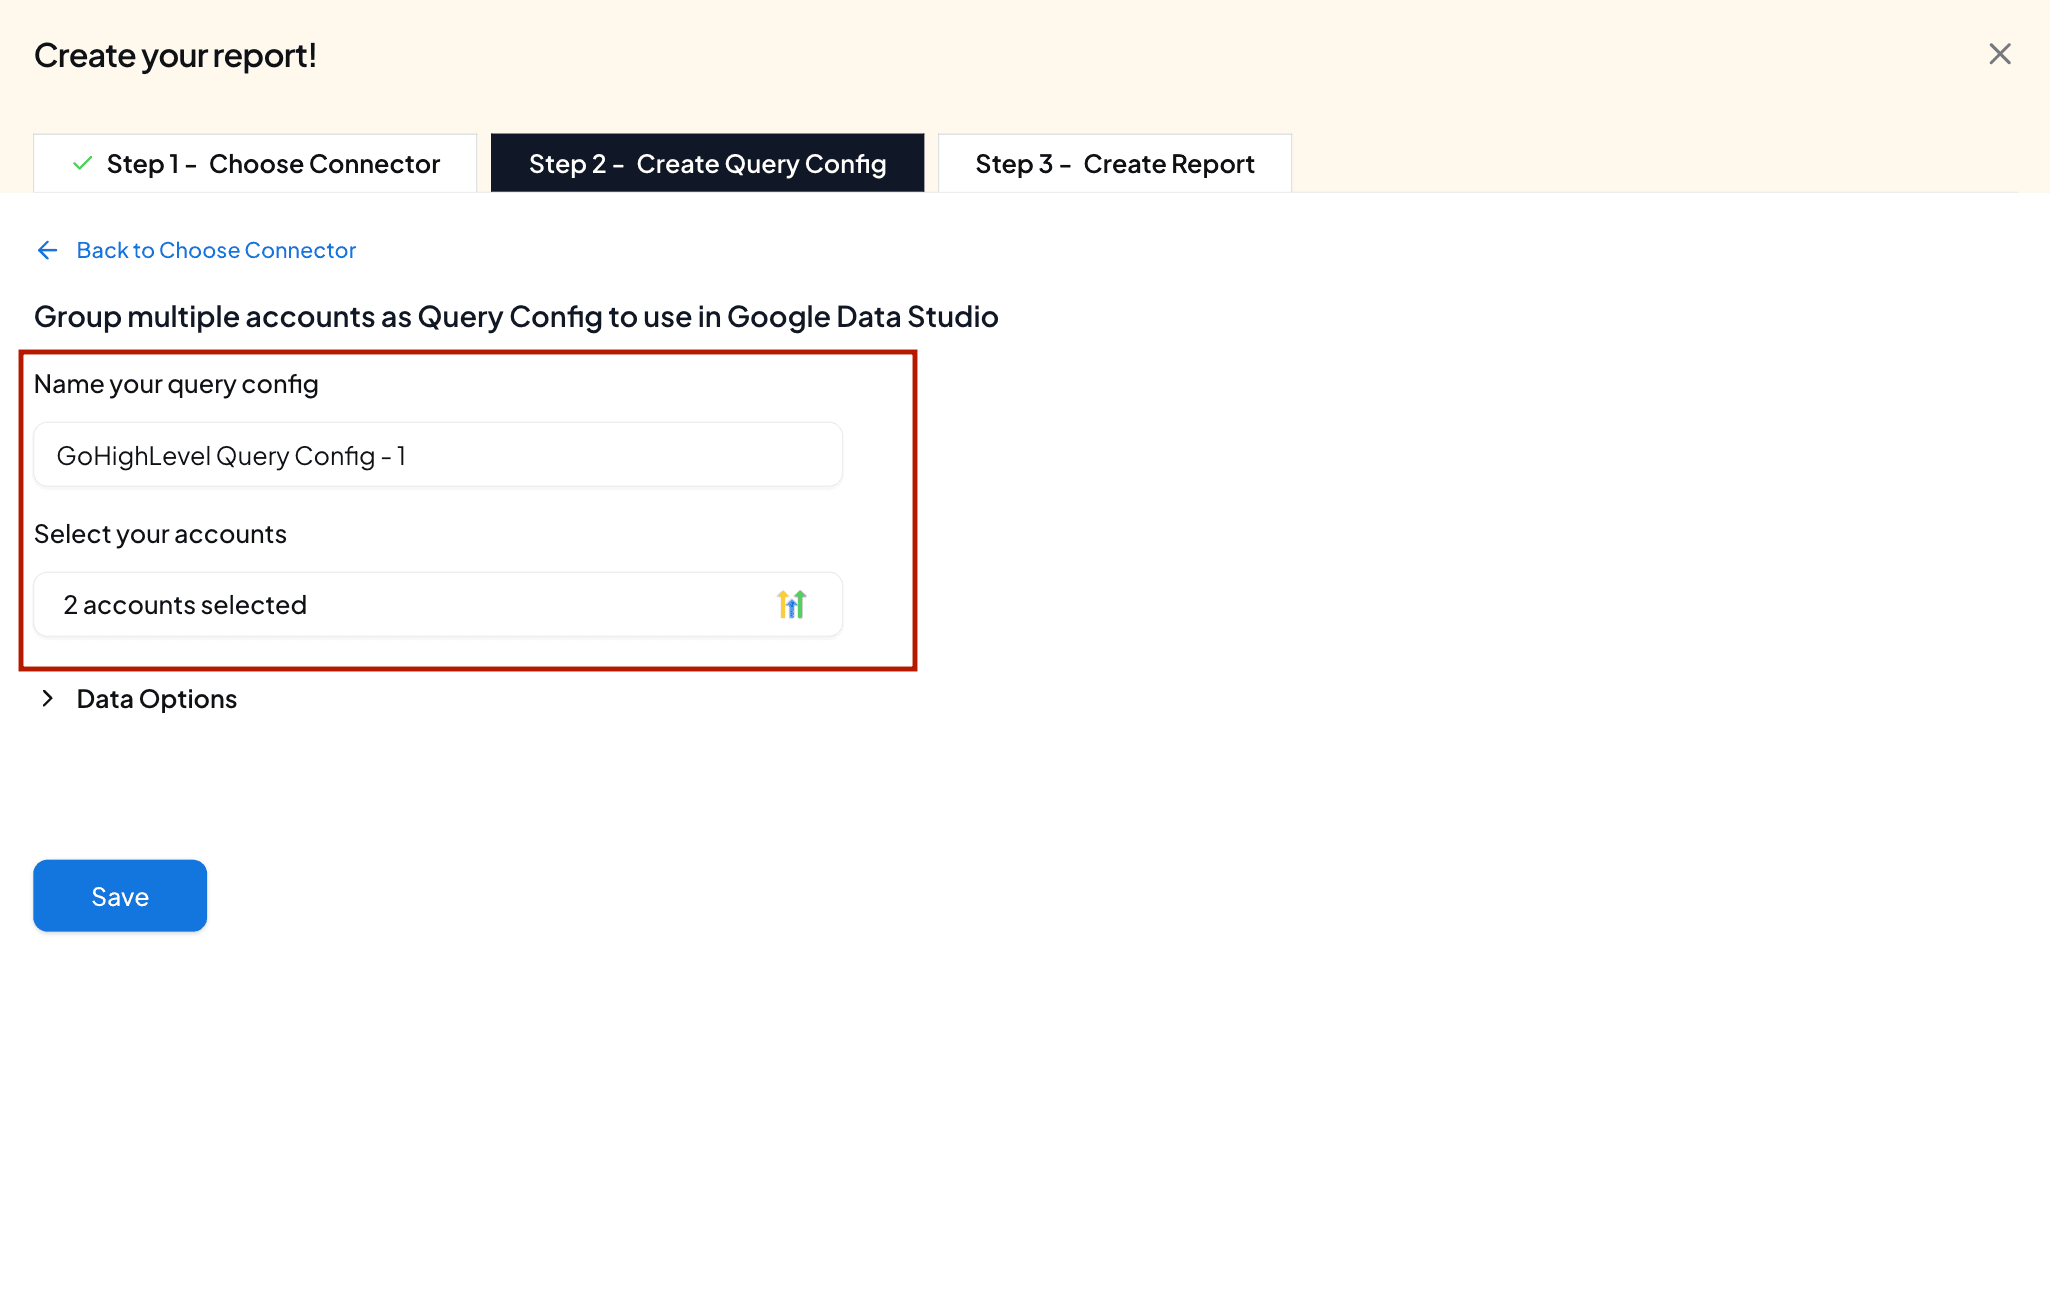
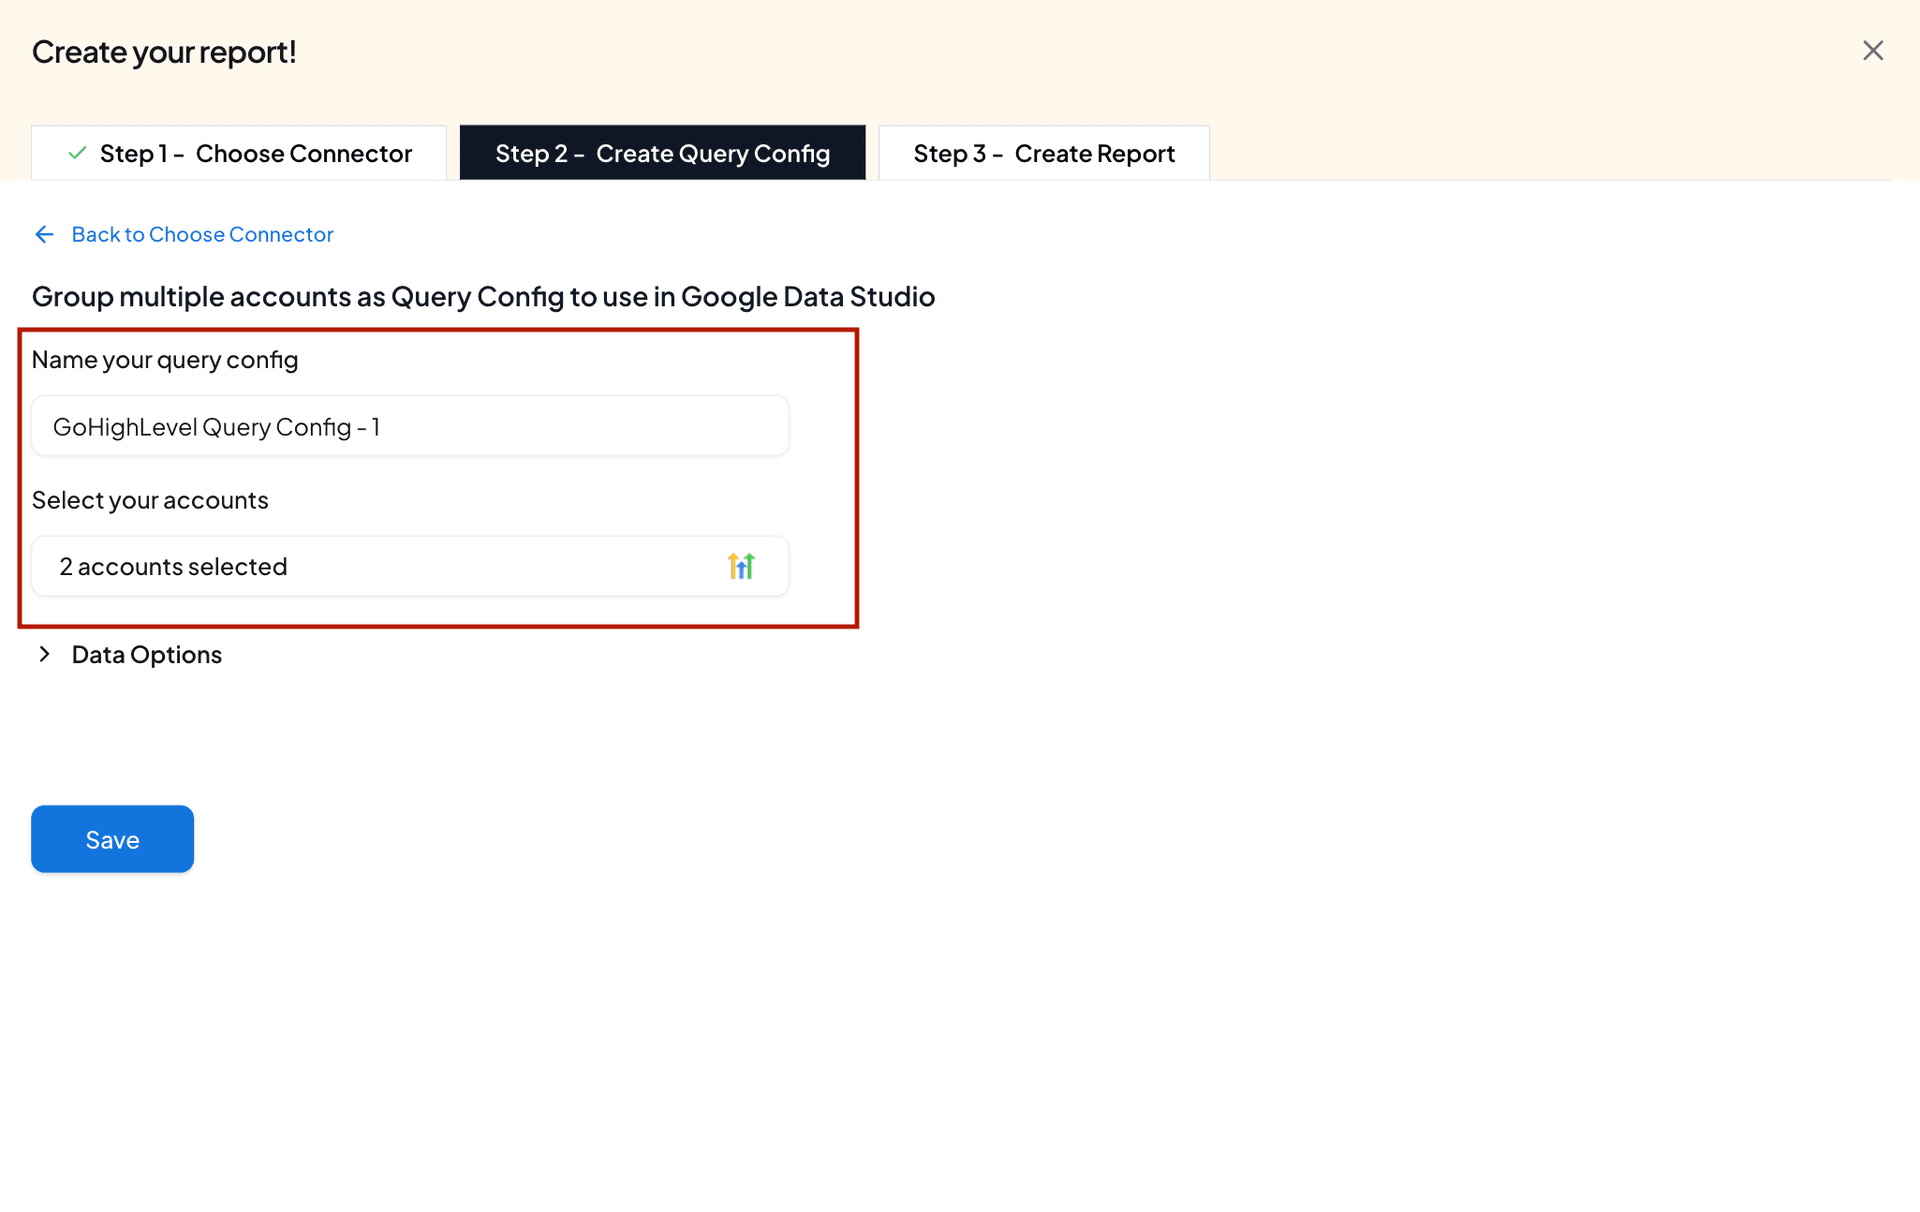
- After you click +Create New Query Config, specify the name of your Query Config and select the required GoHighLevel accounts to connect to Data Studio. Click Save.
- Then, click Create from scratch to build your GoHighLevel dashboard in Data Studio.
Step 3: Build Your GoHighLevel Dashboard in Data Studio
- Now you’ll land on the Data Studio dashboard.
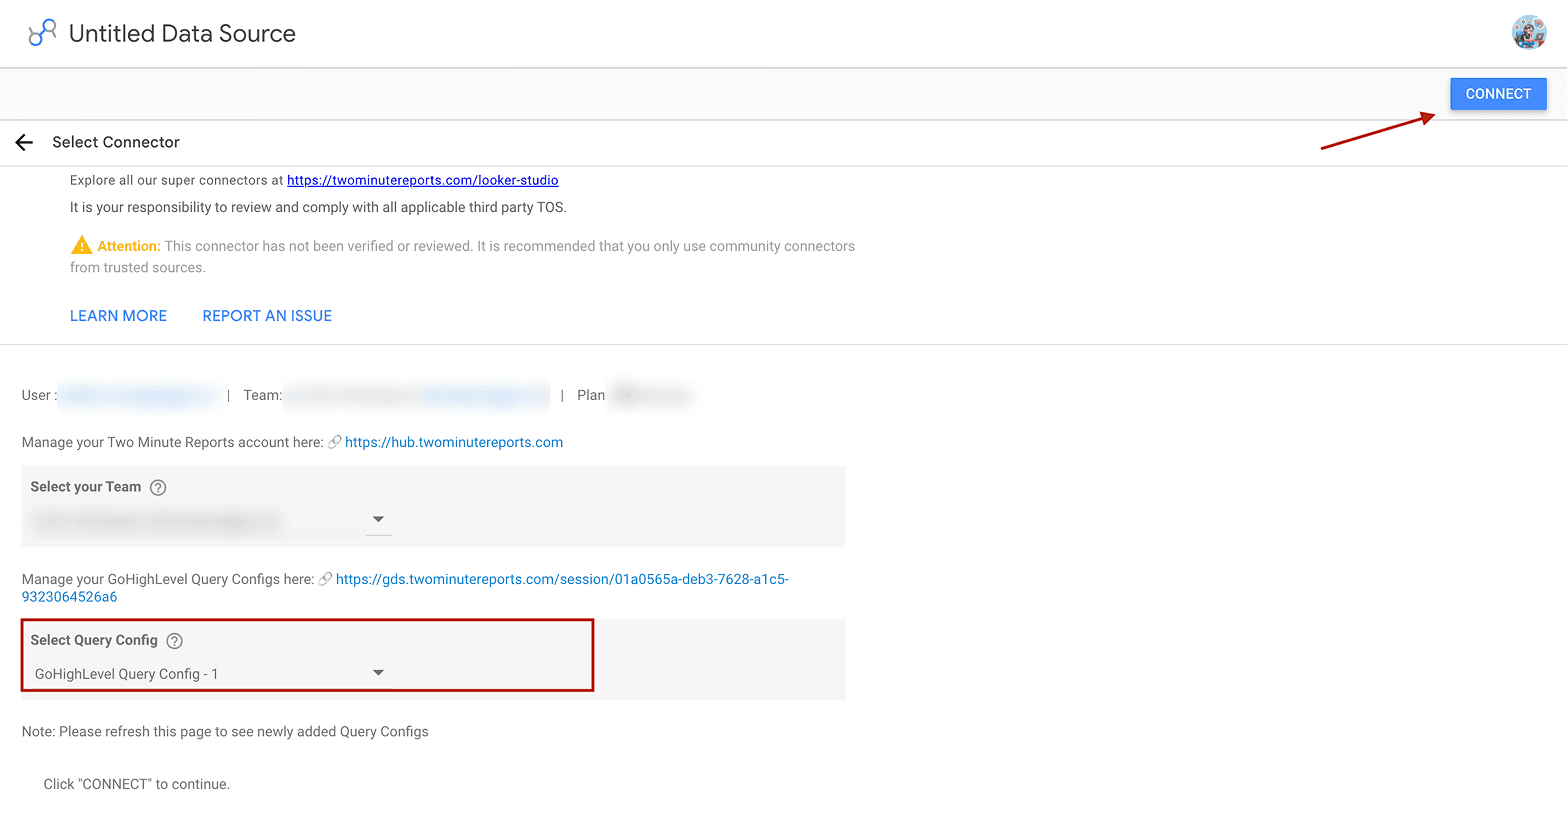
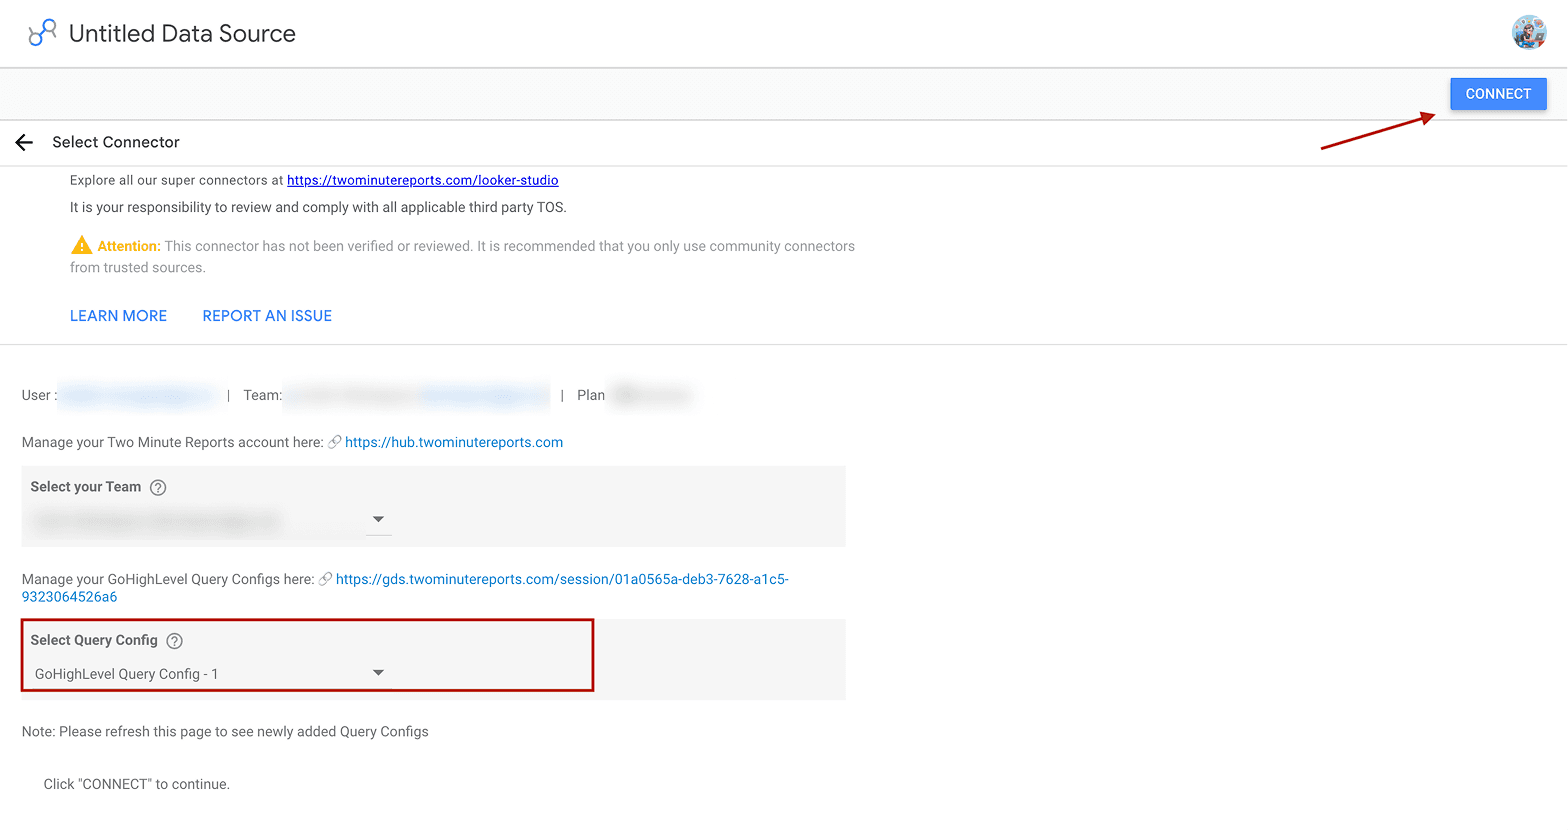
- Select your team and your Query Config (Step 2 - GoHighLevel Query Config - 1). Click Connect to continue.
- Review the GoHighLevel metrics and dimensions to be included, and click Create Report.
- Now you can add relevant charts, drag and drop metrics, include filters, date ranges and dimensions to customize your GoHighLevel dashboard in Looker Studio.
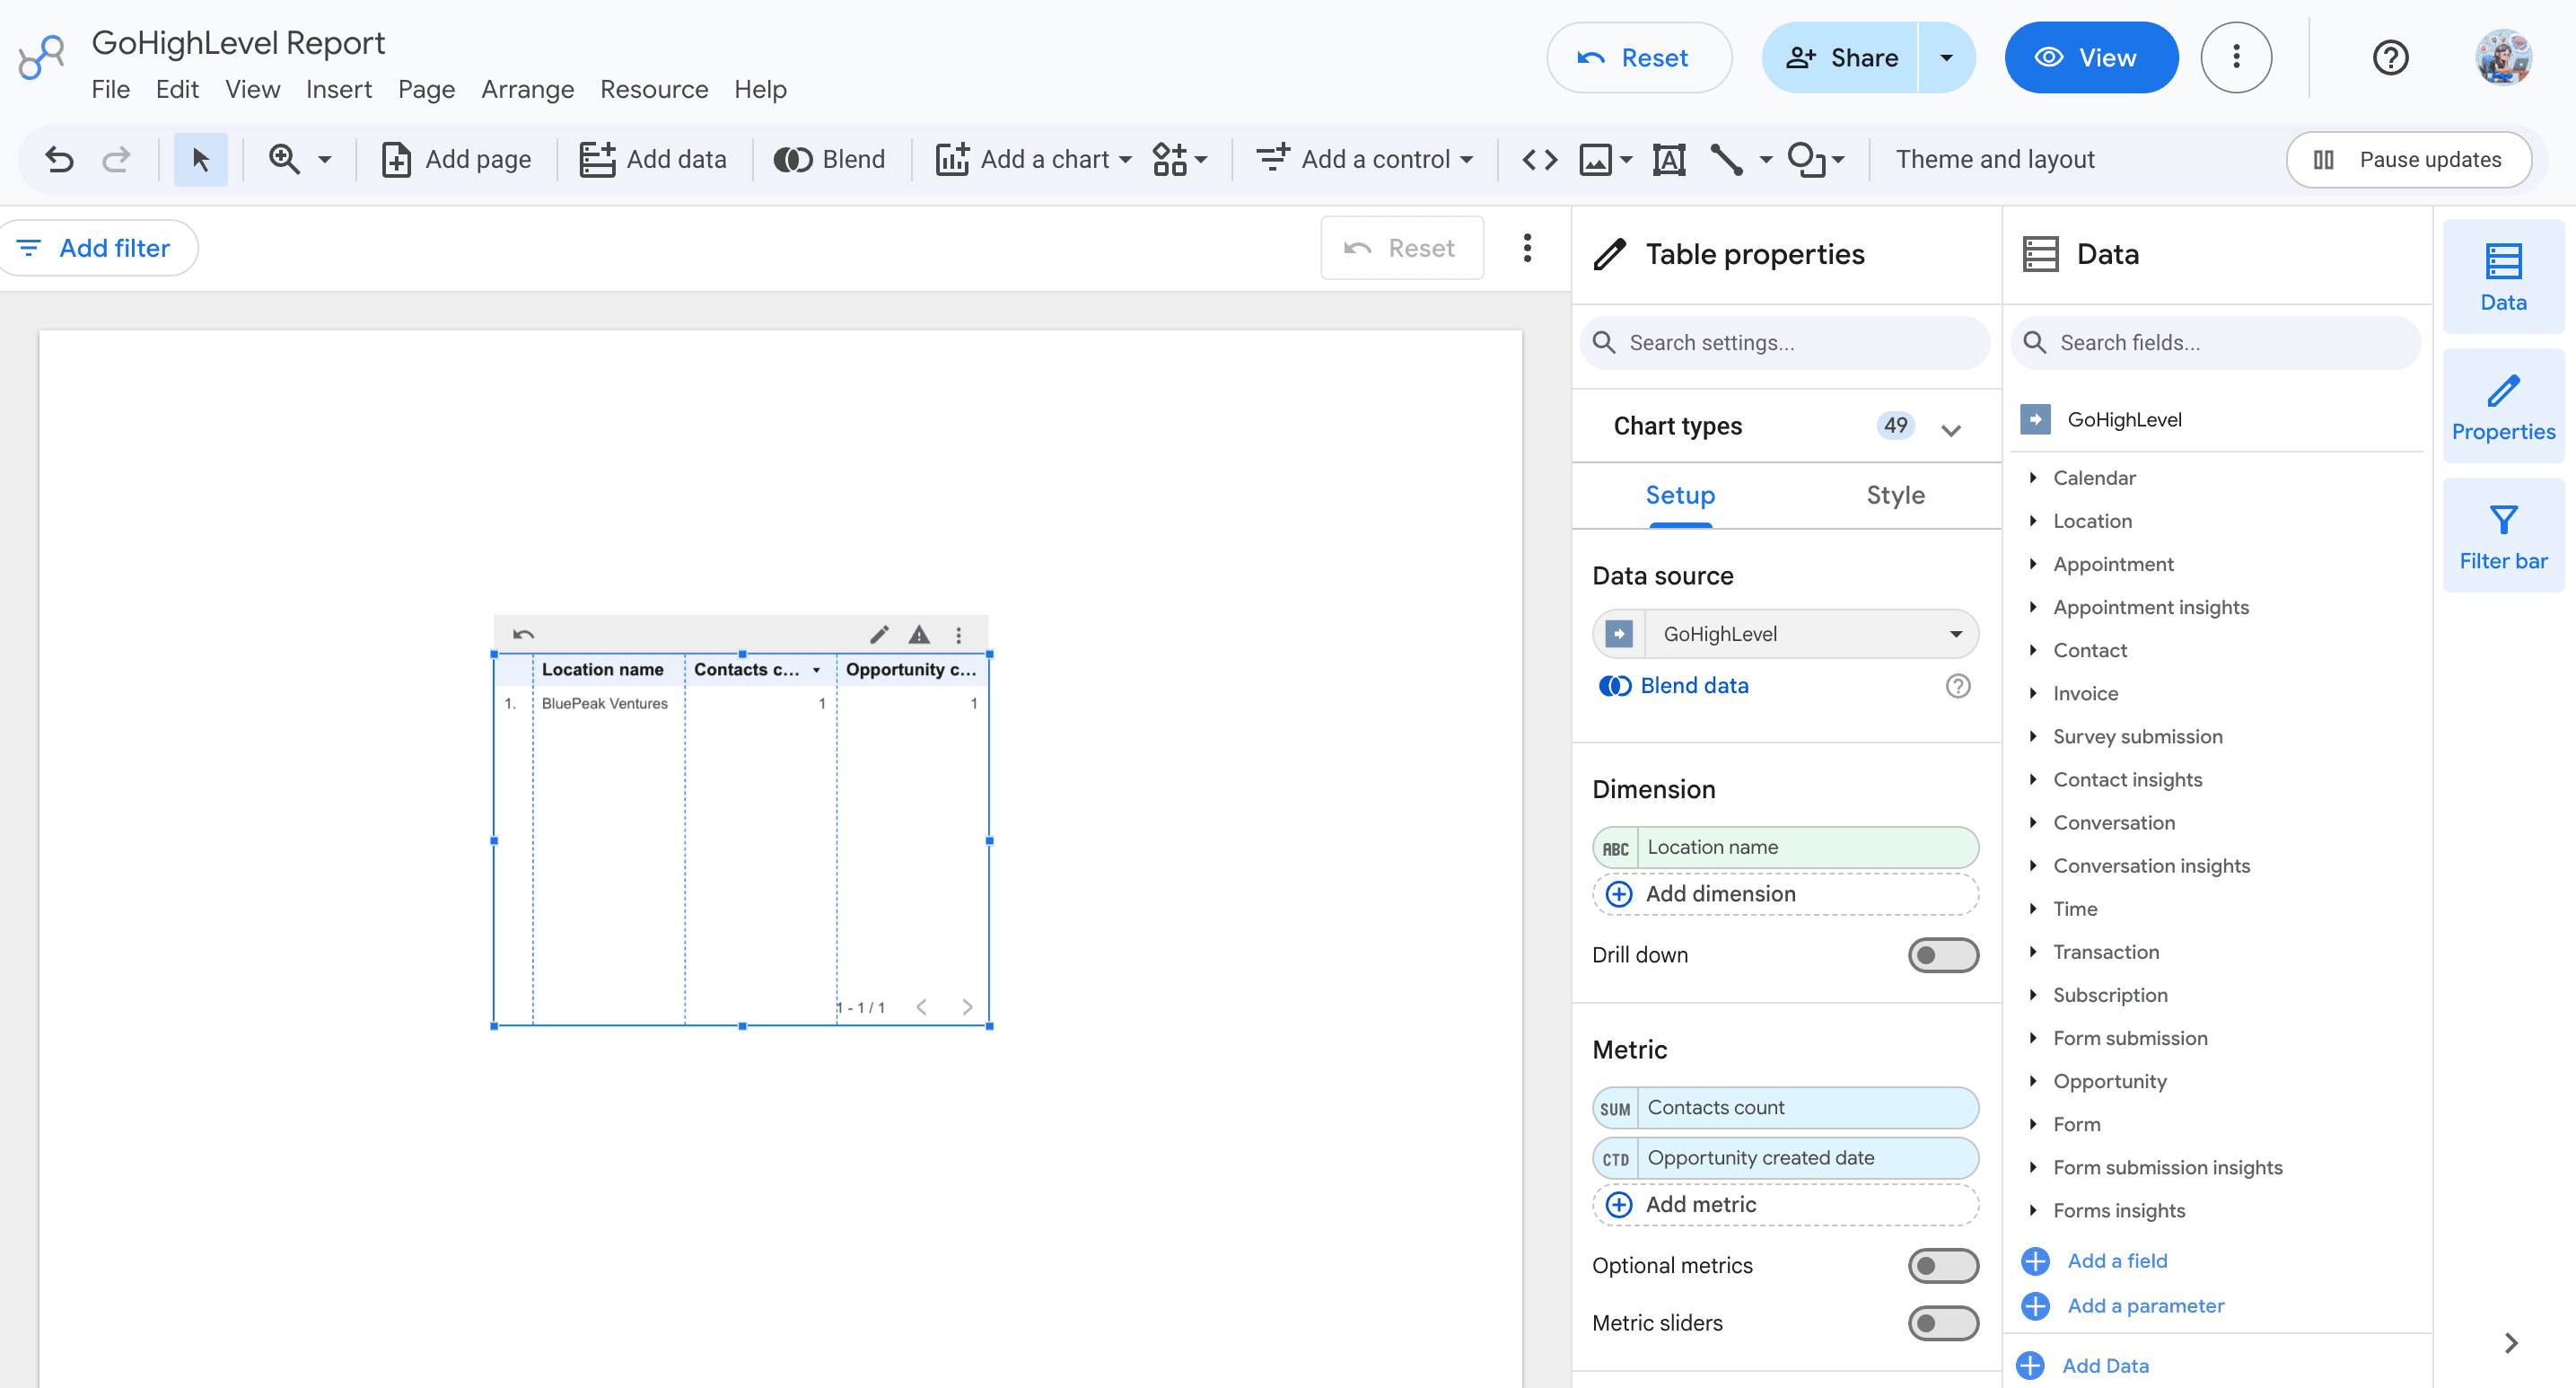
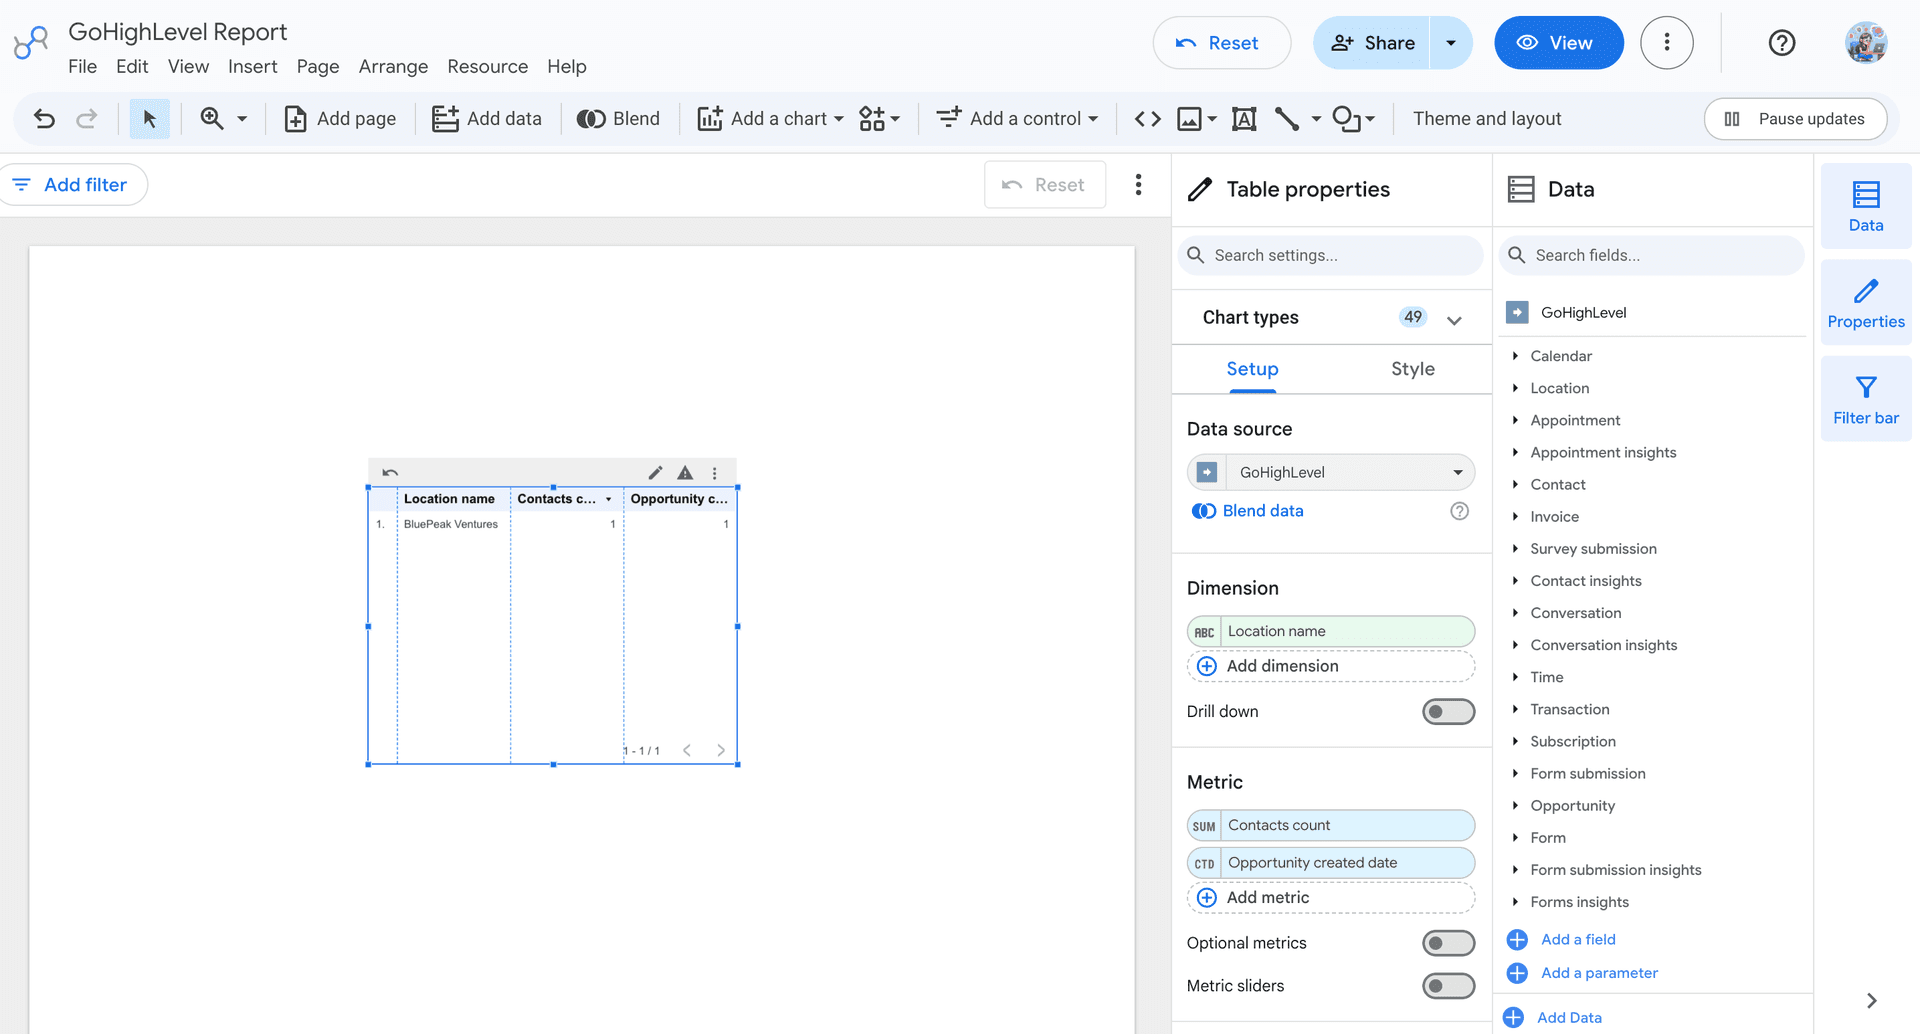
That’s it. You can insert any type of visual element to demonstrate your sales and marketing performance insights. Just select the chart type, and the data flows in automatically.
How to Analyze GoHighLevel Data in Data Studio?
Once your GoHighLevel data is connected to Data Studio via Two Minute Reports, you can analyze contact acquisition, pipeline performance, conversations, and recurring revenue holistically.
Ready to Connect GoHighLevel to Data Studio?
From the first contact to a won opportunity, paid invoice or active subscription, GoHighLevel captures the details behind your customer journey. Bringing that data into Data Studio gives you a clearer way to connect those stages and see how they contribute to your overall business performance.
With Two Minute Reports, you can turn your GoHighLevel data into interactive Data Studio dashboards built around the KPIs your clients care about; from lead sources and pipeline stages to revenue and recurring subscriptions.
Try Two Minute Reports free for 14 days and see how you can transform your raw GoHighLevel data into action-driven dashboards.
Frequently Asked Questions
First, connect GoHighLevel to Two Minute Reports. Then, create a Query Config with the required GoHighLevel accounts you want to use. Once connected, your marketing, sales and other CRM data will be imported to Data Studio, and you can track contacts, subscriptions, invoices, opportunities, pipeline performance, etc., in one place.
With our GoHighLevel Reporting tool, you can pull 40+ metrics and 400+ dimensions, which include contacts, opportunities, pipeline stages, conversations, invoices, orders, transactions, subscriptions, etc. You can segment your data using dimensions such as contact source, opportunity status, pipeline name, etc and relevant date fields to build custom GoHighLevel dashboards in Google Data Studio.
Use Data Studio’s built-in email delivery. Go to Share → Schedule delivery, set your repeat frequency (eg: daily), pick a time, confirm the timezone, add recipients, and click Save. Your updated GoHighLevel dashboards land in your client’s inbox at defined intervals.
Yes. Two Minute Reports includes Speedboost technology, which is designed to process high-volume GoHighLevel datasets effectively. This keeps your dashboards highly responsive, even when analyzing large volumes of historical data.
Yes. Agencies can create separate GoHighLevel connections for their client’s sub-accounts and pull their data into Data Studio. When creating a query, you can select the accounts you want to analyse and build client-specific GoHighLevel reports in Data Studio covering insights on contacts, pipelines, conversations, invoices, and other CRM data.
Yes. You can try Two Minute Reports free for 14 days. During the free trial, you can connect GoHighLevel to Data Studio and explore all the available reporting and automation capabilities to analyze how it fits into your workflow.

Meet the Author
Shalini MuruganShalini is driven by ideas that create a tangible impact. At Two Minute Reports, she specializes in content that helps marketers optimize their reporting workflows. When she's not transforming complex data into meaningful insights, you might find her lost in a book, jotting down ideas in her notebook, or connecting the dots others overlook.