
Summarize this blog post with:
Ecommerce reporting isn’t just about tracking revenue. It helps you assess and improve your profitability by revealing where the budget is working and where it is leaking.
Most ecommerce brands generate data across multiple channels: paid ads, marketplaces, email, and online storefront platforms. But when that data lives in silos, your conversion funnel starts to leak, and decisions become reactive instead of strategic.
For agencies and performance marketers, the complexity compounds. You’re not just analyzing one store – you’re monitoring multiple clients, reconciling data across platforms, building dashboards, and translating metrics into insights that justify budget and drive retention.
This is where a structured ecommerce reporting framework becomes critical. It connects acquisition, retention, product performance, and profitability into a single decision-making layer.
In this guide, we’ll cover how to prioritize the right metrics, the standard ecommerce reports that matter, the tools and templates to streamline your workflow, and how to turn reporting into a growth engine.
Let’s get started.
What is Ecommerce Reporting?
Ecommerce reporting is the practice of measuring and evaluating performance across all your store operations – including marketing, sales, and customer activity using consolidated data.
It standardizes how metrics are tracked, compared, and interpreted across channels, to consistently evaluate performance over time.
More importantly, it establishes a reporting system that links numbers to actions, not just dashboards to observation. This is why a properly structured ecommerce report is crucial for improving ROI, serving as clear evidence to guide informed next steps.
Why is Ecommerce Reporting Critical to Your Business Growth?
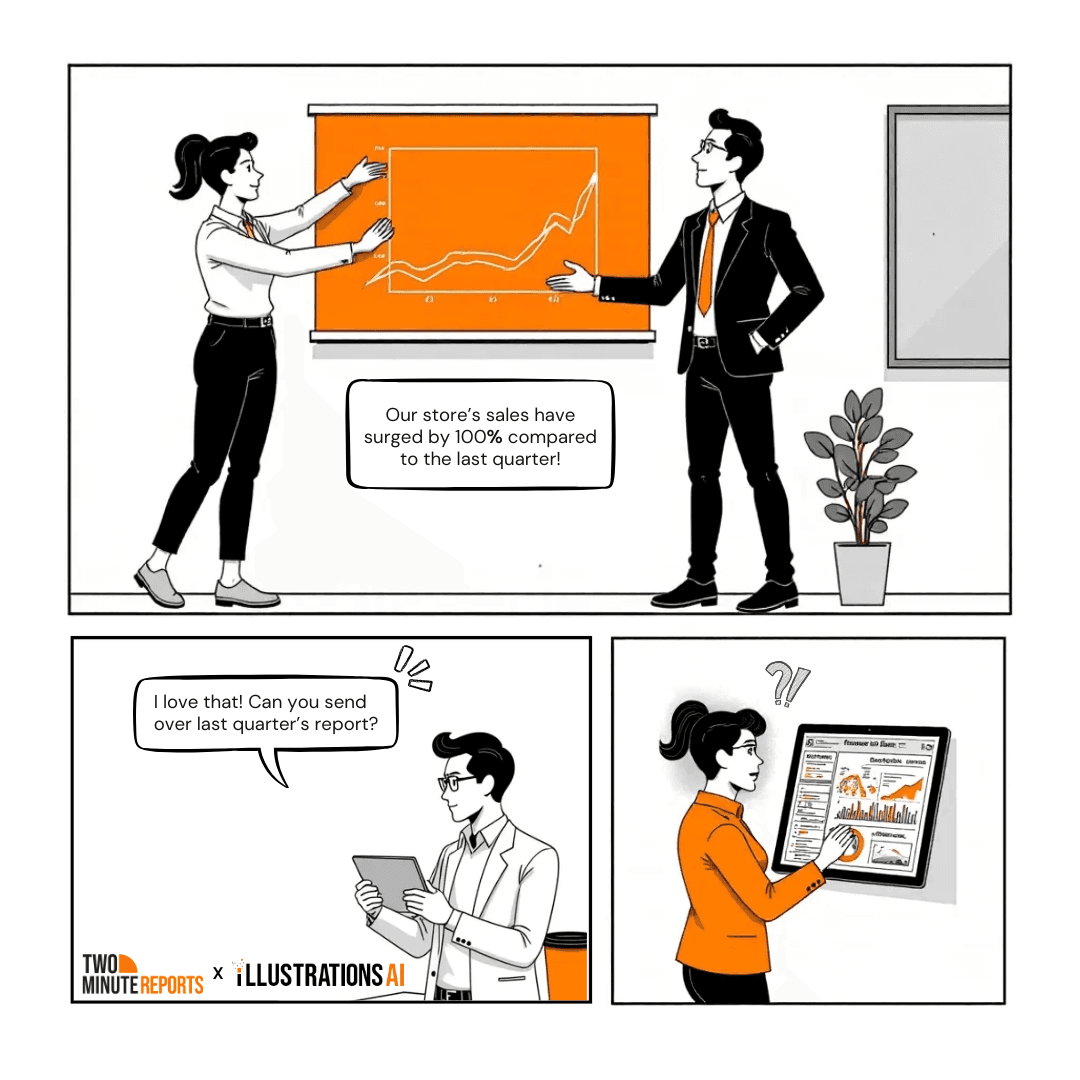
A 100% sales increase sounds impressive until someone asks what has changed.
Was it higher ad spend? A seasonal spike? Discounting? A one-time marketplace boost? Without historical comparison and margin context, growth can be misleading.

This is where ecommerce reporting shifts from “nice to have” to business-critical. Here’s why it directly impacts growth:
- Validates whether revenue growth is actually profitable: Compare revenue against CAC, discounts, returns, and contribution margin before scaling spend.
- Prevents inefficient budget expansion: Identify diminishing returns across channels before higher ad spend affects efficiency.
- Detect margin leaks early: Monitor platform fees, shipping costs, refund rates, and discount dependency before they compound.
- Separate seasonal spikes from sustainable trends: Use time-based comparisons to avoid scaling based on short-term anomalies.
- Prioritize high-margin products: Allocate budget toward SKUs that improve contribution margin.
- Create predictable growth loops: Use performance trends to forecast scaling decisions and refine strategy accordingly.
Next, let’s analyze how to pick the right ecommerce metrics to help you measure progress from strategy to execution.
How to Identify the Ecommerce Metrics That Influence ROI?
Before adding any ecommerce metrics to your report, run through these questions:
- Does this metric directly affect profit per order? If it doesn’t impact how much you earn or spend per customer, it won’t influence ROI.
- Will a change in this metric force a decision? If it improves or declines, would you adjust the budget, pricing, or retention strategy? If not, deprioritize it.
- Can this metric be tied to a specific channel or segment? Metrics help you identify where profit is made or lost.
- Does it reveal sustainability, not just growth? Revenue spikes mean little without repeat purchase behavior and cost control.
- Can you directly influence it? Focus on metrics connected to actions you can take, such as improving conversion rate, reducing ad spend, and increasing repeat rate.
After identifying ROI-driving ecommerce metrics, organize them by how often they require action. Here’s how you can do that:
Action rule: If a metric hasn’t changed a decision or budget allocation in 90 days, stop tracking it.
6 Types of Ecommerce Reports Every Agency Should Focus On
In this section, let’s have a look at the 6 most important ecommerce reports that help you measure revenue, operational efficiency, profitability, and long-term retention.
1. Sales Report – Are We Scaling Quality Revenue?
The sales report clarifies how revenue is distributed across channels, how AOV and conversions are trending, and whether gains are compounding or staying flat.
This report includes:
- Net revenue
- Revenue by channel
- Conversion rate
- Average Order Value
- Revenue per session
- Period-over-period comparisons
Why does it matter: It helps you decide whether to increase the budget, improve conversion rate, or optimize channel mix.
2. Inventory Report – Is Capital Supporting Growth or Restricting It?
This report highlights slow-moving SKUs, stockout risks, and turnover performance, allowing agencies to stay on track with operational capacity. Without it, scaling can affect supply-side weakness.
This report includes:
- Inventory levels by SKU
- Sell-through rate
- Days of inventory remaining
- Highlight products with fast and slow-moving inventory
- Inventory turnover ratio
Why does it matter: It ensures that your marketing activity aligns with stock health and protects both revenue continuity and cash flow.
3. Order Report – Is Demand Converting Without Friction?
The order report focuses on transaction efficiency. It includes total orders and growth rate, average order value, checkout abandonment, refund, and payment method distribution.
This report includes:
- Total orders
- Total number of items ordered
- Checkout abandonment rate
- Order value distribution
- Average number of items per order
- Products ordered in bulk (frequently)
Why does it matter: If sessions increase but orders lag, the issue might be checkout friction or operational delays. It prevents misattributing revenue loss to marketing alone.
4. Product Analytics Report – Which SKUs Deserve More Budget?
This report enables you to reallocate ad spend toward high-margin, high-conversion products and eliminate budget leakage on underperforming inventory.
This report includes:
- Revenue per SKU
- Product-level conversion rate
- Add-to-cart rate
- Repeat vs new customers for a specific product
- Refund rate per SKU
Why does it matter: This report evaluates SKU-level performance to inform scaling decisions.
5. Financial Report – Is Growth Translating Into Profit?
It gives a high-level overview of revenue and expenses, helping you evaluate bottom-line performance.
This report includes:
- Gross Margin
- Net profit
- Cost of Goods Sold
- Customer Acquisition Cost
- ROI per campaign/channel
- Profit and loss per time period
Why does it matter: This report validates whether scaling campaigns improve profitability or increase cost pressure.
6. Customer Report – Is the Growth Sustainable?
These reports help you strengthen your conversion funnel by deep diving into customers’ purchasing preferences and behavior. This forms the core for long-term retention.
This report includes:
- New vs returning customers
- Repeat purchase rate
- Average Customer Lifetime Value
- Purchase frequency
- Average length of customer relationship
Why does it matter: Customer reports reveal buying crucial buying patterns that help in improving your sales and overall profitability.
How to Create an Ecommerce Report in 4 Simple Steps?
In this section, let’s see how to effectively build an ecommerce report using Two Minute Reports. Here’s a simple 4-step process to get it done:
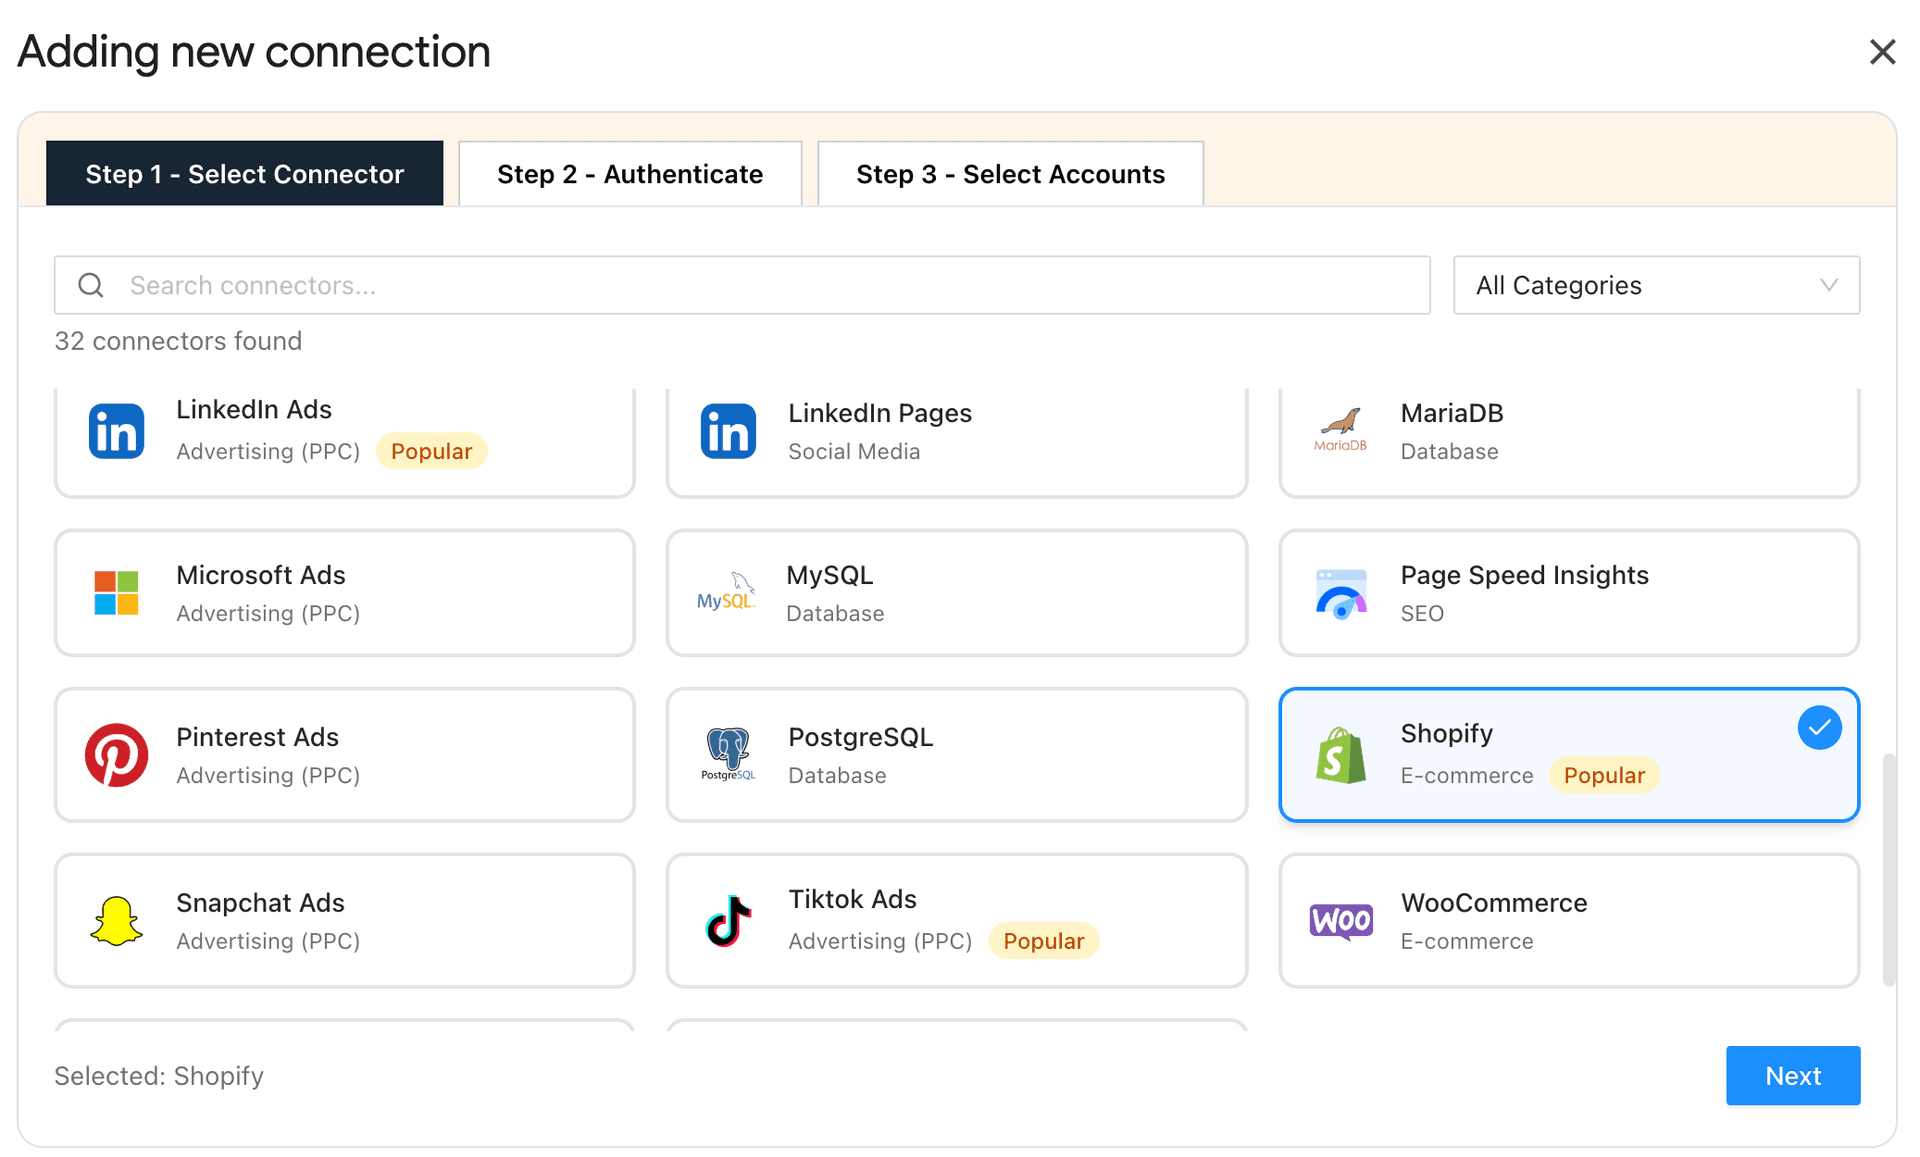
Step 1: Connect Your Ecommerce Platforms
Install the Two Minute Reports add-on from the Google Workspace Marketplace, then authenticate your store:
- Shopify: OAuth (One-click)
- Amazon Seller: OAuth (One-click)
- WooCommerce: API Key
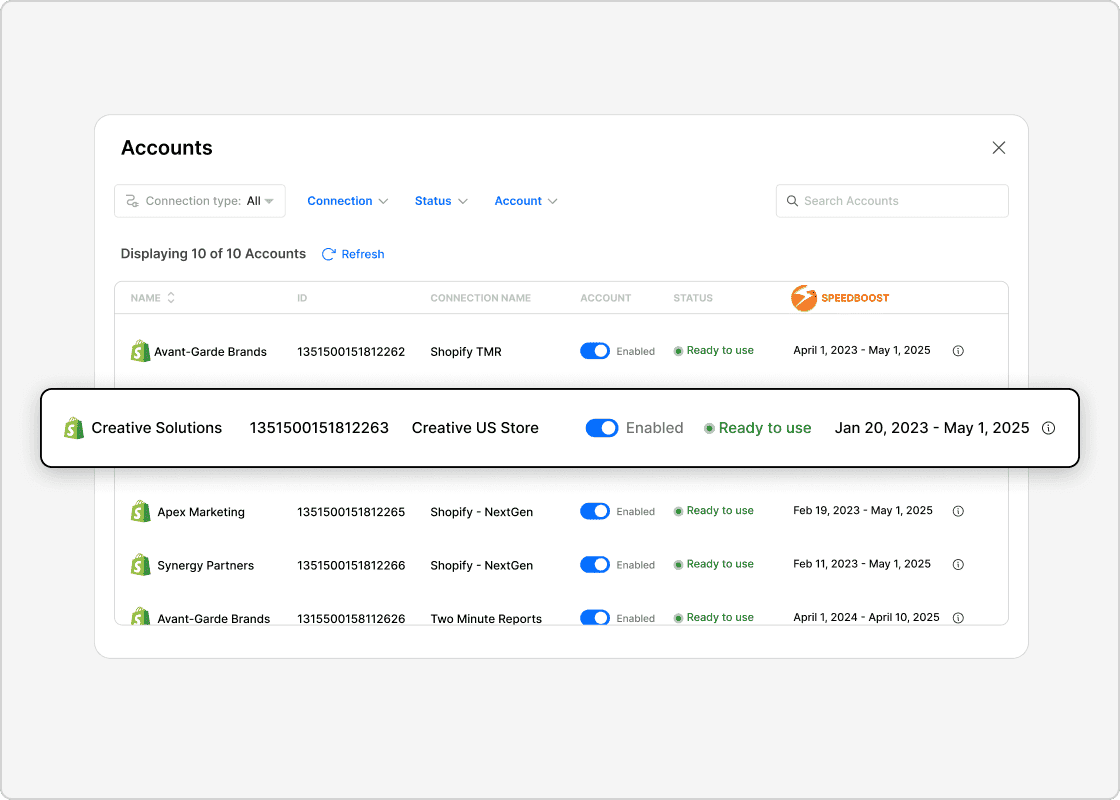
Once done, map multiple stores to respective clients directly inside Google Sheets – switch accounts via dropdown instantly.

Step 2: Align Metrics That Match Your Client’s Goals
Here, the ultimate goal is clarity. The client reviewing your report should immediately understand where the profit is improving or leaking. Choose metrics that clearly reflect:
- Cash flow view → Am I profitable this month? (revenue vs spend)
- Channel efficiency view → Which channels are worth scaling? (acquisition cost vs return)
- Retention view → Are customers coming back? (repeat behavior & customer value)
When each view answers one clear question, you can make decisions faster that scale.
Step 3: Customize Your Ecommerce Dashboard
- With Two Minute Reports’ ecommerce reporting templates, you can quickly build dashboards that reflect your client’s ecommerce ROI.
- Modify your ecommerce dashboard to include: store-level breakdown, sales by store name, inventory levels, customer demographics, and other relevant insights that match your client’s objectives and goals.
- Group data logically so your clients can quickly navigate between revenue, marketing performance, and inventory insights.
- Add your logo, colors, interactive layouts, and deliver branded, professional ecommerce dashboards to clients, signalling your agency’s expertise.
Pro tip: Once you have created an ecommerce dashboard, you can reuse it across multiple clients. This ensures standardization, consistency, improves speed, and eliminates confusion during performance reviews.
Step 4: Automate for Real-Time Store Performance Insights
Once finalized, schedule your reports to be sent at custom intervals (daily, weekly, or monthly) based on your client’s requirements. Set cadence based on operational needs:
- Daily → Revenue, Ad spend, ROAS
- Weekly → CAC by Channel, Conversion Rate, Cart Abandonment
- Monthly → LTV/CAC Ratio, Cohort Retention, Product Return Rate
Pro tip: Standardize your metric formulas and naming conventions before automating. Changing definitions mid-cycle creates inconsistency in reporting and client confusion.
Top Ecommerce Reporting Templates For Faster Data-Driven Analysis
In this section, let me highlight the top ecommerce reporting templates that help you streamline, automate, and optimize your store performance.
1. Shopify Overview Report

This interactive Shopify Looker Studio reporting template provides a clear, decision-ready view of your store’s performance in one dashboard. It features dynamic scorecards with date comparisons for Gross Sales, Orders, and New vs Returning Customers, along with trend graphs, top product insights, and country-level sales breakdowns.
With a centralized date filter controlling key Shopify metrics, you can instantly compare performance periods and make faster decisions without manual analysis.
2. Amazon Seller Orders and Sales Performance Report
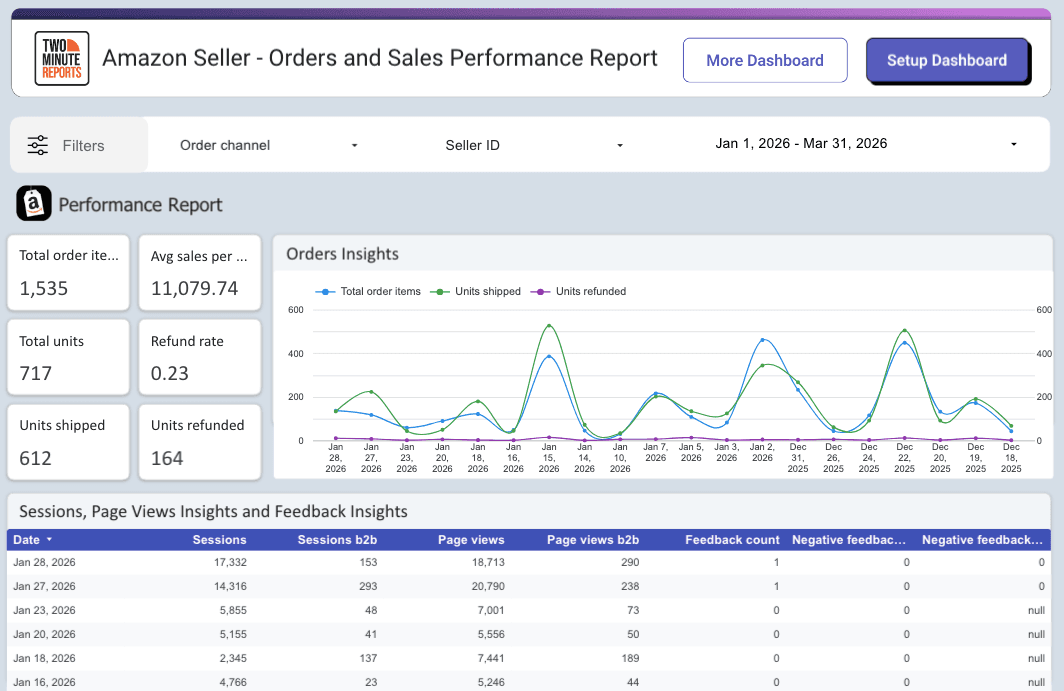
This Amazon Seller reporting template delivers a focused view of your orders and sales performance. It highlights essential KPIs such as total order items, units ordered, shipped, average sales per unit, etc, to help you monitor revenue accuracy and return impact.
Detailed sections for sessions, page views, customer feedback, and device-level insights provide deeper visibility into traffic quality and buying behavior.
3. WooCommerce Product Review and Ratings Report

This WooCommerce reporting template provides a comprehensive view of your product reviews and ratings. It includes scorecards for Overall rating, Review Content, and Verified Reviews, along with a product insights table highlighting price, stock, and review volume using heatmaps for quick analysis.
A dedicated ratings breakdown separates verified and non-verified feedback, helping you monitor credibility, customer sentiment, and opportunities to improve conversion.
Pro Tip: If your ecommerce dashboards slow down as data grows, reporting becomes frustrating. With Two Minute Reports’ exclusive Speedboost technology, your dashboards stay fast, stable, and reliable at scale. Here’s how:
- Load complex dashboards in 5 seconds: Whether you handle 10 or 100 online stores, seamlessly retrieve historical data and deliver blazing fast reports without any delay.
- Avoid broken reports or timeout errors: No more failed data pulls or report crashes. With uninterrupted performance, your reports are always ready for action. Works with Google Sheets and Looker Studio as well.
- No technical setup required: No pipelines, no dev dependencies. Just connect your online store (Shopify, Amazon Seller, WooCommerce) and let Speedboost handle performance optimization automatically.

Faster dashboards mean faster decisions, and faster decisions protect and scale your ecommerce revenue.
Ecommerce Reporting Checklist: Turn Insights into Growth
Use this checklist during every reporting cycle to convert data into action:
- Confirm profit before scaling spend: Compare net revenue against ad spend, refunds, and discounts. Increase the budget only if margins hold.
- Prioritize high-margin spends: Identify SKUs driving profit, not just volume. Shift campaigns towards products that improve contribution.
- Track retention as a core metric: Monitor repeat purchase rate and returning customer share weekly. Weak retention weakens long-term ROI.
- Audit channel efficiency individually: Break down CAC and conversion rate by source. Pause channels that exceed breakeven thresholds.
- Align inventory with demand: Match stock levels with sales velocity. Avoid overstocking slow movers and understocking winners.
- Review trend direction: Compare 30-day, 60-day, and 90-day performance. Sustained movement matters more than short spikes.
Wrapping Up
Ecommerce reporting creates value when it changes how decisions are made. The real shift happens when performance data stops being fragmented across platforms and starts being structured around revenue, cost, customer behavior, and inventory.
The four-step framework you’ve seen isn’t just a setup guide; it’s a reporting system. Here’s how each step directly contributes to measurable improvement:
If you’re ready to gain full control over ecommerce performance, start using a reliable ecommerce reporting software such as Two Minute Reports. Connect stores, build dashboards faster, and uncover profit opportunities in minutes, not hours.
Try Two Minute Reports free for 14 days and see how much faster ecommerce reporting can move your decisions.
Frequently Asked Questions
Ecommerce reporting is the practice of measuring and evaluating performance across all your store operations, including marketing, sales, and customer activity, using consolidated data. It helps standardize how metrics are tracked and interpreted, enabling consistent evaluation of performance over time.
The six different types of ecommerce reports to focus on are: Sales Report, Inventory Report, Order Report, Product Analytics Report, Financial Report, and Customer Report. Each report provides insights into different aspects of your ecommerce performance.
To create your ecommerce report, just follow these simple steps: install the Two Minute Reports add-on from Google Workspace Marketplace, connect your ecommerce platforms, choose metrics that align with your client's goals, customize your dashboard to display the relevant data, and automate the reporting process for real-time insights.
Native dashboards show isolated performance within each platform. An ecommerce reporting tool standardizes metrics, centralizes store performance across multiple clients, and automates reporting workflows. If you’re evaluating different ecommerce reporting tools, it's important to compare integrations, dashboard customization, automation, cost, and scalability before choosing one.
Related Blogs


Meet the Author
Shalini MuruganShalini is driven by ideas that create a tangible impact. At Two Minute Reports, she specializes in content that helps marketers optimize their reporting workflows. When she's not transforming complex data into meaningful insights, you might find her lost in a book, jotting down ideas in her notebook, or connecting the dots others overlook.
