Summarize this blog post with:
In a nutshell: Creating a winning ecommerce strategy requires knowing which Shopify metrics reflect the effectiveness of your business’s goals. Whether it is sales, acquisition, customer behavior or measuring order volume, analyzing critical Shopify metrics tells you the complete story, and what to do next, giving you a clear perspective. While this is the first half, the rest explains four important factors that enhance your Shopify store performance. Integrating both approaches lays the benchmark for strengthening your online ecommerce business.
Imagine if your Shopify analytics report is cluttered with countless metrics listed after one another without adding any value. Your performance review meeting will be at stake, leaving you juggling explanations without a clear direction for progress.
To avoid this chaos, you must know which Shopify KPIs reflect your store's performance. When clients review your Shopify store report, every ecommerce metric should tell a story, highlighting successes, showcasing what strategies worked, and identifying areas that need improvement to achieve maximum ROI.
So how do you get started? What essential Shopify metrics should you track as an ecommerce marketer?
In this blog, we’ll explore the 13 must-track Shopify metrics you should focus on to improve your business’s profitability. We’ll also share four practical strategies that help you navigate your Shopify store performance and enhance efficiency.
Ready to dive in? Let’s get started.
What are Shopify Metrics?
Shopify metrics are essential indicators for measuring your ecommerce store’s performance. From analyzing best-selling products to sales and monitoring customer preferences, every ecommerce metric delivers actionable insights and informs you of potential growth opportunities.
At the core of every ecommerce marketer’s toolkit is their Shopify Analytics dashboard, which tracks vital ecommerce metrics and KPIs. You’ll get a detailed overview of your store’s recent activity, customer behavior, profit margins, inventory updates, sales trends, etc., to make informed business decisions and optimize ROI.
 Image Source: Shopify Analytics
From the Shopify analytics dashboard, you can perform the following activities:
- Analyze and compare the value of your recent orders with past store data.
- Compare the performance of your sales channels.
- Track the average order value and monitor trends.
- Understand where your customers are coming from - whether social media or any specific location.
The Shopify Analytics dashboard is best suited for delivering a comprehensive overview of your store's performance. However, it becomes complex to customize when you want to manage multiple Shopify clients for your agency.
Now that you know the functionalities of the Shopify Analytics dashboard, the following section explains the key Shopify metrics that contribute to enhancing your ecommerce store’s sales and revenue.
Top 13 Shopify Metrics to Track
In this section, I’ve classified the important Shopify metrics based on the four categories below:
- Sales
- Acquisition
- Customer
- Behavior
Sales
Shopify sales metrics denote the profitability of your ecommerce store, providing insights into product purchasing value and revenue earned.
1. Average order value (AOV)
What it is: The average amount each customer spends buying from your Shopify store.
How is it calculated: AOV = (Total revenue/Total number of orders)
Suppose your total sales in October were $21,000, and you had a total of 1000 orders. Your October month’s AOV will be $21; i.e., each customer spent an average of $21 when they placed an order.
Why it matters: The Shopify average order value gives profound insights into your customer’s spending behavior and lets you align pricing strategies accordingly. You can increase AOV through targeted upselling, cross-selling, and offering discounts or gift certificates, encouraging customers to purchase more products.
Optimizing for AOV is crucial as it impacts every sales funnel stage. Whether you want to incentivize new store visitors or increase the purchasing value of existing customers, AOV plays a significant role in reflecting your store’s overall customer experience.
However, pay more attention during seasonal sales, new product launches, and campaign promotions, as these changes significantly impact AOV. Analyze the patterns and optimize pricing at the right time to boost profits.
Pro Tip: Don’t try to be too sales-y. Your customers shouldn’t feel like they are business when you upsell or cross-sell. Instead, offer genuine recommendations that add value based on their purchasing behavior, much like a trusted advisor.
2. Sales conversion rate
What it is: The percentage of visitors who make a purchase. The sales conversion rate, also known as the ecommerce conversion rate, shows how effective your strategies are in transforming potential customers into actual buyers.
How is it calculated: Sales conversion rate = (Total number of conversions/total number of visitors) x 100
For example, if your Shopify store had 1000 visitors and out of which 50 customers made the purchase, your sales conversion rate will be $5, i.e., 5% of visitors to your Shopify store made a purchase.
Why it matters: This Shopify KPI is crucial to steering your online ecommerce business toward increasing profits. A higher sales conversion rate indicates that you are deeply inclined toward customer’s buying preferences. On the contrary, a lower sales conversion rate points to critical elements that should be fixed before they sink your profits.
To maximize your Shopify store’s sales, evaluate how customers act at each conversion funnel stage—top, middle, and bottom. This will give you transparency into what’s happening at every level, why customers drop off, and how to fix them—a great chance to convert interested leads into paying customers.
A good sales conversion rate ranges between 2.5% and 3%. This might vary depending on your niche, but 2.5% can be the ideal benchmark for getting started.
Pro Tip: Monitor the sales conversion rate closely when running a marketing campaign or implementing a new sales process. The results will tell you how the campaign impacts or inspires your customers to take action.
3. Sales by channel, traffic source and variant SKU
Let’s look at these 3 important Shopify metrics and how they contribute to measuring online store performance.
| Shopify Metric | Description | Usage |
| Sales by channel | Displays the total sales value attributed to each of your active sales channels. | Allocate practical resources for higher performing channels and cut down on those that don’t contribute a penny. |
| Sales by traffic source | Displays the total sales generated from each traffic source: email, social, direct, and search. | Understand the influential sources customers use to reach you and optimize your growth strategy accordingly.
|
| Sales by variant SKU | Displays the net sales for the best-selling product variants, including the variant name and SKU. | Gain insights into customer preferences, analyze trends, understand which products perform better, and tailor pricing strategies accordingly. |
4. Top selling products
What it is: Displays the top-selling products with the most individual units sold, including all the sales channels.
Why it matters: Understanding which products contribute the highest sales gives a plethora of insights. You can streamline inventory, optimize marketing strategies, and enhance the customer purchasing experience. Besides, you can recommend these products to first-time buyers or run retargeting campaigns on social media to attract like-minded audiences.
Acquisition
Let you measure which sources drive target customers to your Shopify store.
5. Online store sessions
What it is: Displays your online store's total number of sessions. This Shopify metric applies to your Online Store channel only.
Why it matters: This Shopify metric indicates your store's engagement. You can measure the number of sessions on your online store within the specified date range and view the number of visitors. A unique visitor might have more than one session.
For instance, customer A visited your online store one time, customer B visited three times, and customer C visited five times. So there are 9 total sessions, along with three unique visitors.
However, having higher online store sessions doesn't guarantee high conversions. Simply put, if your customers stay longer without taking action, it becomes trivial. On the contrary, even if you get fewer sessions and those contribute to successful goal completion, it is considered effective. So, map your sessions to key goals appropriately.
6. Sessions by device type, location, traffic source and social source
Let's view the breakdown of sessions based on the different sources customers use to reach your Shopify store.
| Shopify Metric | Description | Usage |
| Sessions by device type | Displays the number of sessions and what devices(mobile, desktop, or tablet) customers use to access your Shopify store. | Knowing what devices customers mostly use can improve their shopping experience, leading to higher conversions. |
| Sessions by location | Displays the number of sessions on your Shopify store based on country. | This gives you insights into where your customers come from, allowing you to tailor your product positioning, sales, pricing, and marketing strategy. |
| Sessions from social source | Displays the number of sessions originating from different social media platforms. | If you promote aggressively on all social platforms, it doesn’t make sense. Your content should reach the right people at the right time on their preferred platform. |
| Sessions by traffic source | Displays the number of sessions on your Shopify store based on how visitors accessed your online store–direct, social, paid, email, etc. | Understanding which channels contribute the highest traffic lets you focus on the better side of the marketing aspects. |
7. Top landing pages by sessions
What it is: Displays the specific landing pages on which your Shopify store visitors started their sessions. A landing page is determined by the first URL the visitor viewed in a unique session, which typically ends after 30 minutes of inactivity and at midnight UTC.
Why it matters: This Shopify metric lets you optimize the most viewed landing pages by modifying headlines or tweaking CTAs for higher conversion rates. Further, you can identify and revamp the underperforming landing pages with the least engagement so your revenue doesn’t slip through the cracks.
Pro Tip:
- Include only the necessary elements on your landing page — one ideal message, one offer, and one call to action.
- Make it responsive such that it looks uncluttered on any device.
- Use high-quality product images and videos to capture the attention.
- Showcase customer testimonials and reviews to win the trust.
Customer
Customer metrics give you insights about first-time and returning customers who purchase in your Shopify store.
8. Customer Lifetime Value (CLV)
What it is: Customer Lifetime Value represents the total revenue generated from a single customer. Simply, it signifies the customer’s long-term relationship with your business and how it translates into revenue.
How is it calculated: CLV = (Average Purchase Value x Purchase Frequency) x Average Customer Lifespan.
Say you run a stationery business. If the average purchase value for an ink pen is $10 and your customers tend to purchase 10 times in a year and buy ink pens from you for 5 years, then the CLV will be 10 x 10 x 5, which is $500; i.e., on average, each customer will spend $500 at your stationery shop over the time, giving you an idea of how valuable each customer is to your business.
Why it matters: An increase in CLV indicates that you have loyal customers, whereas a lower CLV clearly states that you’re chasing the herd, which is insignificant. Also, your CAC costs tend to fluctuate based on the CLV, indicating how efficiently you focus on the right customers who can drive repeat purchases and revenue.
CLV also gives you a clear picture of which products customers spend the most on, helping you maximize your overall bottom line. So, to achieve high CLV, focus on aligning your product’s pricing strategy with the customer’s interests. With personalized merchandising, you can create tailored shopping experiences that keep customers engaged and coming back for more, boosting CLV.
Pro tip: Personalize customer experiences by showing what they truly need. Leverage analytics to understand customers’ behavior and shopping intent and tailor offers accordingly to encourage repeat purchases, leading to high CLV.
9. Customers over time (first time vs returning)
What it is: Refers to the customers (first-time vs returning) who purchased in your Shopify store.
Why it matters: Analyzing which group of customers tends to shop more can have a significant impact on your acquisition and retention strategy.
If the first-time customers have high purchasing value, your acquisition efforts have paid off. However, that doesn’t mean you can overlook the returning customers. Though this Shopify metric depends on each business’s overall objective, I recommend having an ideal focus on both customer groups to tailor the right pricing and sales strategy.
10. Returning customer rate
What it is: The percentage of customers who placed more than one order in your Shopify store. It is also called the repeat customer rate.
How is it calculated: Returning customer rate = (Returning customers/total number of customers) x 100
Let’s consider you run an online clothing store. Your business has served 200 customers, 50 of whom made repeat purchases, i.e., 25% of the customers are returning customers, indicating customer loyalty and satisfaction.
Why it is important: Accomplishing higher repeat purchases signals you’re doing a fantastic job. However, it is crucial to constantly check your repeat customers' shopping trends and spending patterns. Even if there is a slight decline, deep-dive to the roots, understand why it happened, and refine the changes accordingly.
 Image Source: Shopify Blog
Though acquiring new customers is vital for expansion, capitalizing on existing customers is one the smartest ways to maximize profits quickly. Repeat customers tend to have a high CLV rate, so connecting the right dots lets you focus on the bigger picture.
Behavior
Behavior metrics let you understand the customer’s shopping trends, including how they impact conversion.
11. Bounce rate
What it is: Percentage of customers who left your Shopify store without taking any desired action, such as completing the purchase.
Why it matters: Your Shopify store's bounce rate is crucial to its health. A high bounce rate signals an alarming threat to the overall user experience. Key reasons (but not limited to) include navigation issues, slow page loading, cluttered product listings, confusing page layout, poor content quality, asking for too much information, broken links, and low-quality images.
Ensure your Shopify store is thoroughly optimized for the above elements to reduce the bounce rate. Customers who land on your ecommerce site must know what you’re selling without switching multiple pages—an intuitive flow delivers an enhanced experience.
12. Top online store searches
What it is: The top search terms your customers use to search for a product.
Why it matters: This is a goldmine as you’ll get real-time insights on different terms customers use to find their preferred product. You can improve your Shopify site SEO and attract the right customers by optimizing for the relevant keywords. Also, you can understand which products get the highest number of searches, analyze shopping trends, and run sales promotions to boost profits.
13. Shopping cart abandonment rate
What it is: The percentage of customers who add their products to the shopping cart but don't make the purchase.
How is it calculated: Shopping cart abandonment rate = (Total number of completed purchases/total number of carts created) x 100
Suppose your Shopify store had 1000 shopping carts per month. Out of those, 200 shopping carts resulted in purchases. Only 20% of shopping carts created were converted into purchases, and the remaining 80% were abandoned, highlighting the need to fix potential issues to optimize the conversion flow.
Why it matters: As an ecommerce business owner, dealing with shopping cart abandonment is a never-ending task. It might be due to several reasons, such as high shipping costs, a lack of multiple payment options, poor checkout, slow product delivery, a lack of discounts/coupons, website issues, etc.
 Image Source: Baymard Institute
The above statistic lists the critical reasons why customers typically abandon their carts. To create a smooth purchasing experience, send them timely reminder emails, optimize checkout, provide discounts, be transparent, offer flexible payment options, etc.
While cart abandonment is inevitable, aiming for a minimal rate can improve your store’s profits. The average cart abandonment rate is just under 70.19%.
Four crucial factors to consider when optimizing your Shopify store performance
In this section, let’s look at the four crucial factors you must consider when optimizing your Shopify store’s performance.
1. Improve your website speed
Do you know that 64% of mobile users expect a website to finish loading within four seconds, whereas 47% of online shoppers expect the website to load within two seconds?
That’s where your Shopify website speed plays a significant role—for every delayed page load, you’ll lose thousands of dollars. Ouch.
The following 4 main factors for Shopify stores seriously affect the website performance. Here’s how you can fix them:
| Problem | Solution |
| Online store themes slow down your site performance. | Use an optimized online store 2.0 Shopify theme, as they are natively optimized for web performance. Look for lightweight third-party web themes that load faster on the web. |
| Number of apps installed. | The more apps you install, the clunkier your Shopify store will be. Include only those apps that potentially add value and boost your profits. |
| Additional third-party code manually installed. | Perform regular tag manager audits to remove unused or low-value tags. |
| Having huge product variant counts. | Load only key variants first. Display additional variants when customers interact with more options. Also, compress the variant images to the ideal size to reduce load times. |
You might also encounter additional speed issues, but the above factors are the most critical problems that can make or break your Shopify store. You can also use Google’s PageSpeed Insights to instantly perform speed checks and fix critical issues.
Pro Tip: To enhance delivery speed, ensure you include all your assets, including images, through Shopify’s Content Delivery Network.
2. Track key Shopify metrics in one place
One of the major drawbacks of Shopify Analytics is limited customization—every time, you have to rearrange the metric cards in the dashboard and install additional apps if you want to generate advanced reports. This pain soars if you have to customize metrics for multiple clients.

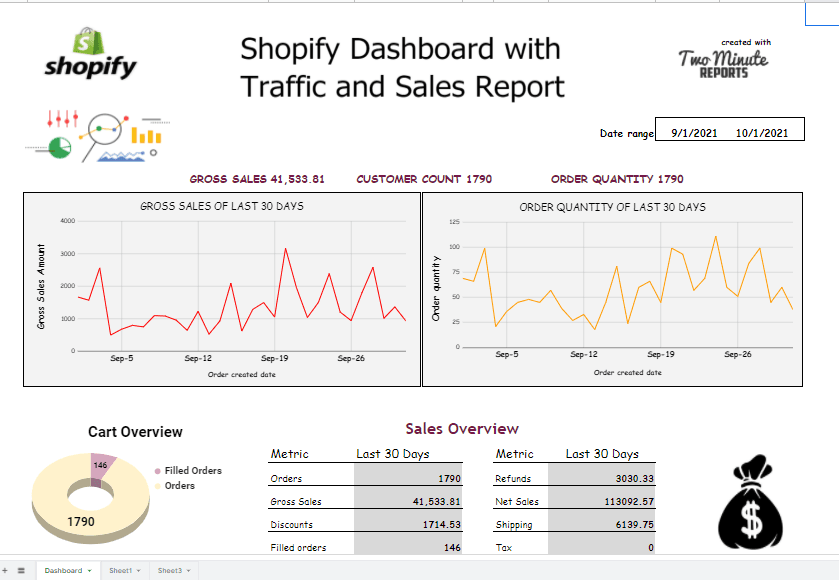
Here, you can integrate the Two Minute Reports' Shopify reporting add-on within minutes to your Google Sheets or Looker Studio. You can connect multiple Shopify clients’ accounts, instantly fetch real-time ecommerce metrics and KPIs, and build customized client reports with pre-built Shopify templates.
As your Shopify store grows, you’ll be dealing with huge amounts of data, which greatly affects the processing speed. With TMR’s Shopify reporting add-on, you can 10x boost the performance as it periodically caches updated data, making critical information accessible at your fingertips.
You can then focus on the bigger picture, know what works and what doesn’t, and maximize your clients' ROI.
3. Minimize redirects
Minimize the use of redirects, as they lead to extra page loading times. For example, if you have created an exclusive product page for an ongoing discount in your Shopify store, once the sale ends, you might want to remove it and redirect customers to a different URL.
This is where you need to be cautious. You can redirect from “https://www.shopifystore.com/discounts” to “https://www.shopifystore.com/pricing” so that customers who land on the discount page will be redirected to the pricing page.
When you structure the redirects in an optimum manner, it improves your Shopify store SEO.
But when you set up too many redirects, customers will get confused, leading to a poor user experience. Moreover, crawling will also take time, badly affecting your organic rankings.
The best practice would be to carefully use redirects only at necessary times, as they are vital in impacting your customer journey.
4. Use the recommended image and video formats
As customers use different devices to shop, your product images should be responsive to capture their attention. Here’s how you can upload properly formatted images and videos with precise dimensions as mentioned below:
| Media Type | Recommended Size | Recommended File Type |
| Product images | Can be any size up to 5000 x 5000 px or 25 megapixels. File size should be less than 20MB. | PNG, JPEG, PSD, TIFF, BMP, GIF, SVG, HEIC, and WebP |
| 3D Models | File size up to 500MB. Your 3D models get automatically optimized if they exceed 15 MB. | GLB, USDZ |
| Videos | The recommended length is up to 10 minutes, and the preferred size is up to 1 GB. The supported resolution is 4096 x 2160 px. | .mp4 or .mov |
Ensure you adopt these best practices to make your product assets look responsive in any device type. While you may focus on attractive visuals, you should also be mindful of how they can impact your Shopify store’s performance.
Conclusion
As an ecommerce store owner, the art of improving ROI lies in effectively tracking key Shopify metrics, which signal the heartbeat of your ecommerce business.
Every Shopify metric that you visualize tells a narrative. However, the real impact lies in the key metrics that plot an interesting story in your client’s ecommerce report. Fortunately, the Shopify metrics and KPIs mentioned above help you achieve that by delivering actionable data stories that matter.
The bottom line?
Analyze what’s happening in your Shopify store, map critical changes to the relevant Shopify metrics, extract meaningful takeaways, and implement them immediately — you’ll eventually find your path to success.
Repeat, re-iterate, and refine your approach.
Frequently Asked Questions
You need to map your actual business goals with the relevant ecommerce metrics and KPIs to measure success correctly. Ensure that you track the KPIs regularly to make timely adjustments, which plays a key role in optimizing your store’s profitability.
The Conversion rate is considered the most important metric in analyzing the effectiveness of an ecommerce website. It reflects how well site visitors convert into paying customers and how the key elements in your store contribute to a flawless customer experience.
From your Shopify admin, navigate to Shopify Analytics. By default, you can view your store’s data today compared to yesterday. You can also track the valuable Shopify KPIs arranged as cards in the dashboard. If the card has a “view report” icon, click on it for more details. However, not all metrics will have an associated report.
From your Shopify admin, go to Analytics > Reports. Next, click “Categories” and filter the relevant options to choose your desired report type. For example, if you want to view order reports, click “orders” to display only the order reports.
The Shopify average conversion rate is 1.4%. If your conversion rate is below 0.5%, you have to revamp your marketing and sales strategy, whereas if it's above 3.3%, you are in the safe spot, likely in the top 20% of all Shopify stores.


