Summarize this blog post with:
Connecting Facebook Ads to Looker Studio is quick and straightforward. Whether you use the Two Minute Reports’ Facebook Ads connector or the ready-made templates, both options are designed to be user-friendly. Here’s a quick overview:
1. Go to the Two Minute Reports Hub.
2. Select Two Minute Reports for Looker Studio.
3. Choose your method to connect:
- Method 1: Select the Facebook Ads connector, link your ad accounts, and analyze your campaign performance.
- Method 2: For a faster setup, you can select a pre-built Facebook Ads template. Your data will be auto-populated, serving you fresh insights instantly.
4. Finally, you can customize your Facebook Ads dashboard to easily share key insights with your team and stakeholders.
With that said, let's begin with the first method.
Method 1: Connect Facebook Ads to Looker Studio using Two Minute Reports
Step 1: Creating a Connection
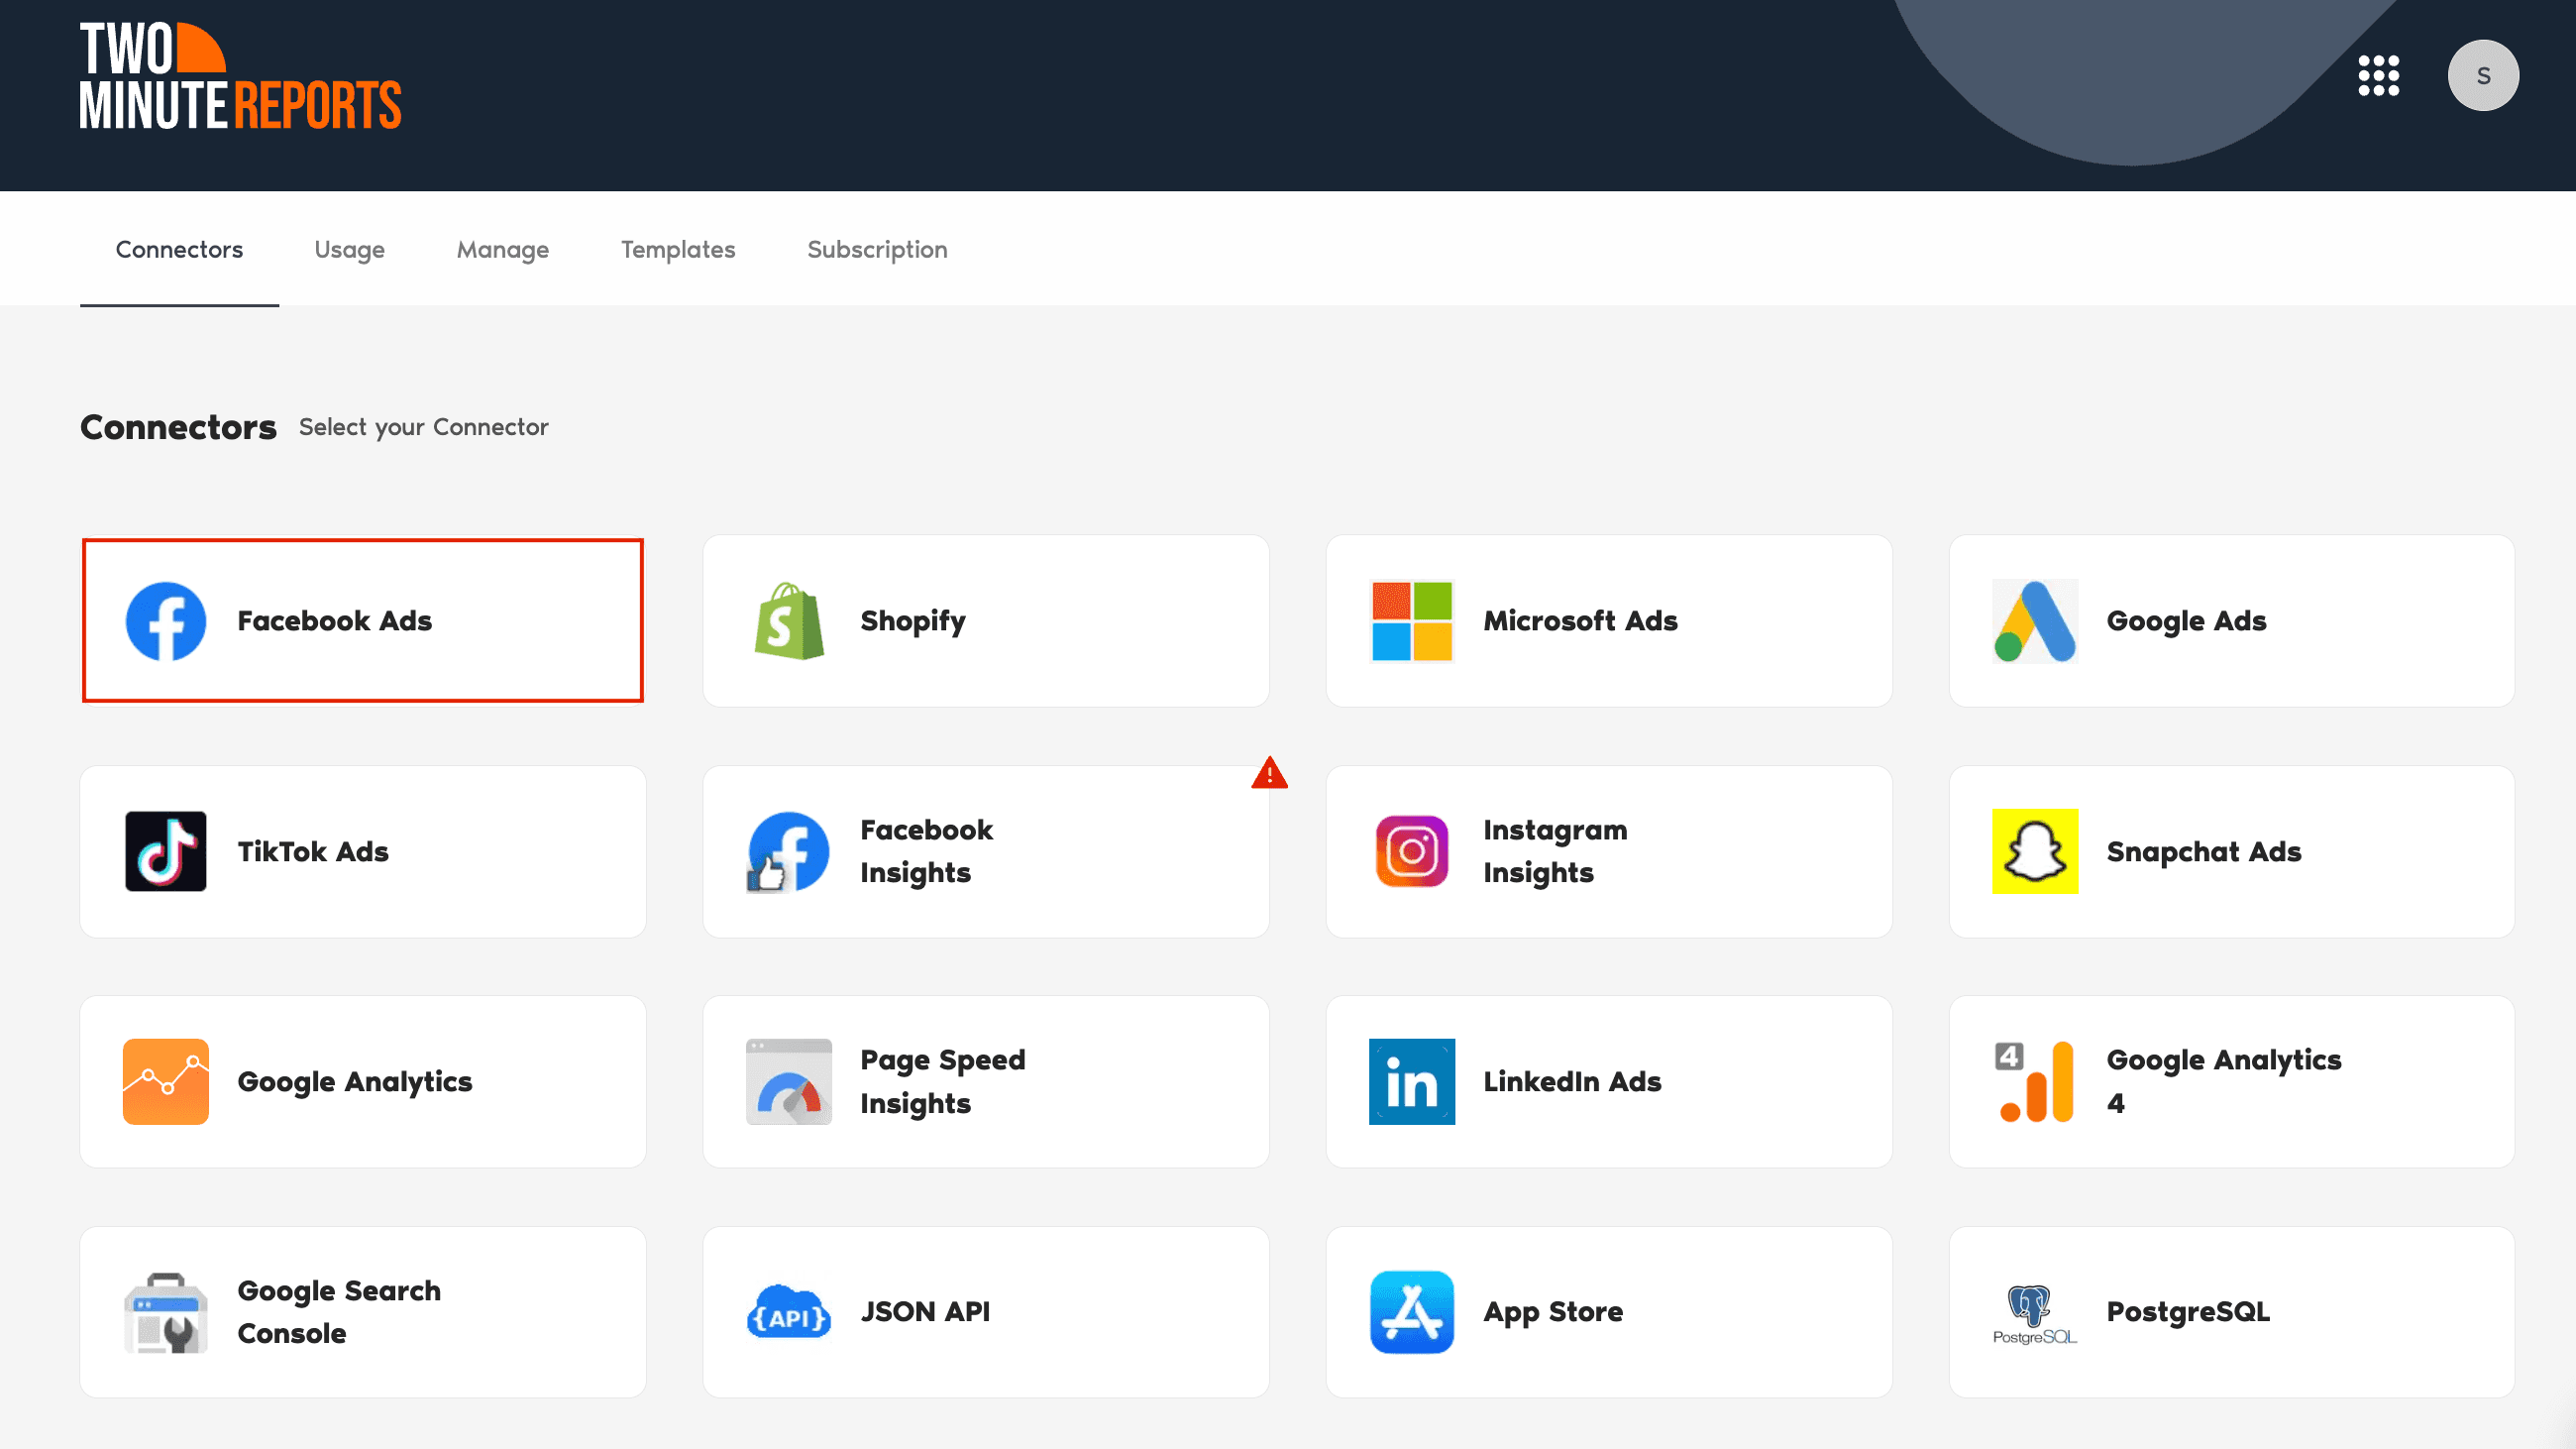
- Once you’ve logged into the Two Minute Reports hub, select the Facebook Ads connector as shown below:

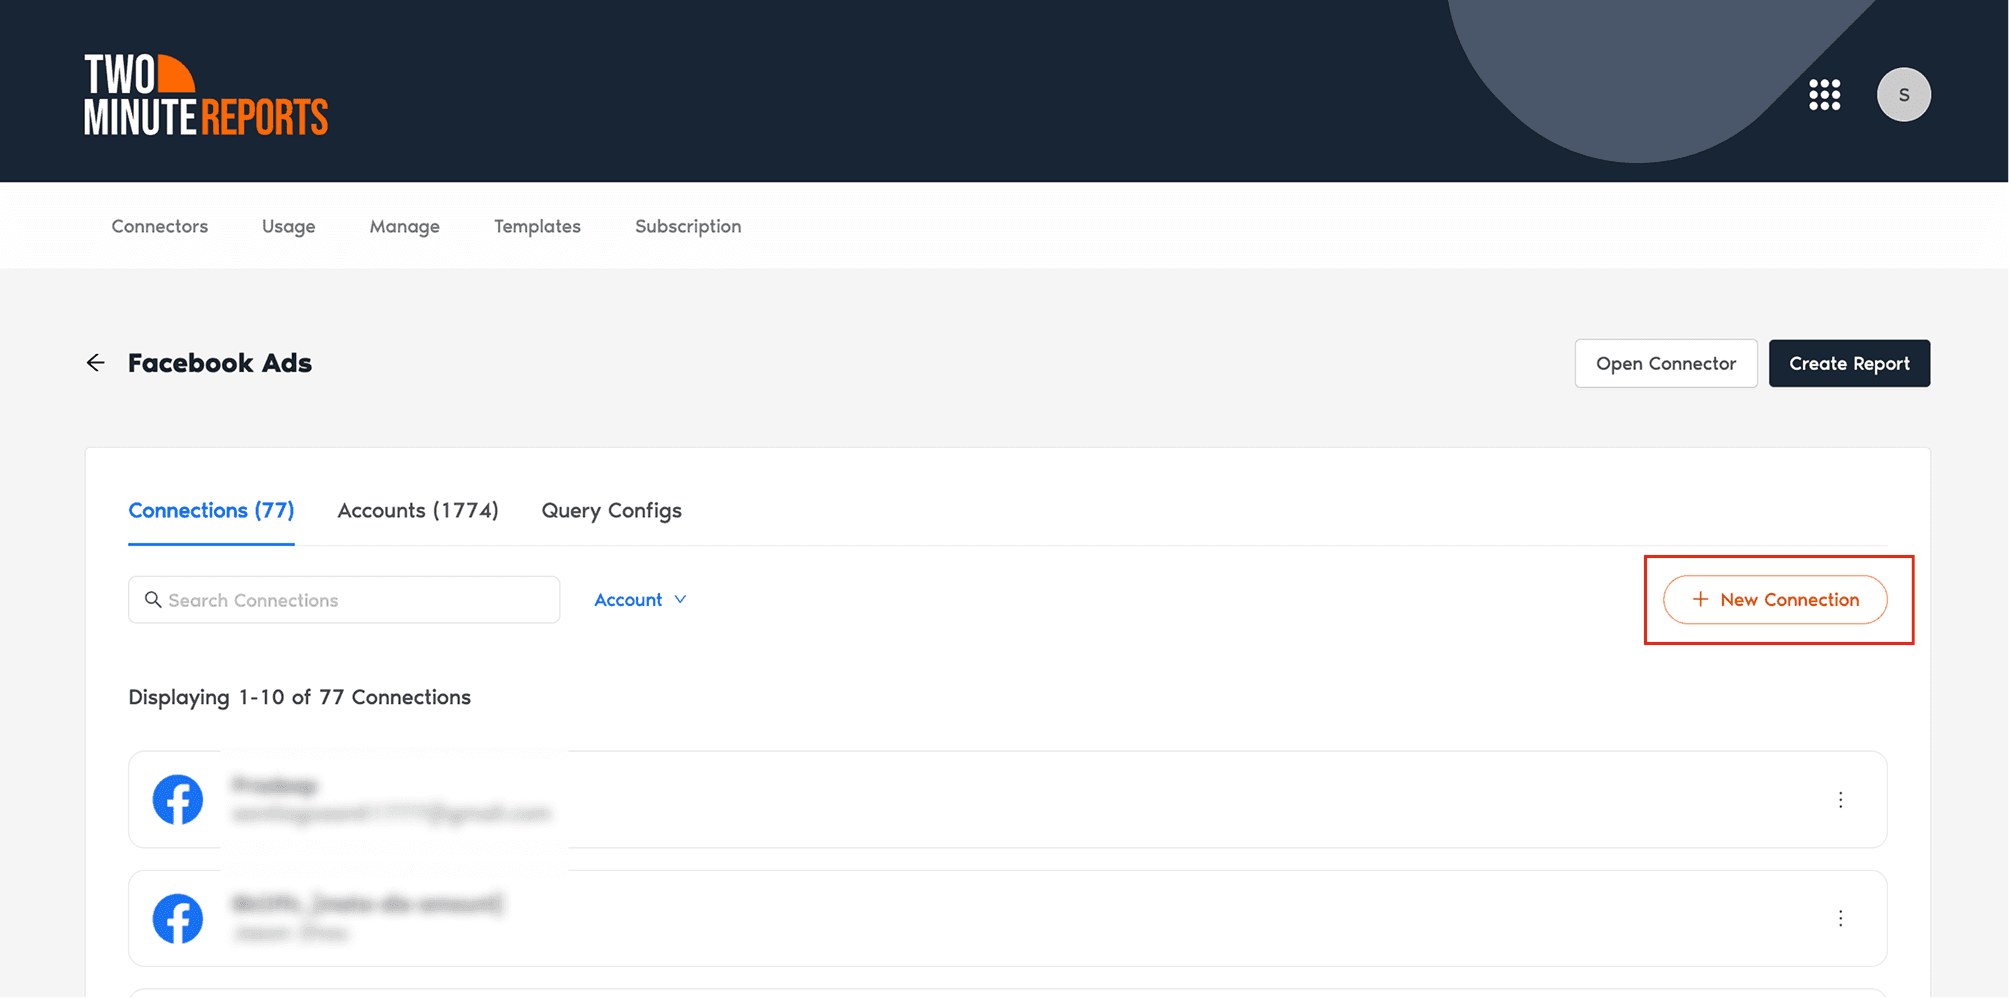
- The next step is to create a Connection. Click New Connection to authorize your Facebook Ads account with Two Minute Reports.

- Once you’ve authenticated, enable the desired Facebook Ads accounts as shown below. Note that you cannot extract data from the disabled accounts.

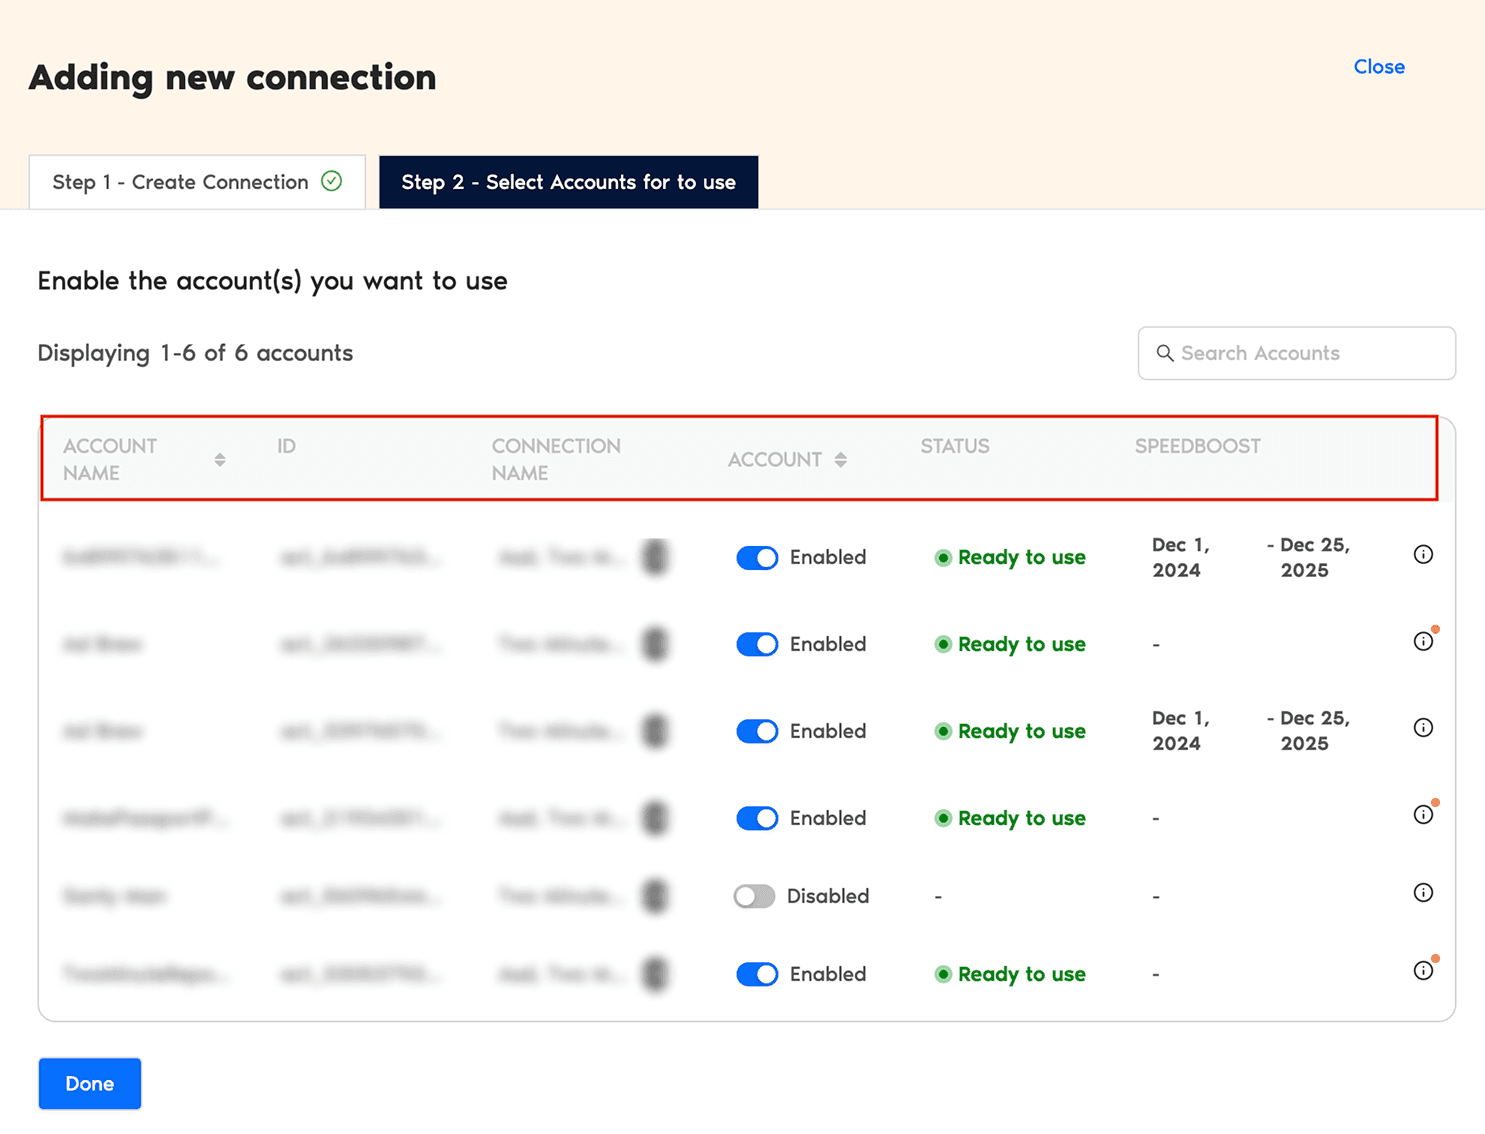
- Click Done. Now you’ve successfully connected your Facebook Ads account to Looker Studio.
Note: Speedboost is our proprietary technology, which helps in loading your Facebook Ads dashboards in under 3 to 5 seconds. Through smart caching, you can retrieve large volumes of campaign data and deliver blazing-fast reports to clients without any delay.
The “Ready to Use” status indicates that your data is available for use from the specified date range.
Next, we’ll configure the Facebook Ads accounts with Two Minute Reports.
Step 2: Configuring your Facebook Ads account with Two Minute Reports
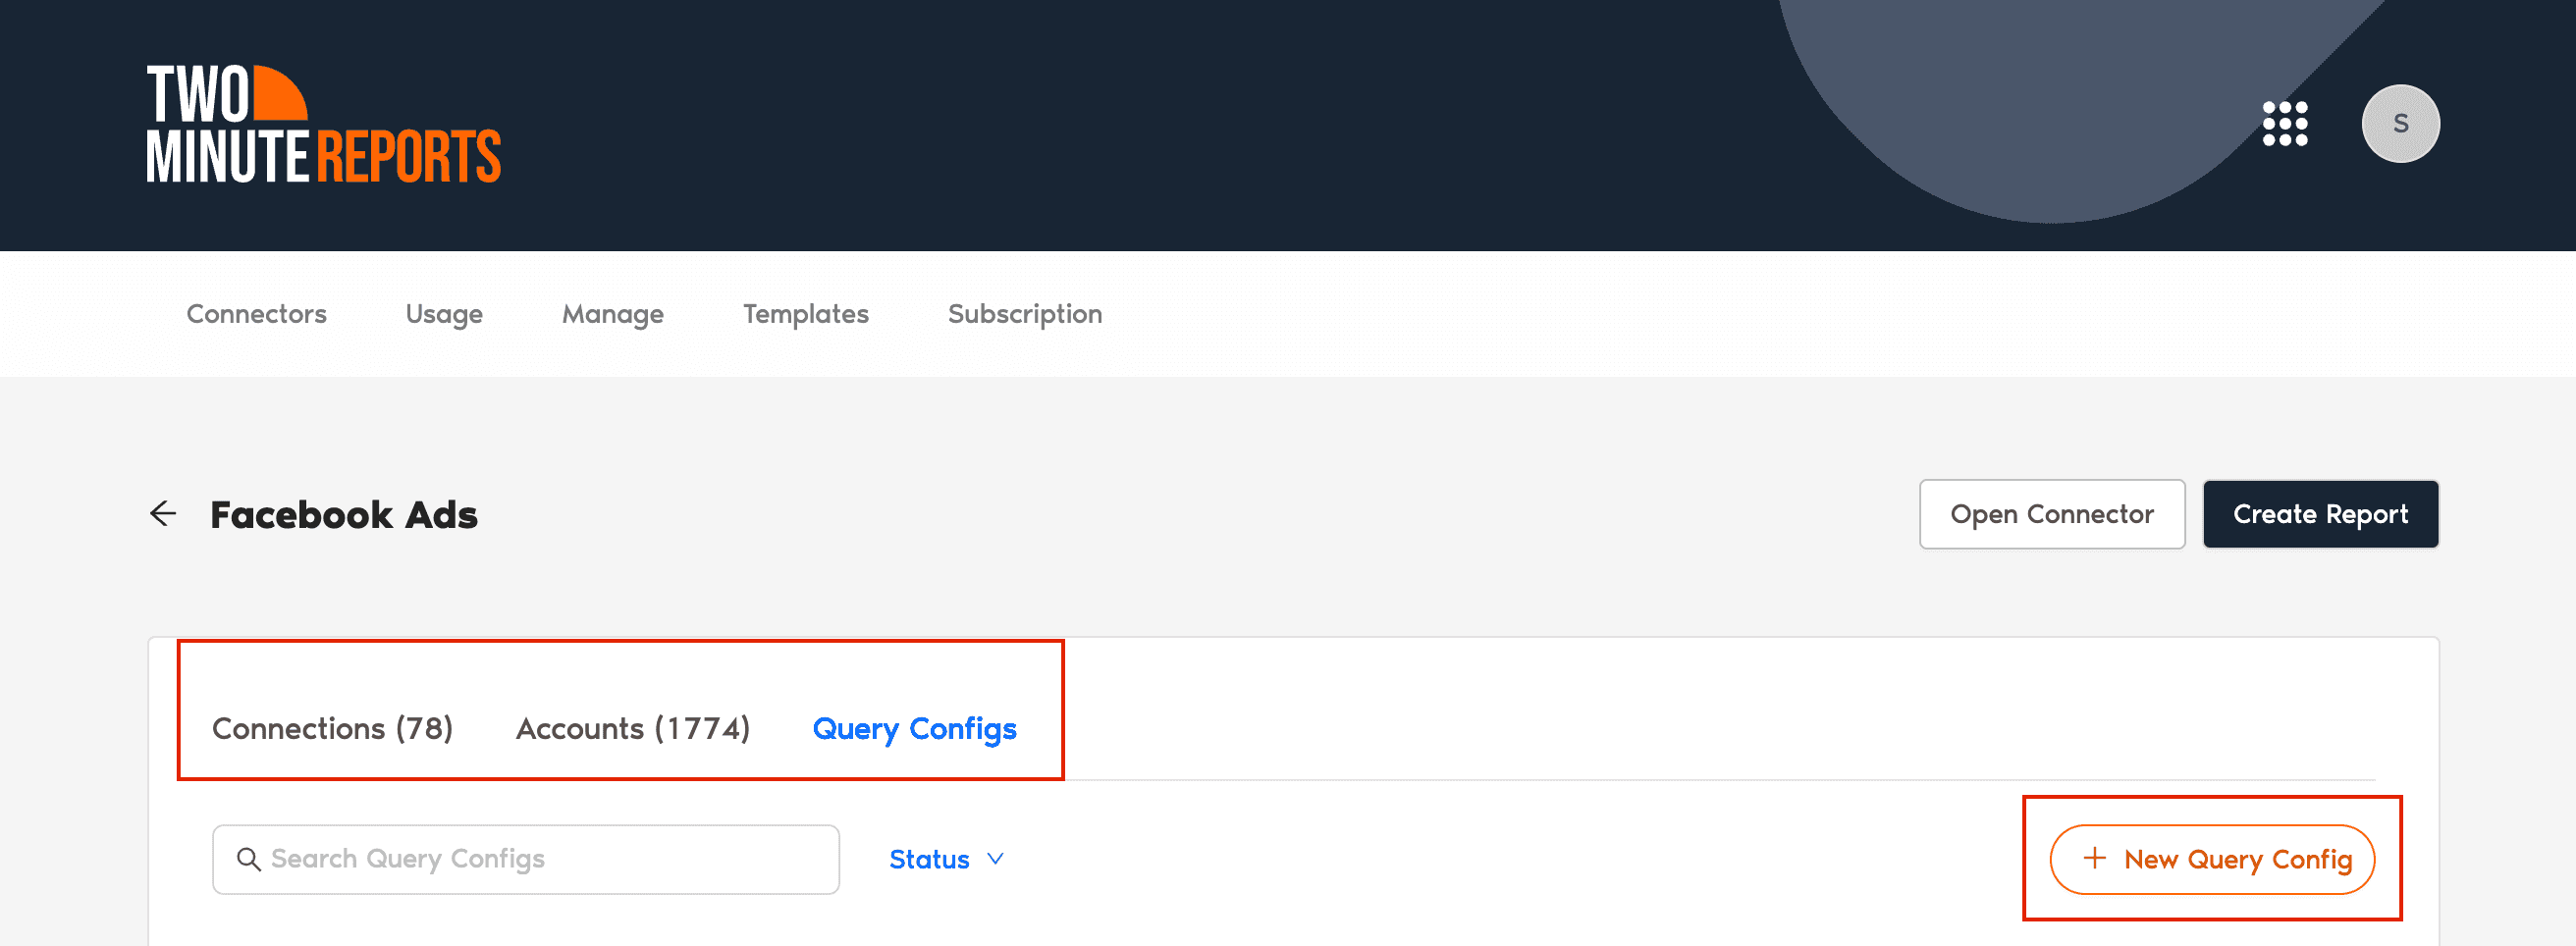
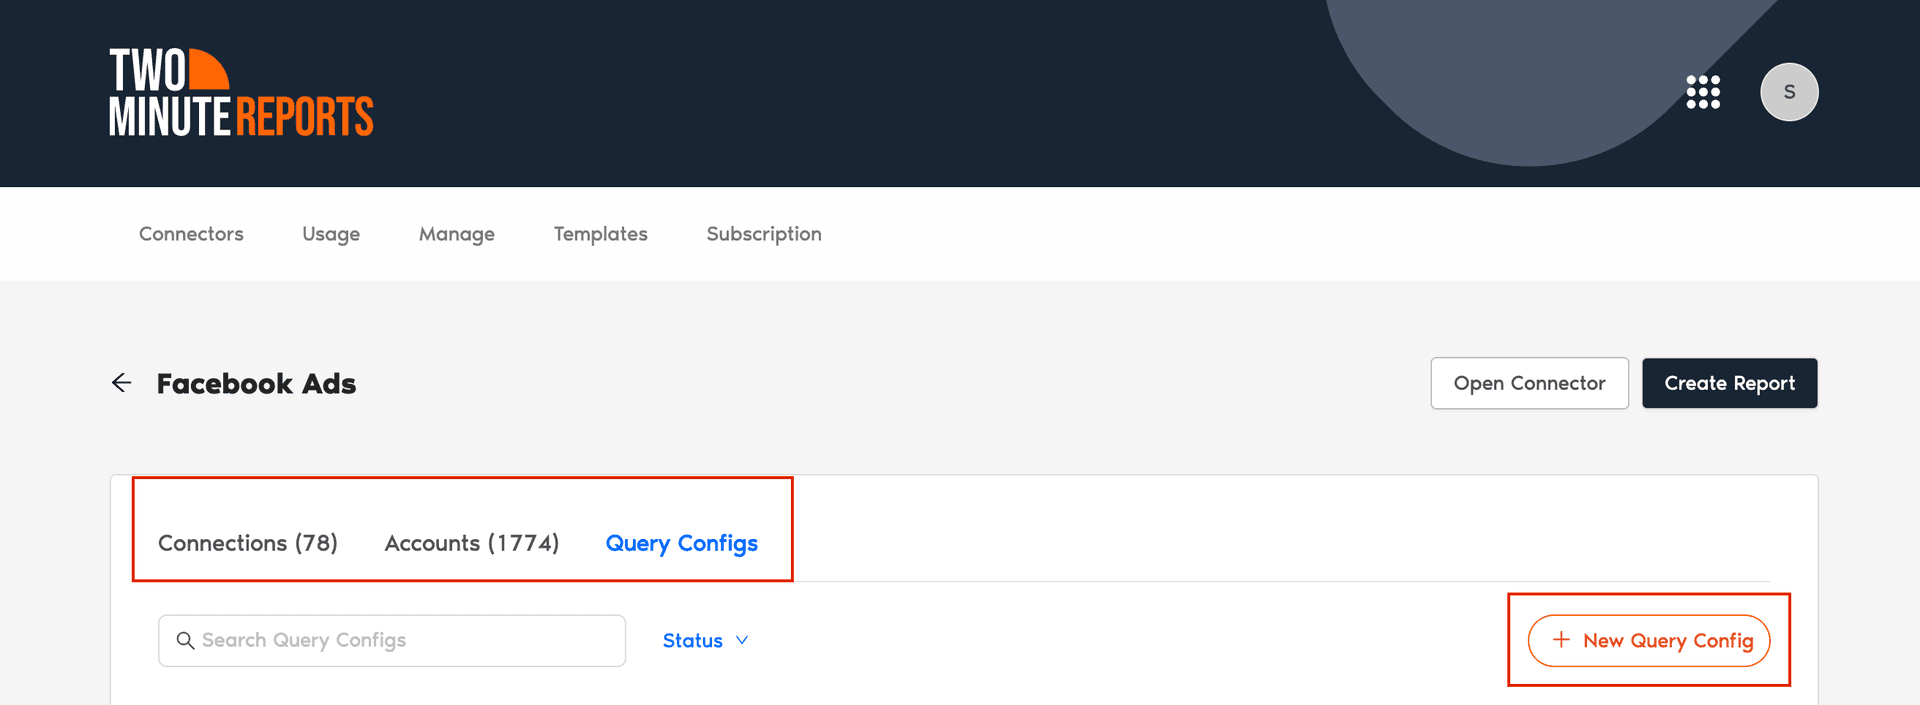
- In the Query Configs section, click + New Query Config.
Note: Query Config allows you to group multiple accounts, making it easier to access centralized insights in your Looker Studio dashboard.
- The “Adding New Query Configuration” dialog box appears. Specify the name, choose the list of Facebook Ads accounts and set up your conversion/attribution window. Once done, click Save.

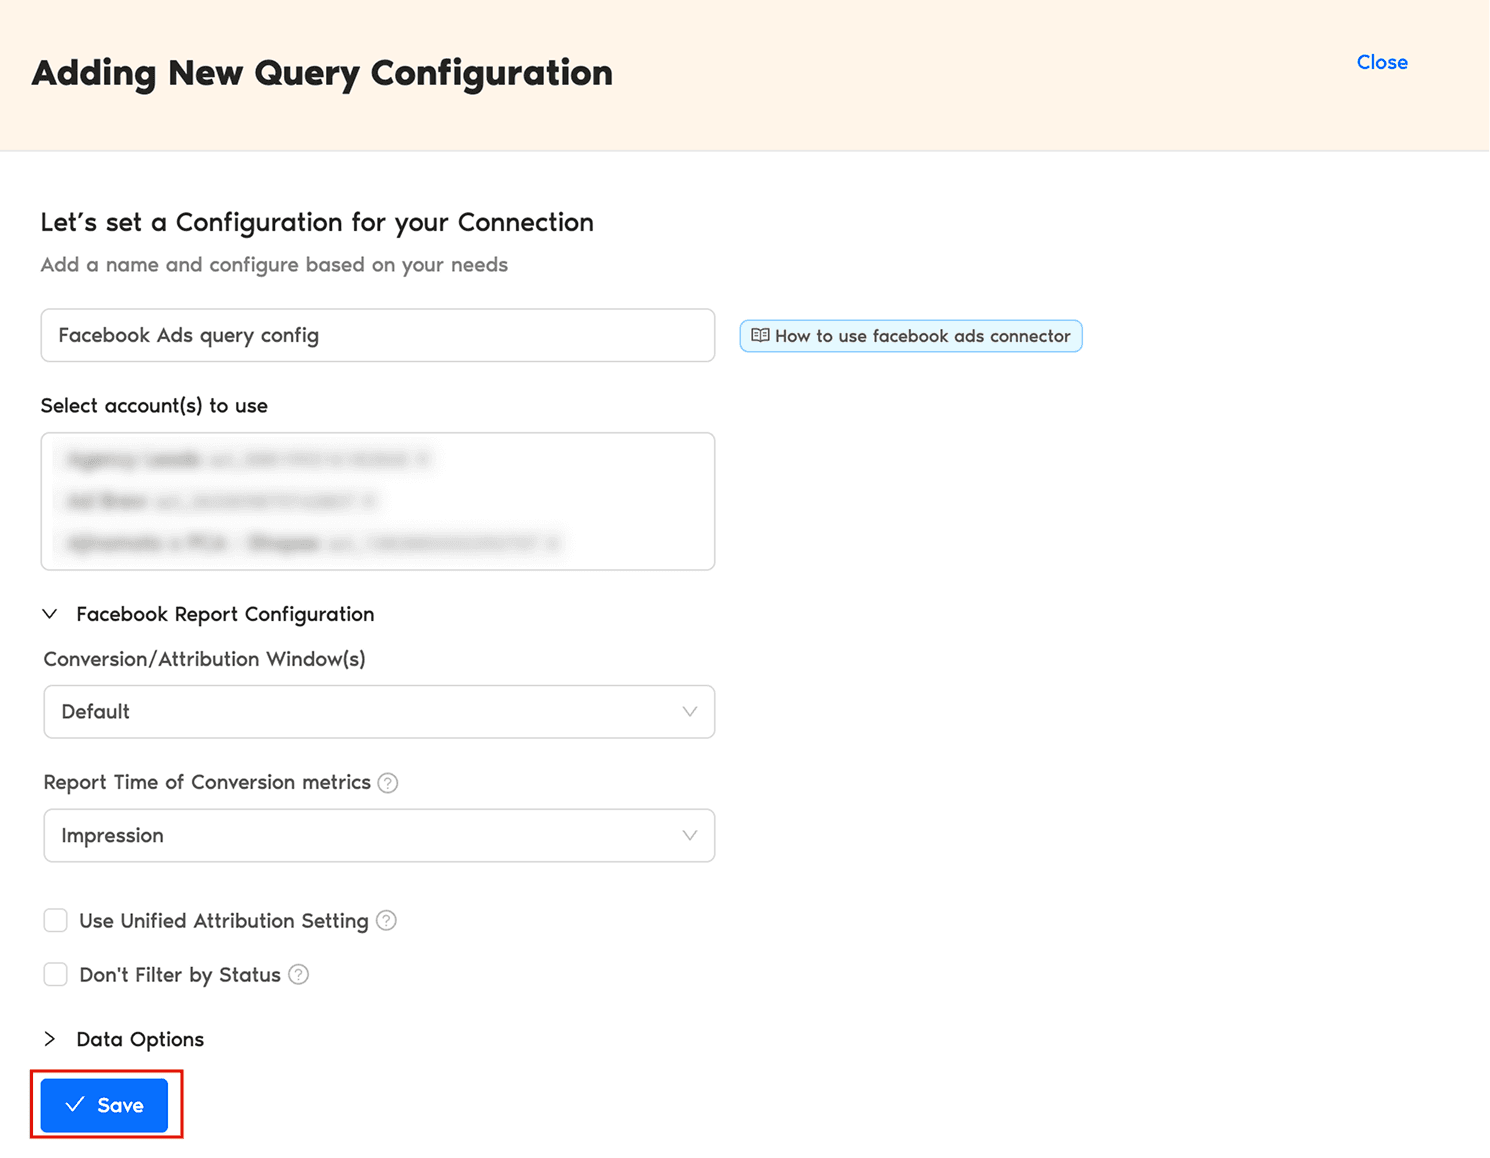
- You’ve successfully created the new configuration. Now you can use this Query Config to pull your Facebook Ads data directly into Looker Studio.
Step 3: Create your Facebook Ads report in Looker Studio
- After creating your Query Config, click Create Report at the top-right corner.


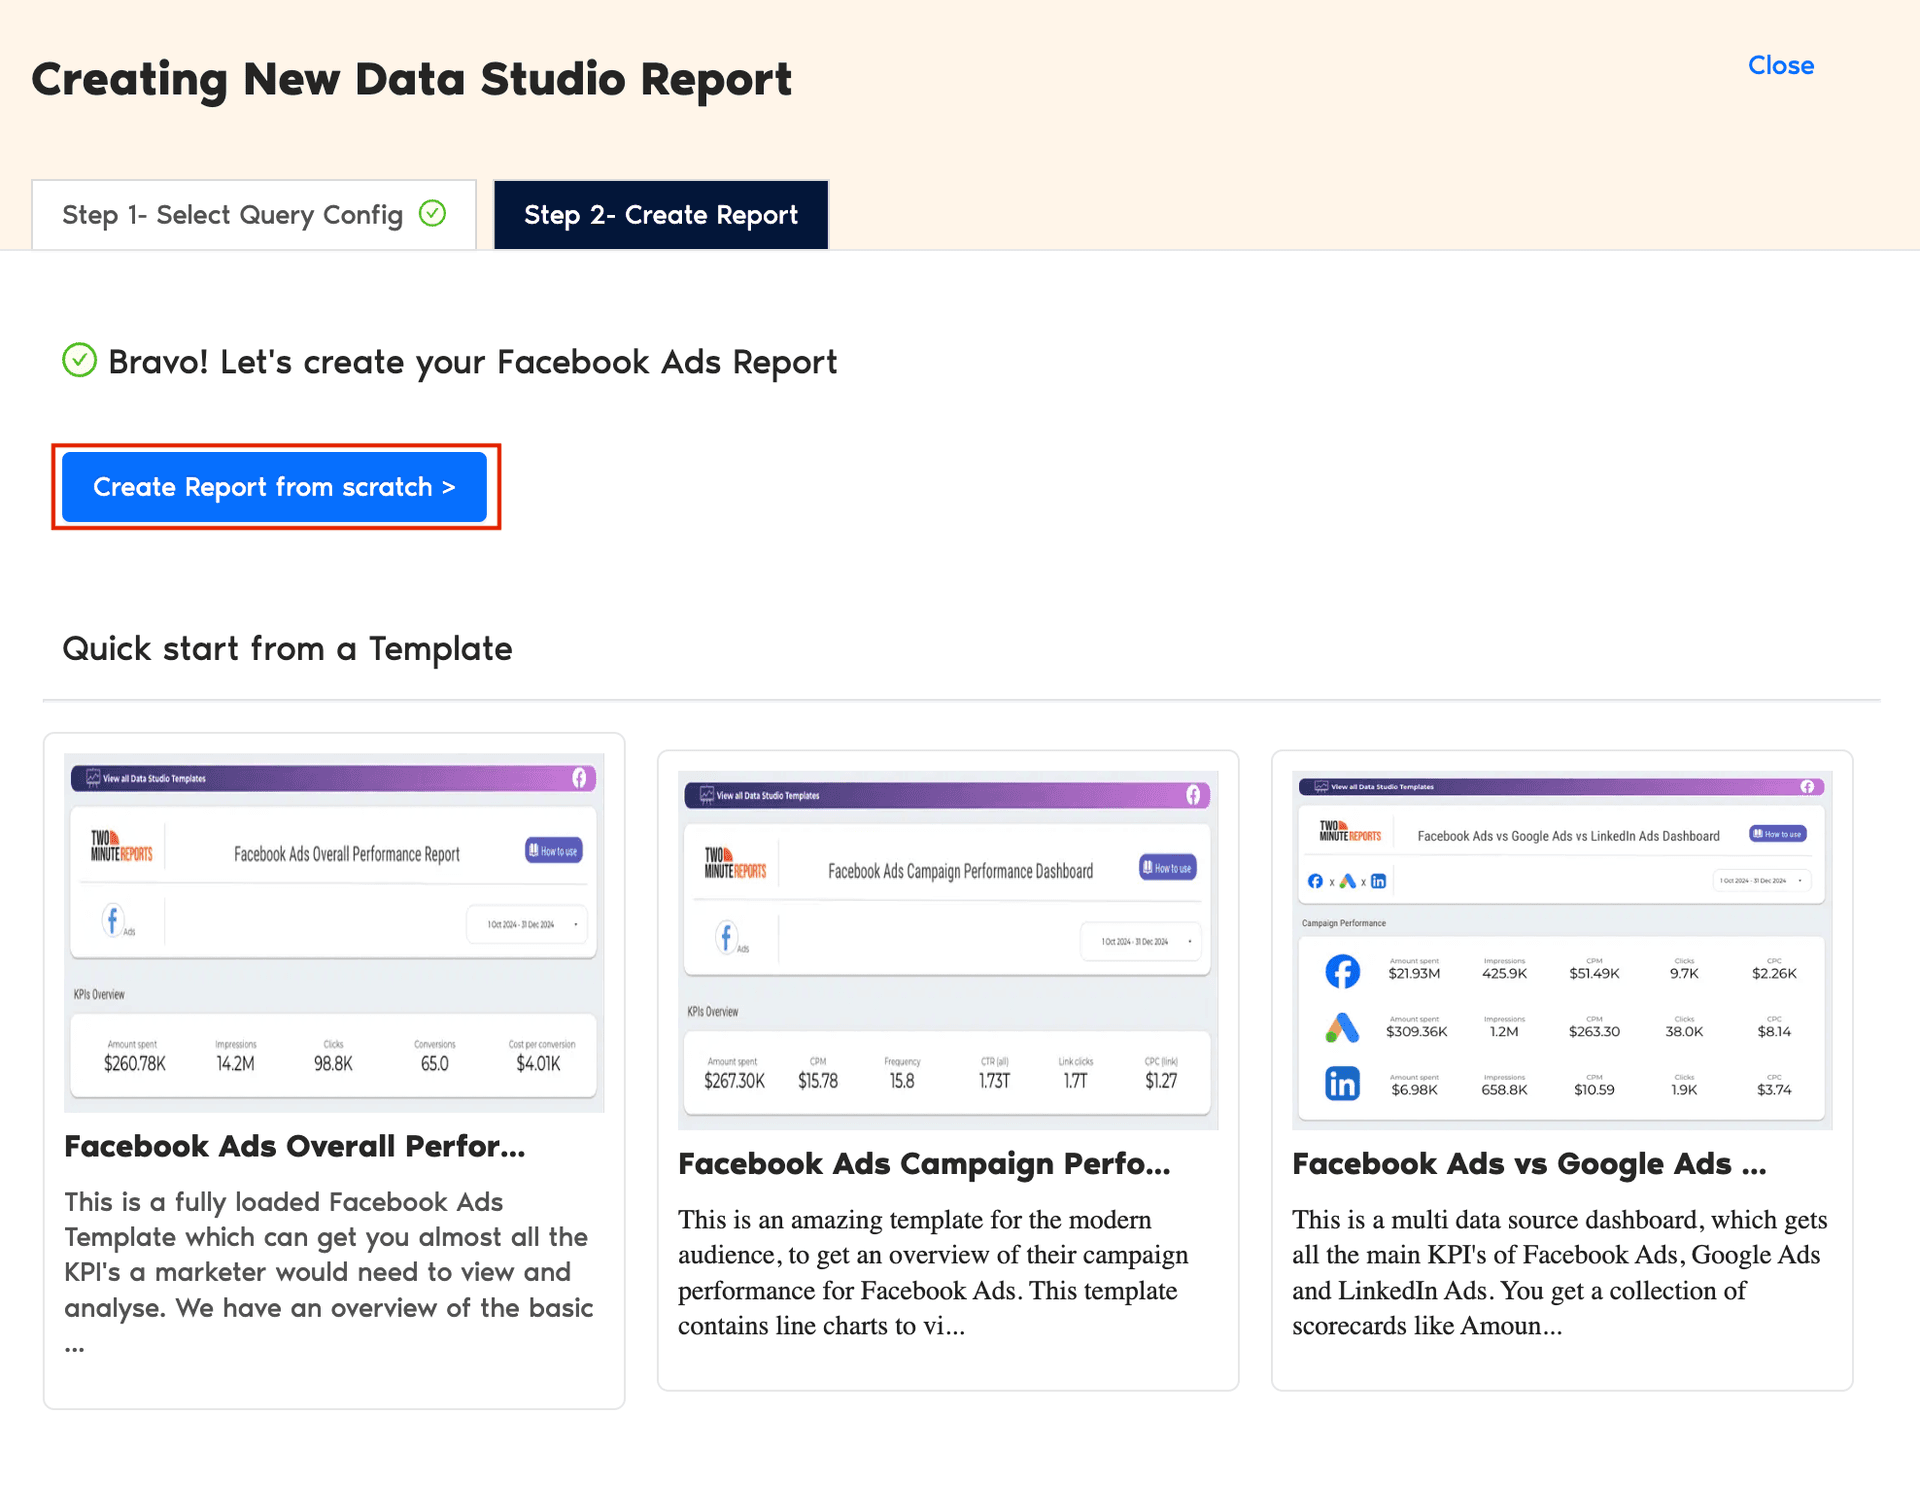
- Select the Query Config which we’ve created in the previous step - ‘Facebook Ads Query Config’. Click Next and choose ‘Create Report from scratch’ to open your Looker Studio dashboard.

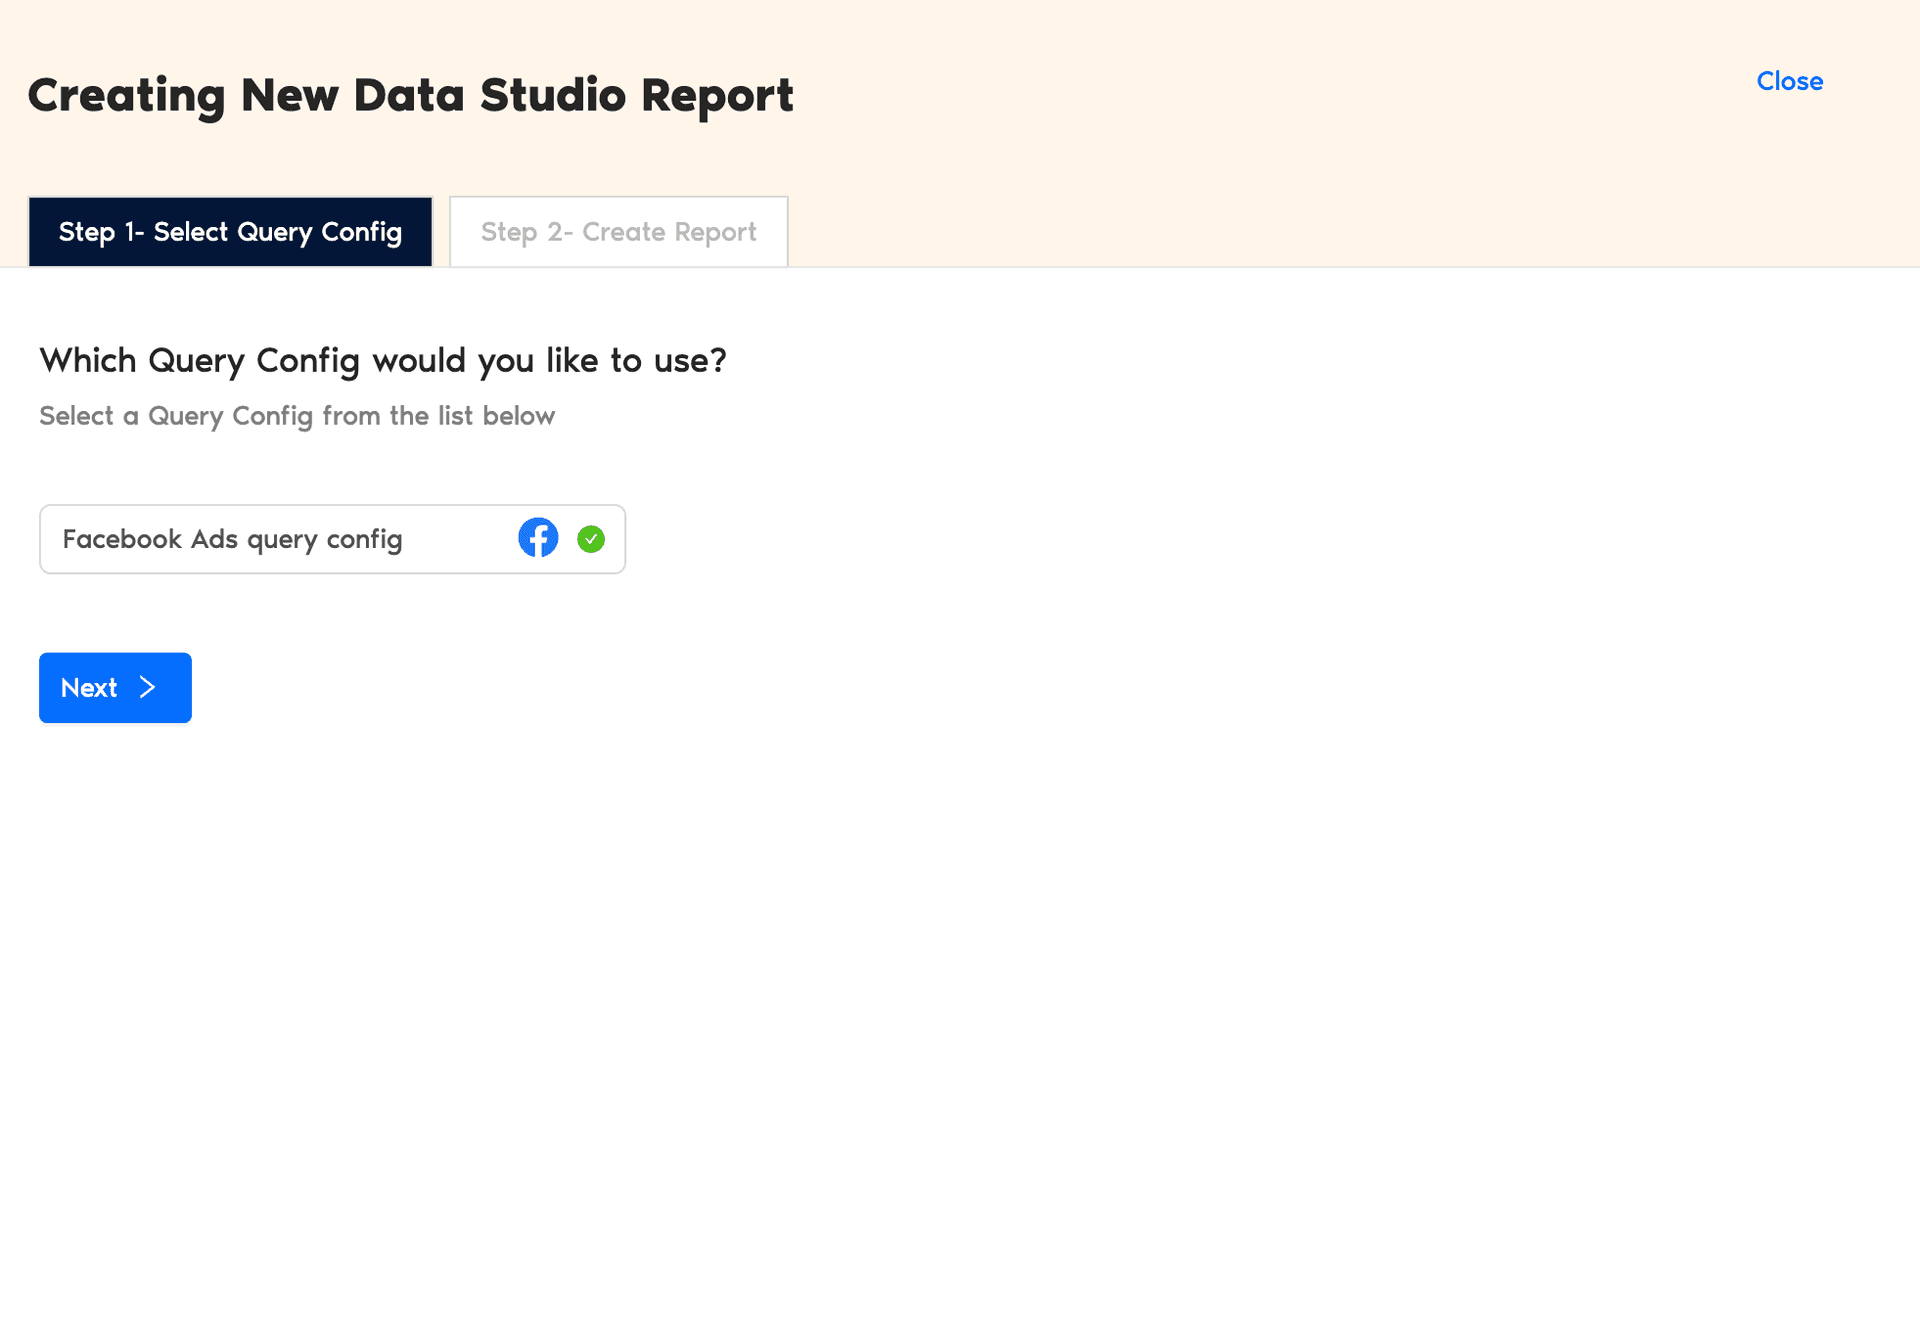

Note: You can also create Facebook Ads reports using pre-built templates. We’ll be exploring in the Method 2 section.
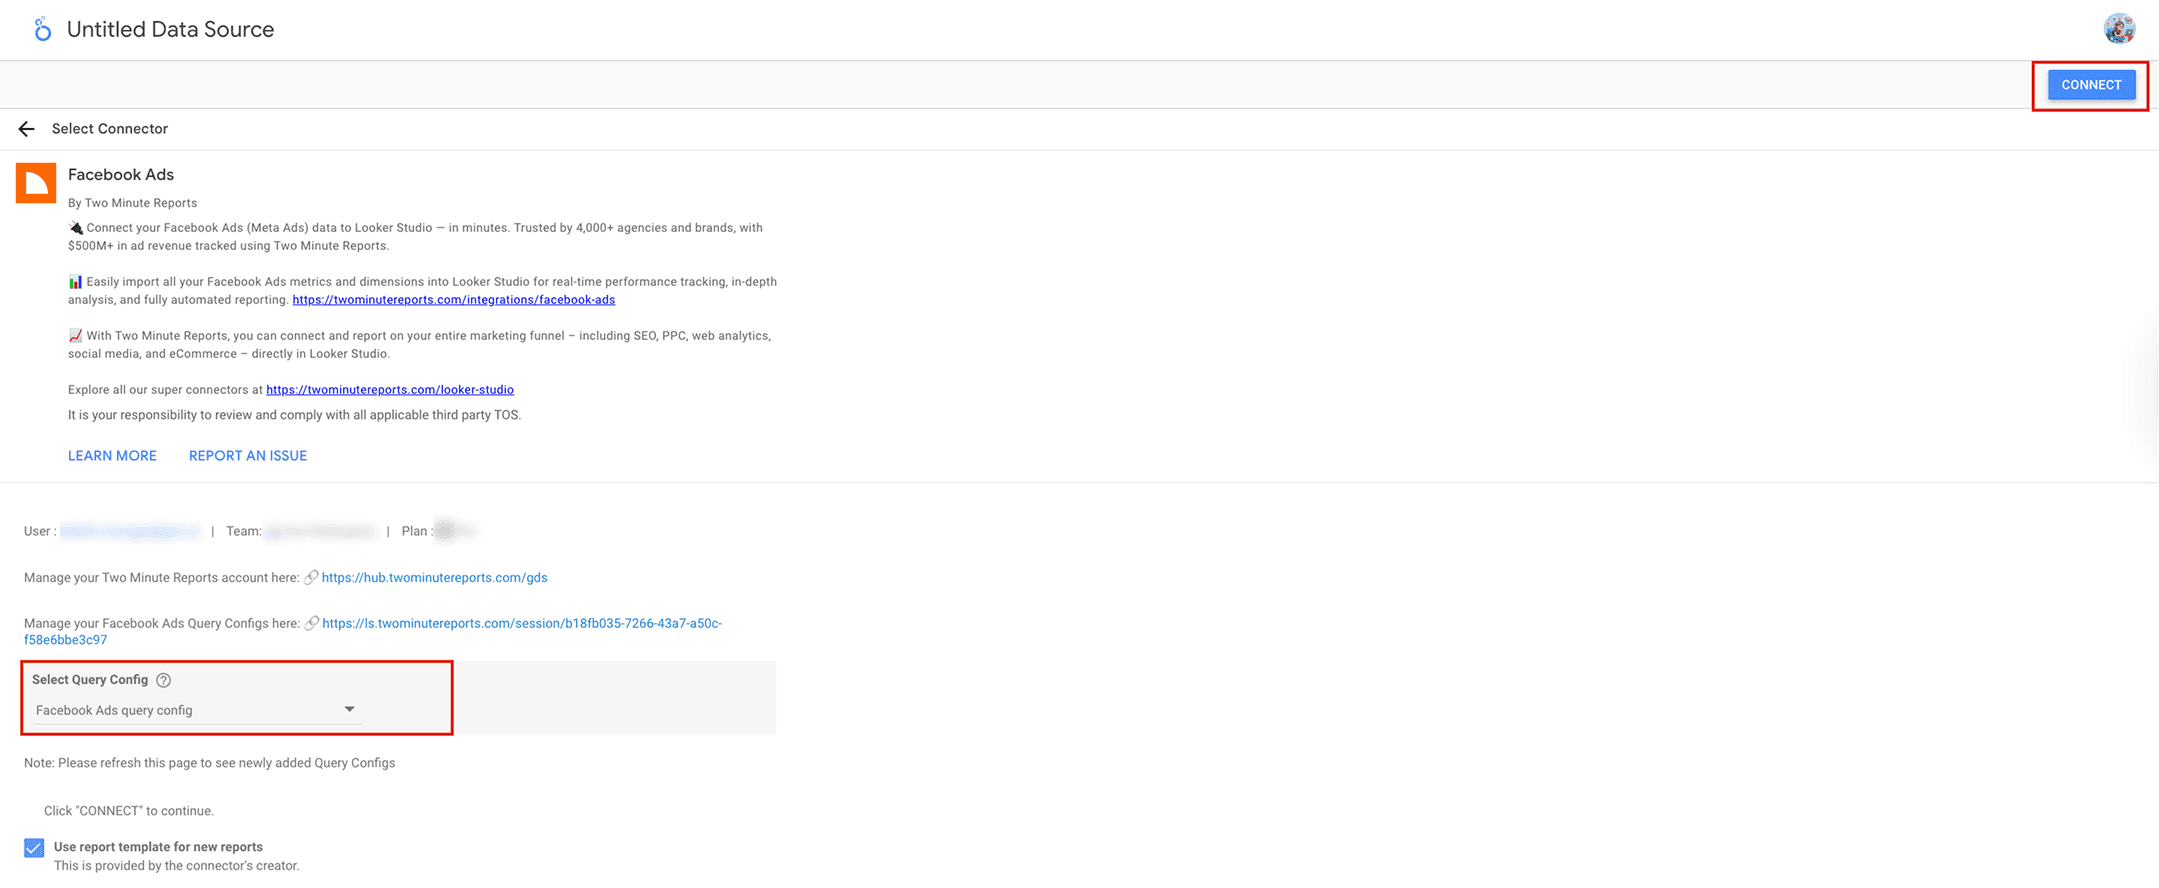
- Once the Looker Studio dashboard opens, select your Query Config from the dropdown menu and click Connect at the top-right corner.

- Add or remove Facebook ads metrics and dimensions. Once done, click Create Report to navigate to the Looker Studio dashboard.
- Next, you can drag and drop the associated KPIs and visualize actionable campaign insights within seconds.
And that’s it. You can add engaging elements such as charts, graphs, etc to make your dashboard visually appealing and relevant. You can also include a date-range control to measure campaign performance for any specific period.
Method 2: Connecting Facebook Ads to Looker Studio using pre-built templates
With Two Minute Reports’ Facebook Ads templates for Looker Studio, you can easily customize and deliver white-label Looker Studio dashboards without manual effort. Here’s how:
- Pick your desired Facebook Ads template for Looker Studio and click Use Template.
- Click “Use my own data” and select your Facebook Ads Query Config (which we have created from Step 2 (method 1)).
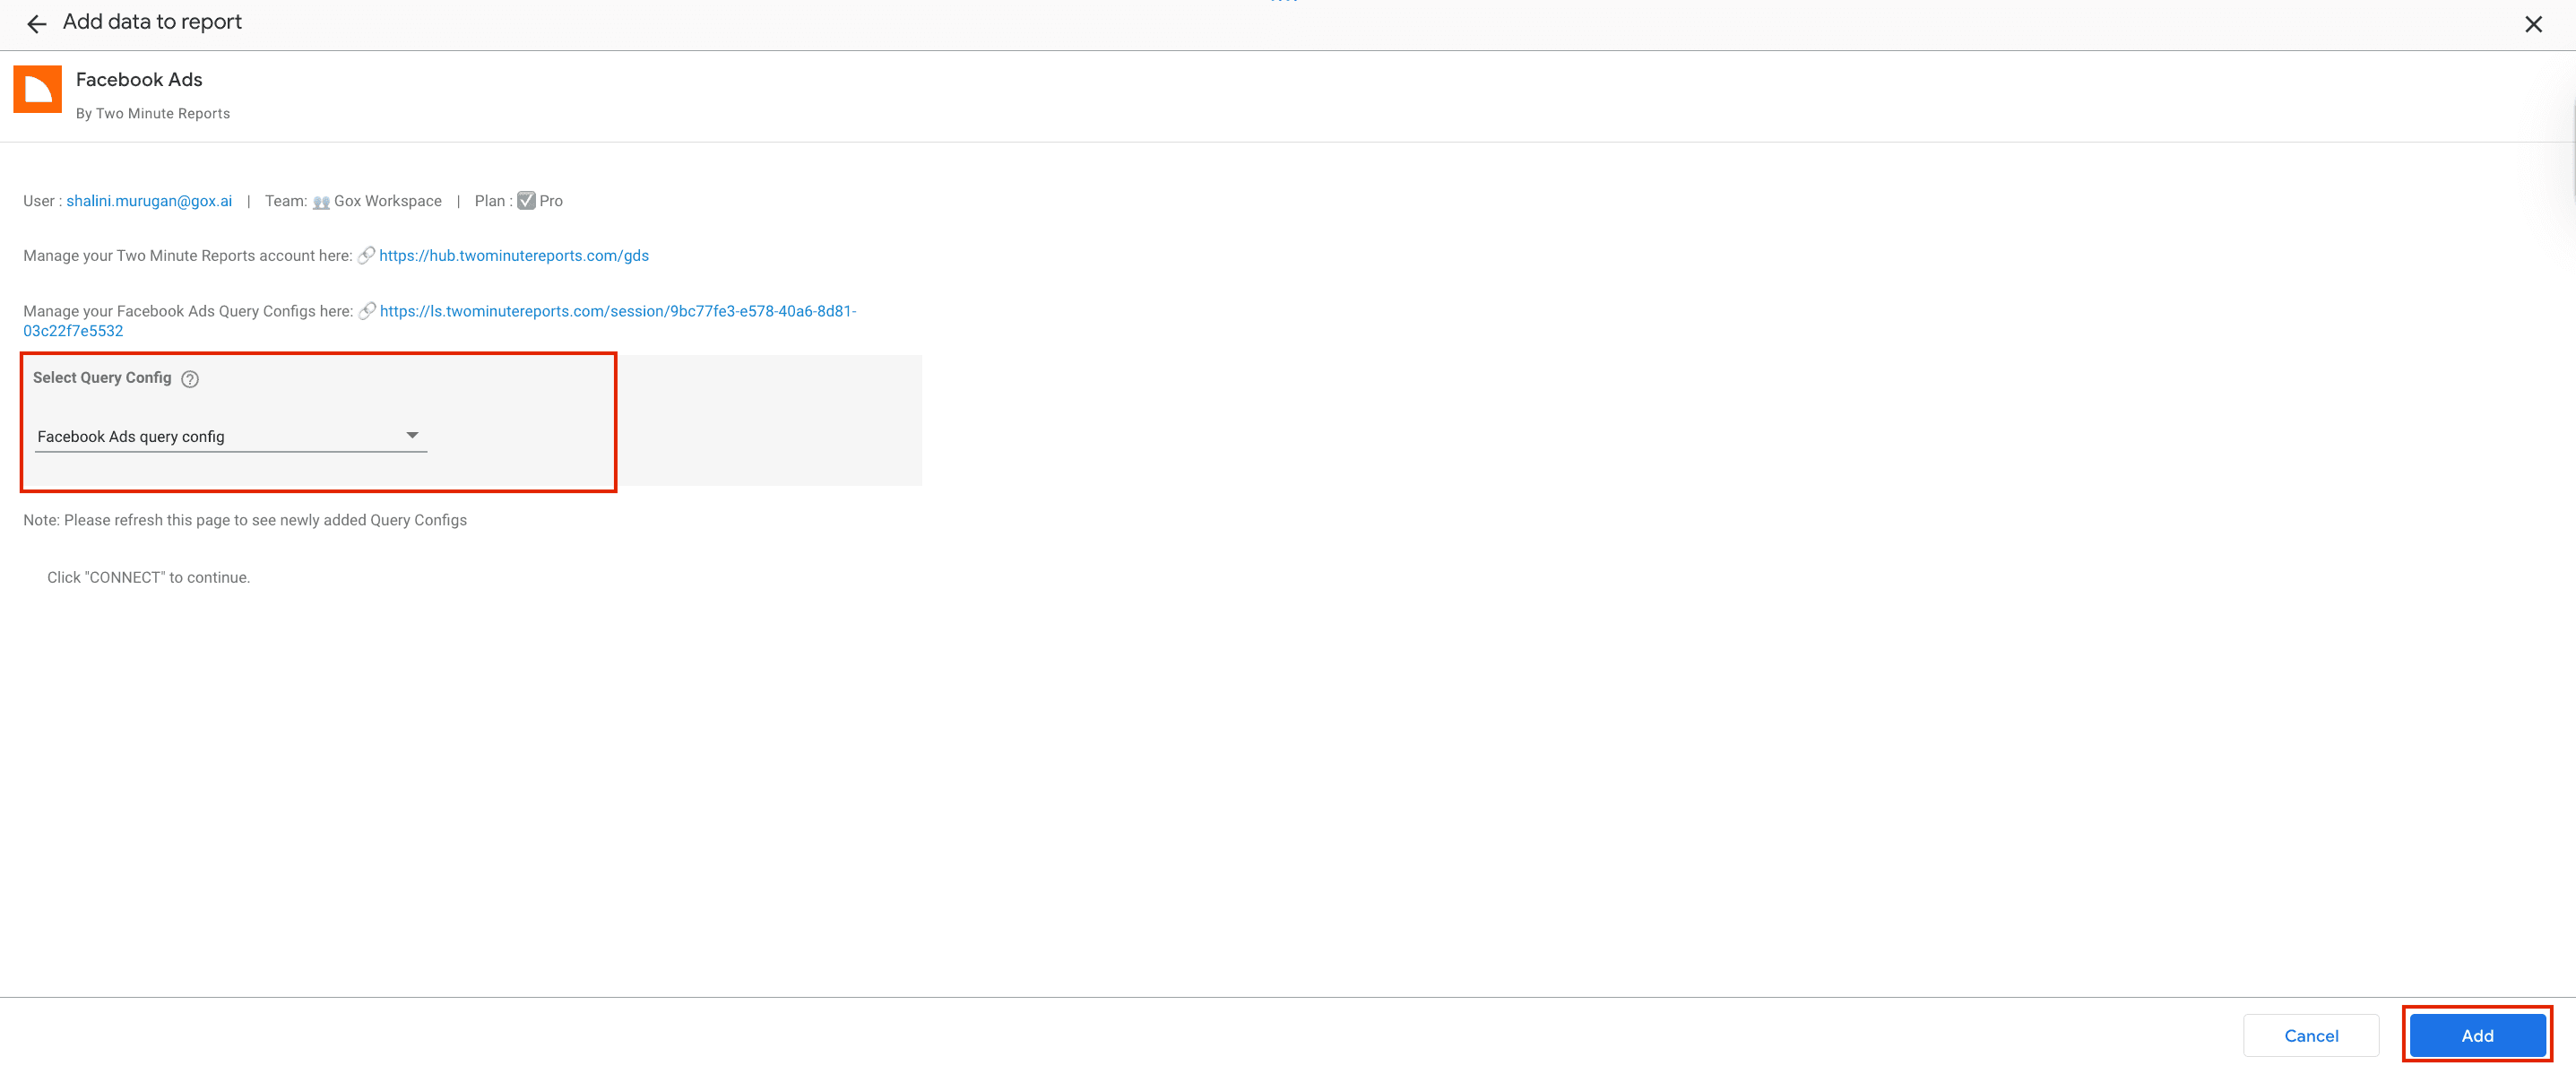

- Once you click Add, your Facebook Ads data will be automatically populated in your Looker Studio dashboard. You can click “Edit and share” to modify elements, include custom logos, and share data-driven dashboards with your clients or stakeholders instantly.
Why connect Facebook Ads to Looker Studio?
Connecting Facebook Ads to Looker Studio helps you centralize your campaign(s) performance for seamless reporting. Instead of navigating through the complex Meta Ads Manager, you can effortlessly connect and visualize holistic insights in a single dashboard.
By connecting Facebook Ads to Looker Studio via Two Minute Reports, you can:
- Effortlessly import key KPIs and track campaign performance for multiple clients in a streamlined dashboard.
- Enjoy lightning-fast report loads (under 5 seconds) powered by exclusive Speedboost technology, eliminating the frustration of slow and broken dashboards.
- Zero row limits – get the freedom to create and automate comprehensive Facebook Ads reports in Looker Studio.
- Deliver visually stunning, professional Facebook Ads Looker Studio dashboards to clients, reinforcing agency-client relationships.
Most important KPIs to include in your Facebook Ads Looker Studio dashboard
Below are the top metrics that could determine the success of your Facebook advertising efforts.
Cost
Keep a close eye on your ad spend by monitoring metrics like:
- CPC and CPM
- Cost per Purchase
- Cost for Unique Link Clicks
- Cost per Conversion
- Cost per Action
Performance
Improve your Facebook Ads performance analysis by tracking key metrics such as:
- Impressions
- Reach
- Clicks
- Conversions and Conversion value
- ROAS
Website conversions (Facebook Pixel)
- Landing page views
- Website purchases
- Leads
- Add to cart
- Checkouts initiated
- Completed registrations
Campaign details
- Name
- Objective
- ID
- Status
- Budget Details (Daily/Lifetime)
- Start/End Dates
Facebook Leads
- Lead Source
- Demographics
- Interests
With these metrics, you can also adjust
- Campaign Settings
- Creative elements
- Follow-up strategies
Create actionable Facebook Ads reports in Looker Studio
Connecting Facebook Ads to Looker Studio empowers you to centralize data, create comprehensive reports, and make data-driven decisions in real-time. By streamlining this process, you eliminate manual work and ensure faster, accurate and insightful reporting.
Frequently Asked Questions
You can directly choose the Two Minute Reports Facebook Ads connector from the Looker Studio marketplace or visit the Two Minute Reports hub to streamline Facebook Ads reporting in Looker Studio.
You can access our free, ready-to-share Facebook Ads Looker Studio templates to streamline campaign tracking. Once you click “Use Template”, you can select the Query Config, customize the Looker Studio dashboard and deliver data-driven insights to your clients or stakeholders.
With Looker Studio’s data blending, you can compare Facebook Ads with other advertising platforms, such as Google Ads, Bing, etc., into a single dashboard and unlock cross-channel ROI. No need to toggle between platforms or copy-paste KPIs manually.
You can import your client’s Facebook Ads accounts and visualize a complete breakdown of performance across multiple clients in a single dashboard. With exclusive Speedboost technology, your Looker Studio dashboard loads in under 5 seconds, helping you to act faster on actionable insights.

Meet the Author
Shalini MuruganShalini is driven by ideas that create a tangible impact. At Two Minute Reports, she specializes in content that helps marketers optimize their reporting workflows. When she's not transforming complex data into meaningful insights, you might find her lost in a book, jotting down ideas in her notebook, or connecting the dots others overlook.