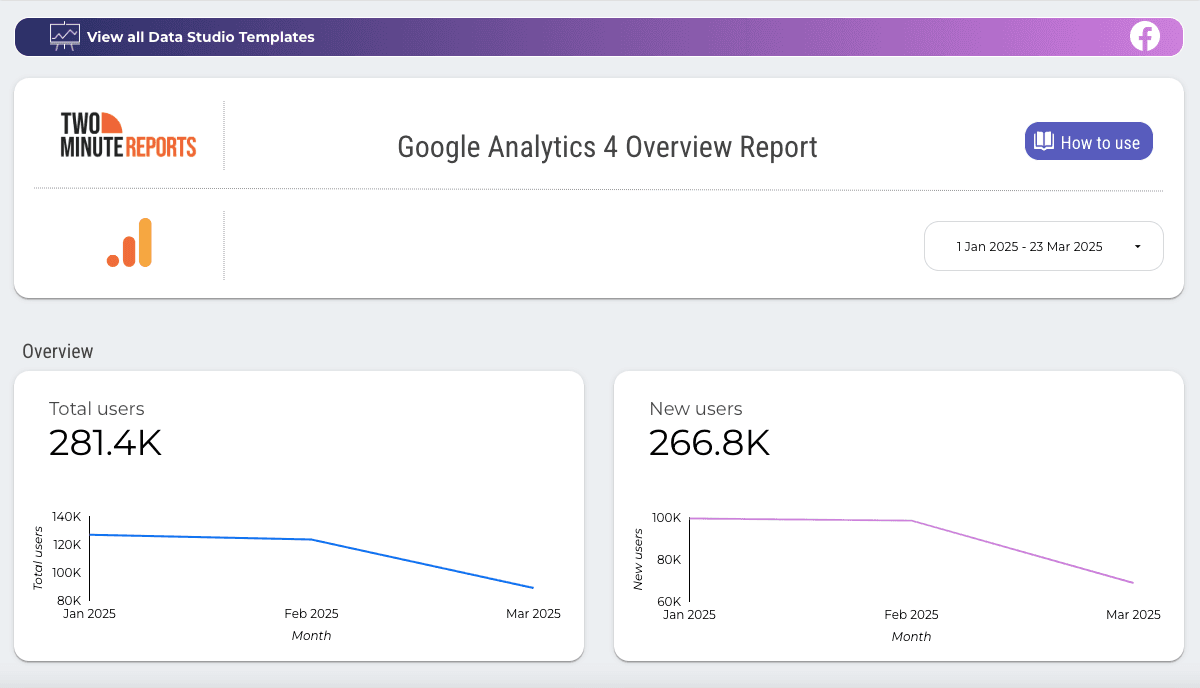
Google Analytics Reporting Tool
Tracking GA4 Data? Get Faster, Smarter Reports.

Trusted by 4000+ brands and agencies


Automate, Customize, and Scale your Google Analytics Reporting
Two Minute Reports transforms GA4 data into client-ready reports with zero code or BigQuery setup. Whether you’re tracking user journeys or ecommerce conversions, you’ll get insights faster, clearer, and easier.
Fast, automated reporting
Build it once. Let it auto-refresh and deliver forever. No more manual pulls.
Seamless integrations
Use Two Minute Reports with Looker Studio and Google Sheets.
Custom dashboards
Build performance dashboards easily with our 100+ ready-to-use templates or your own layout.
Scheduled delivery
Send up-to-date reports to clients or stakeholders automatically on a daily, weekly, or monthly basis.
Data security and control
Your data stays safe with secure authentication and granular user-level permissions.
No code required
No more complex API setup, dev work, and spreadsheet chaos.
Set up GA4 Reporting in Three Simple Steps
With Two Minute Reports, you can start tracking your GA4 Ads data in minutes – no coding required.
Connect your GA4 property
Securely authenticate your GA4 account with no technical setup – sync your data instantly.
Select metrics and schedule refresh
Choose from 280+ data points – including sessions, bounce rate, ecommerce purchases, conversion rate, and more. Choose your refresh frequency.
Build and share your dashboards
Use our pre-built templates or build your own dashboard in Looker Studio or Google Sheets.
Pick Your Destination for Google Analytics 4 Reporting
Google Sheets
Get unlimited insights from your Google Analytics 4 data inside Google Sheets™ — automate reports, blend metrics, and monitor performance like a hawk.
Learn More
Looker Studio
Create always-live, interactive dashboards for Google Analytics 4 in Looker Studio and securely share them with your internal and external teams.
Learn More
Instant GA4 Reports. No More Spreadsheets.
No more GA4’s default UI limitations. With Two Minute Reports, track all your KPIs in one place:
- Sessions, users, bounce rate, engagement
- Purchases, AOV, item views, revenue
- Goal completions, event tracking, user journeys
Unlock fast, actionable GA4 insights with centralized tracking. Optimize the customer journey and enhance website performance with real-time analytics.

GA4 Reporting That Works for Everyone
Whether you're managing ecommerce, running ads, or analyzing performance, Two Minute Reports makes GA4 work for you.
For Agencies
Deliver professional GA4 dashboards across all your client accounts.
White Label Reports
Present fully branded, client-ready GA4 reports that your clients will trust and remember.
Client Account Mapping
Map GA4 properties to specific clients for seamless report delivery. Manage all your clients from one central dashboard.
Automated Report Delivery
Save time by scheduling recurring GA4 reports to clients via email.
Custom Fields
Add context and track specific client KPIs across platforms in one report.

Frequently Asked Questions
A GA4 reporting tool like Two Minute Reports helps you extract Google Analytics 4 data easily and build visual dashboards and automate reports in minutes. Instead of manually exporting data, build real-time, client-ready reports in Google Sheets or Looker Studio – no BigQuery or coding required.
Once connected, you can set hourly or daily refreshes, automate email delivery, and get notifications for failed queries – all managed from a single dashboard.
Two Minute Reports supports over 90 GA4 metrics (such as sessions, revenue, and conversions) and more than 190 dimensions (including device, location, source, and landing page). Explore the complete list of GA4 metrics here.
Two Minute Reports includes query logs and smart alerts. You'll receive notifications by email if a scheduled report fails, so you can fix issues before your clients notice.
Yes! Track ecommerce purchases, item views, revenue, AOV, and more. Our GA4 ecommerce templates help you launch quickly and customize for your KPIs.
Yes. Use our client mapping feature to organize GA4 properties by client. Easily duplicate templates, manage access, and automate delivery for each client. Perfect for agencies.
Start by connecting your GA4 property to Two Minute Reports. Then, choose the metrics and dimensions you want to track, such as sessions, conversion rate, or revenue, and set your refresh schedule (hourly, daily, or weekly). Finally, visualize your data using our pre-built templates or build a custom dashboard in Looker Studio or Google Sheets. Your GA4 report will be ready in under 2 minutes.
Absolutely. We use secure authentication protocols, granular user permissions, and follow best practices to safeguard your data.
Flexible Pricing, Powerful Reporting
Made for marketers of all sizes.
Google Sheets
Looker Studio
Included Access
Queries
Data History
Support
Included Access
Queries
Data History
Support
Included Access
Queries
Data History
Support
Included Access
Queries
Data History
Support
Supercharge Your Workflow with Powerful Integrations
Connect with 20+ popular tools across marketing, analytics, advertising, and eCommerce to automate and streamline your reporting. Build once, report everywhere.
Explore All IntegrationsRecommended Articles

Connect GA4 to Google Sheets: Tutorial and Free Templates (2026)

Connect GA4 to Looker Studio: Tutorial, Templates & More! (2026)
Take back your time. Wow clients.
Get Two Minute Reports.
Start your free trial todayBuilt by marketers. Built for marketers.
