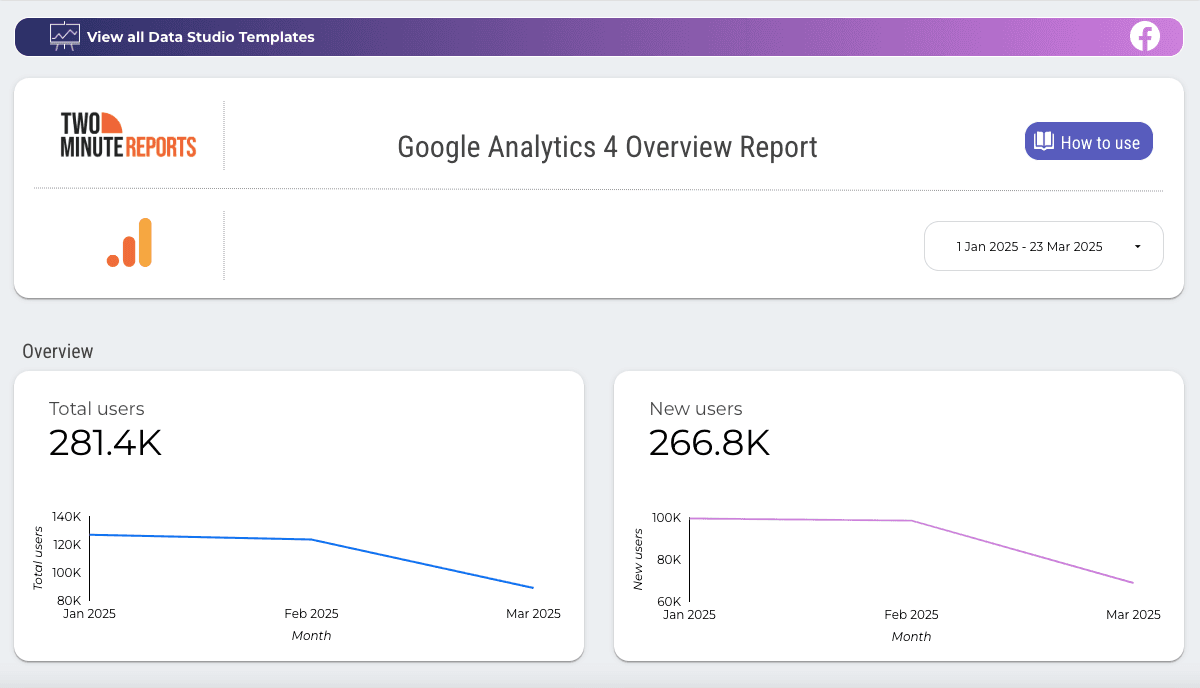


Google Analytics 4 Overview Report
Web Analytics
About the template
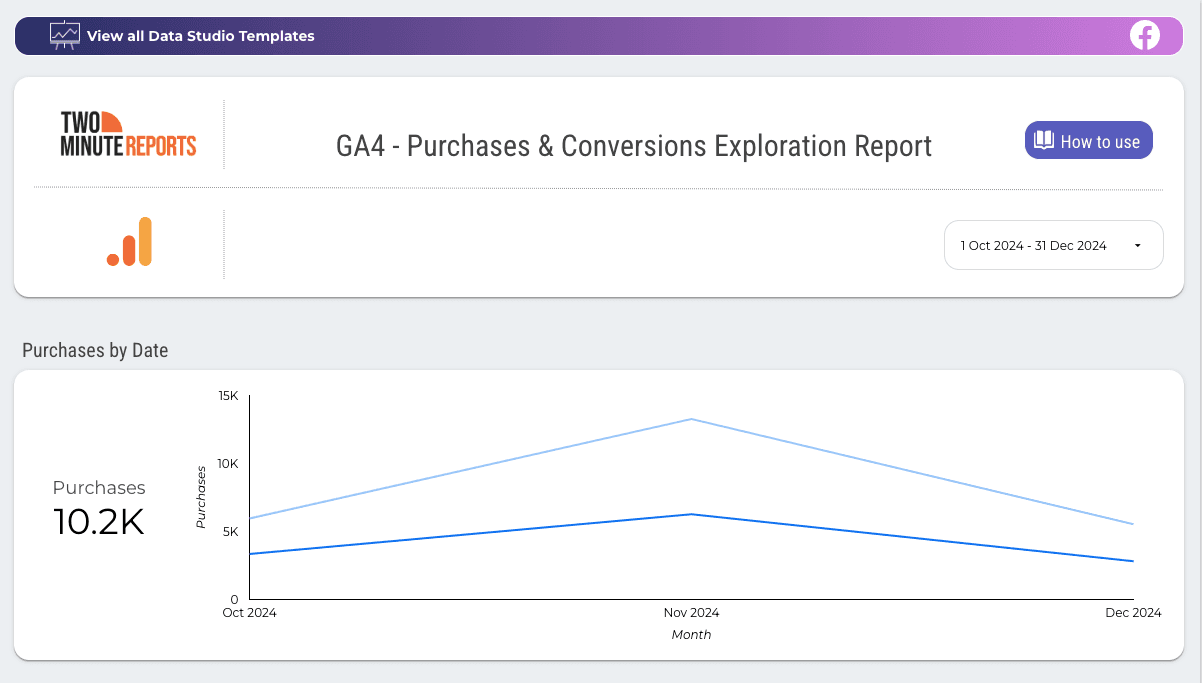
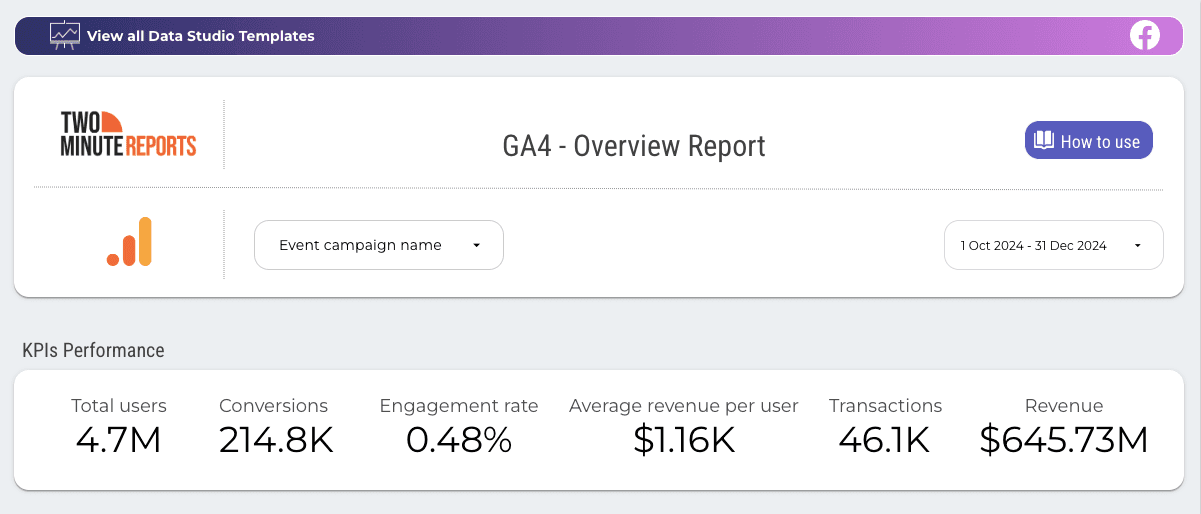
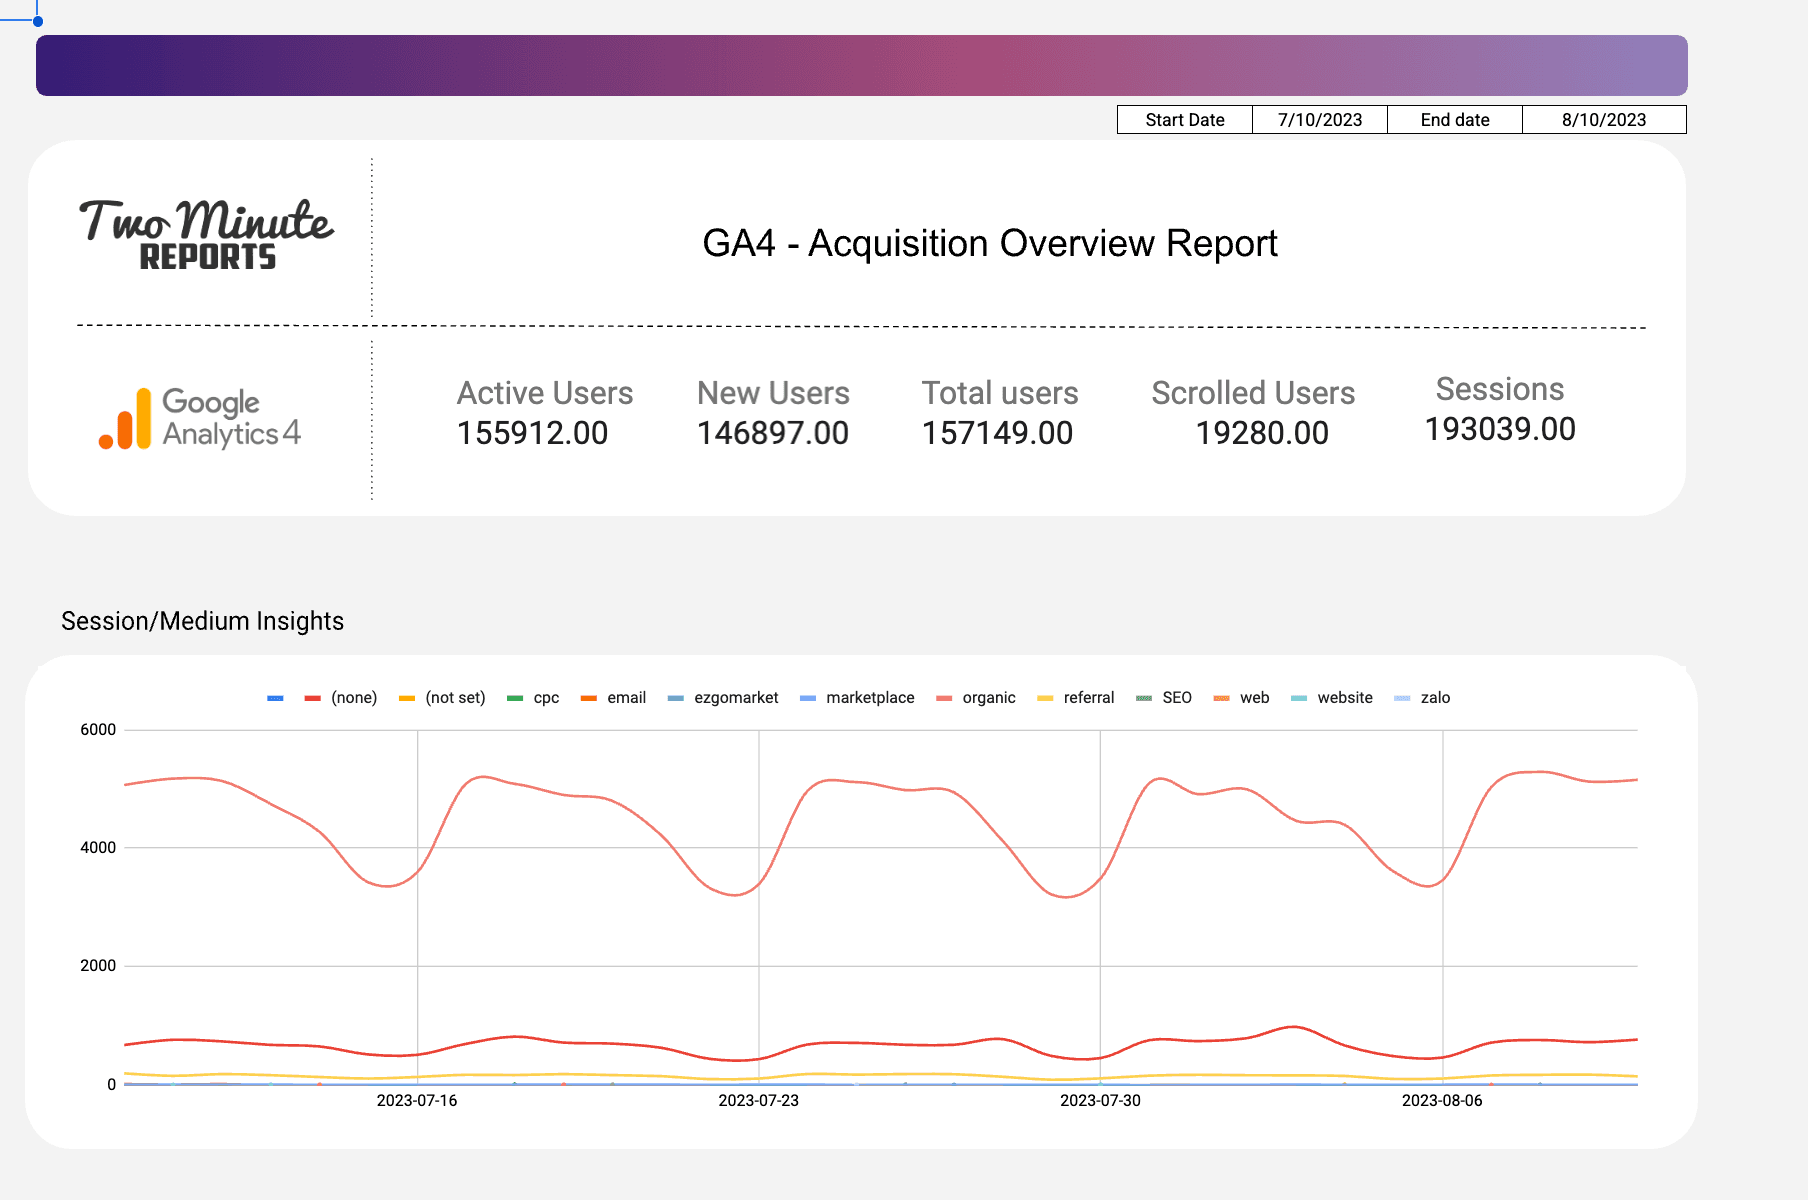
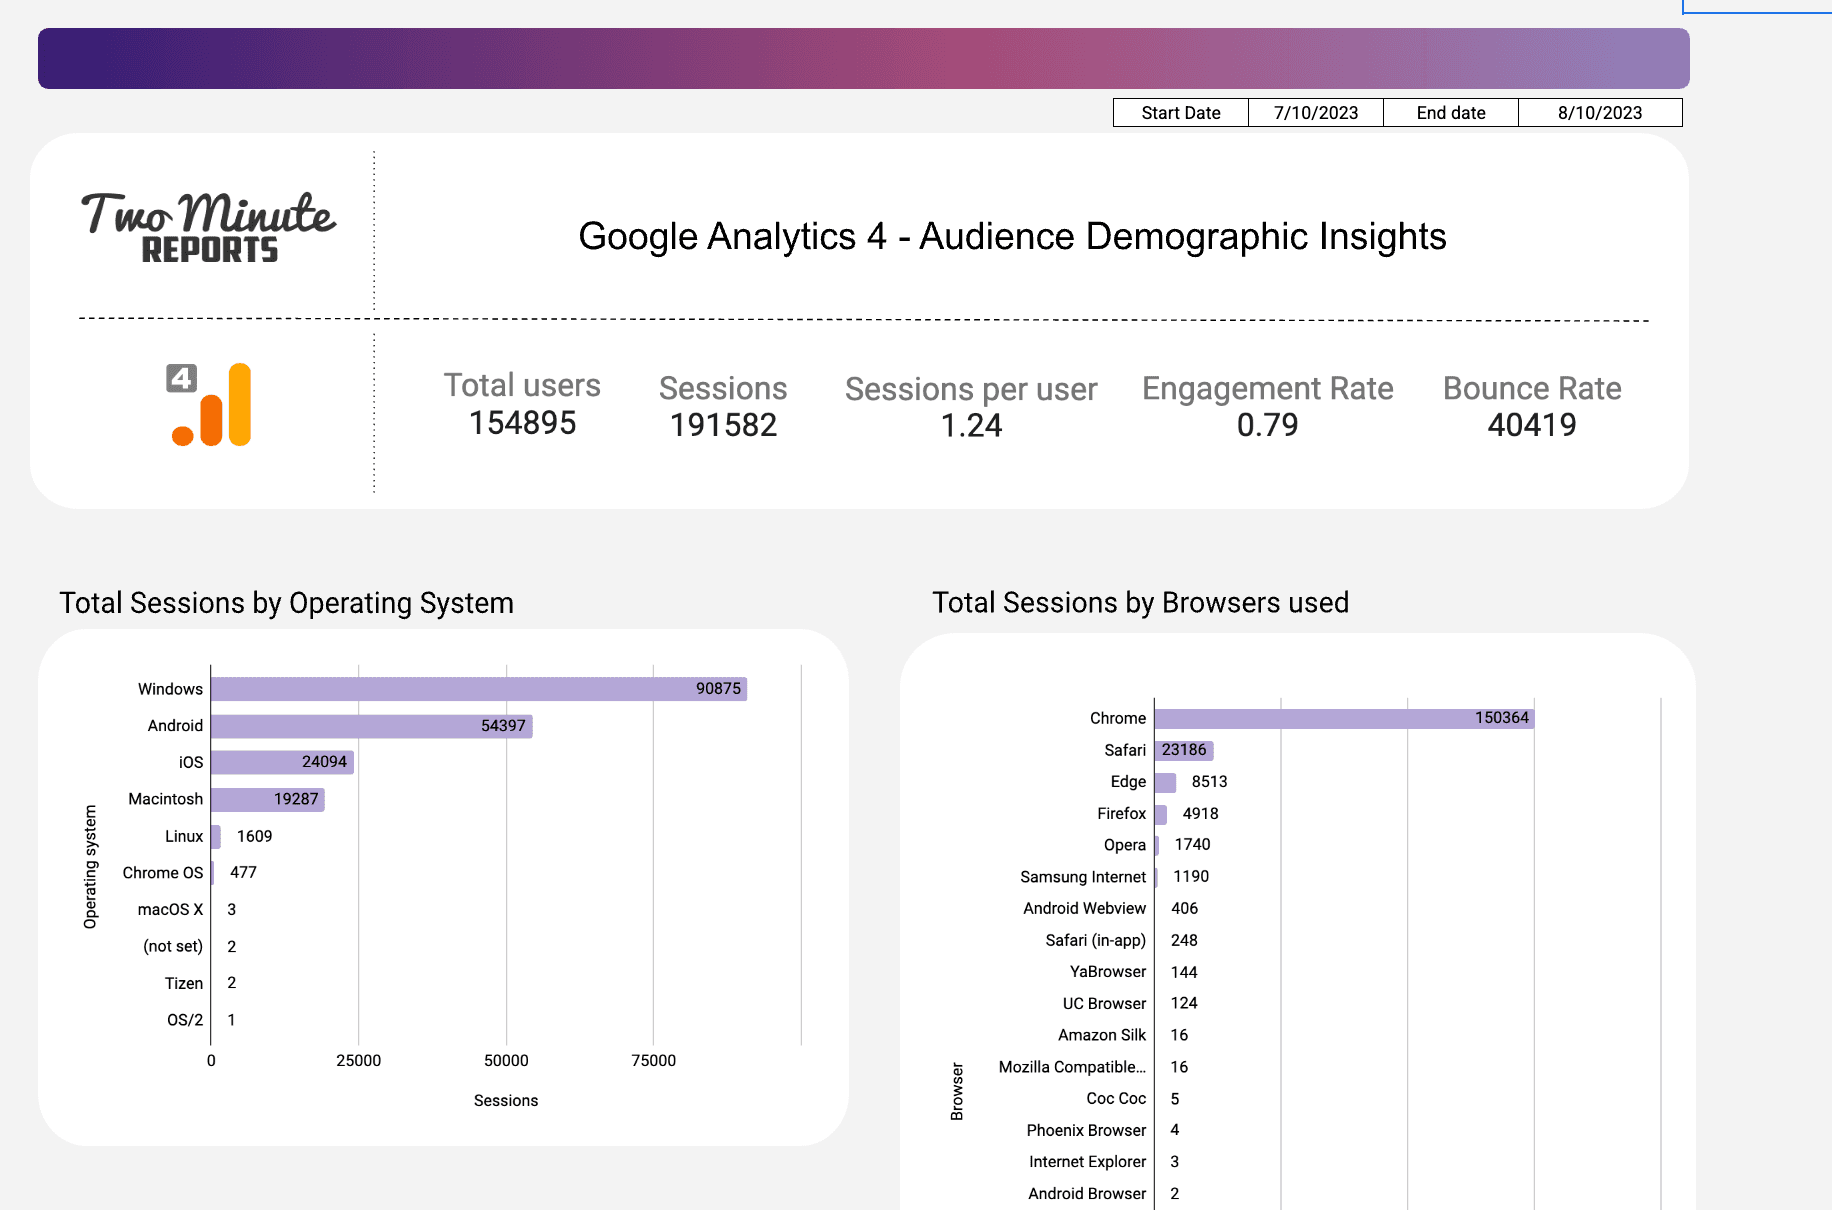
This is an interactive Google Analytics template designed to analyze user behavior, engagement, and revenue in one place. It features descriptive scorecards with date-range comparisons for total users, new users, user engagement, and revenue. The template includes detailed charts across Acquisition, Engagement, Monetization, Demographics, Technology, and the Shopping Funnel. The built-in control bars allow you to dynamically filter data by user type and date range for flexible analysis. Click on preview to see how the template works in action.
More Web Analytics Templates for Looker Studio
View allReport Categories
More Google Sheets Templates
View allMore Google Looker Studio Templates
View allTake back your time. Wow clients.
Get Two Minute Reports.
Start your free trial todayBuilt by marketers. Built for marketers.

