
Shopify Dashboard with Traffic and Sales report
E-Commerce
About Shopify Traffic Dashboard Template
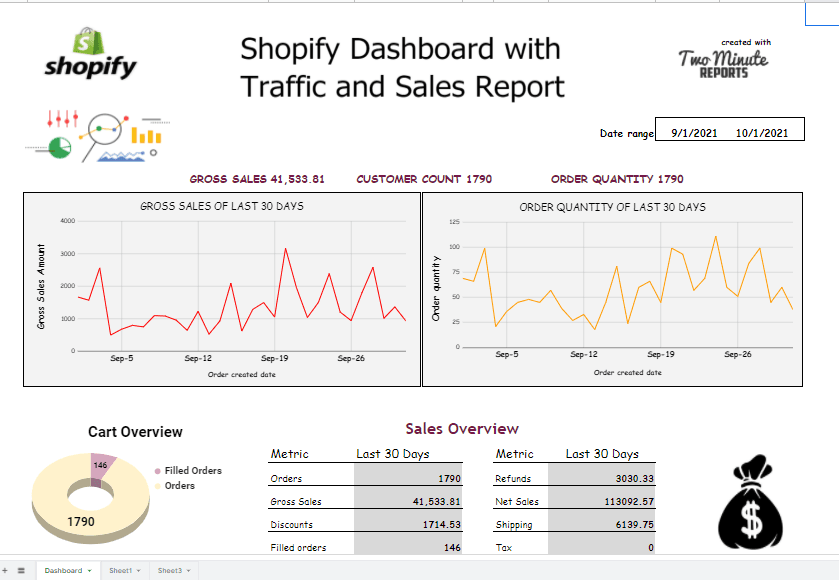
This is a unique dashboard which infers data for 30 days, where the data can be changed by the user dynamically. This traffic dashboard contains vital metrics like Top Revenue Sources, Gross Sales, Total Sales, Order Quantity, Tax refund, Net Sales, Shipping, etc. Here's how you can leverage this Shopify template:
- Top 20 revenue sources: This chart represents the top 20 traffic sources with respect to their order quantity.
- Gross sales chart: This chart represents the gross sales amount on each day for the chosen date range.
- Order quantity chart: This chart represents the number of orders placed on each day for the chosen date range.
- Cart overview pie chart: This pie chart represents the total, unfulfilled, and fulfilled orders for the chosen date range.
- Sales overview chart: This chart represents key metrics such as orders, gross sales, discounts, refunds, net amount, etc for the chosen date range.
- Top 20 products by sales chart: This chart displays the top 20 products which have the highest sales with respect to their order quantity.
Overall, you can effectively keep track of Shopify store revenue and customers every month.
More E-Commerce Templates for Google Sheets
View allReport Categories
More Google Sheets Templates
View allMore Google Looker Studio Templates
View allTake back your time. Wow clients.
Get Two Minute Reports.
Start your free trial todayBuilt by marketers. Built for marketers.


