

About the template
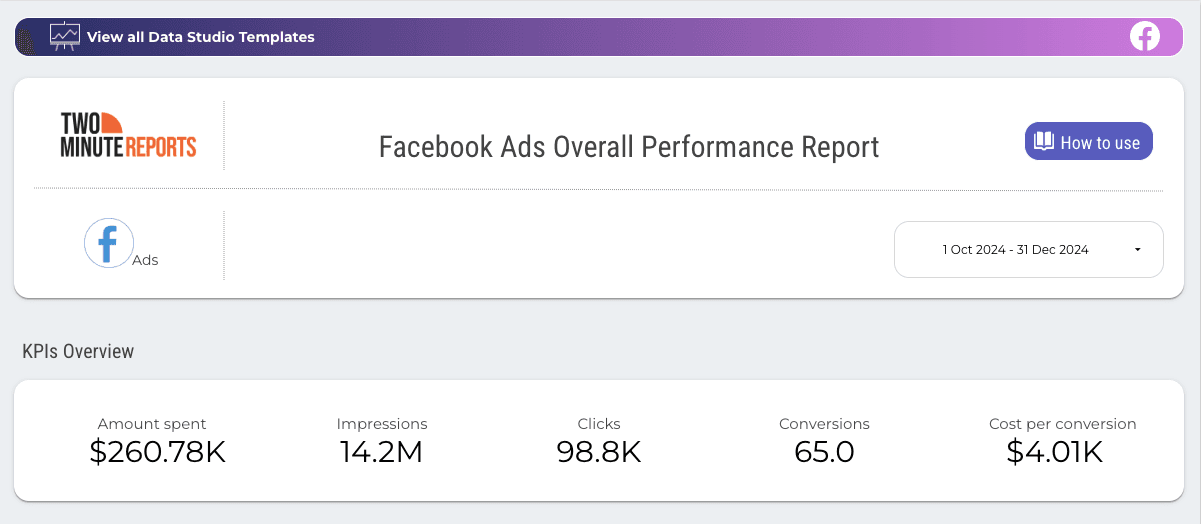
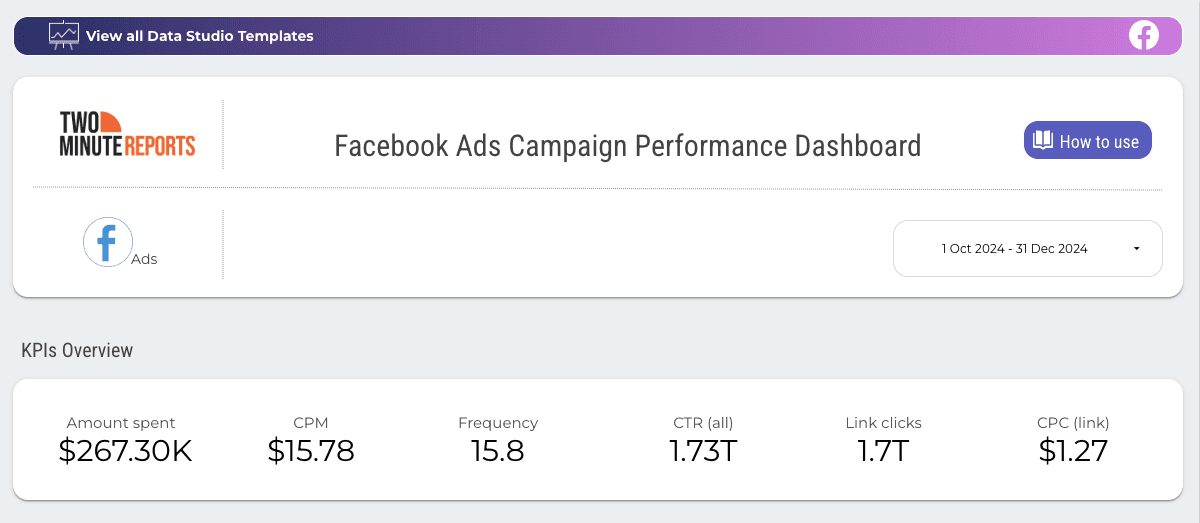
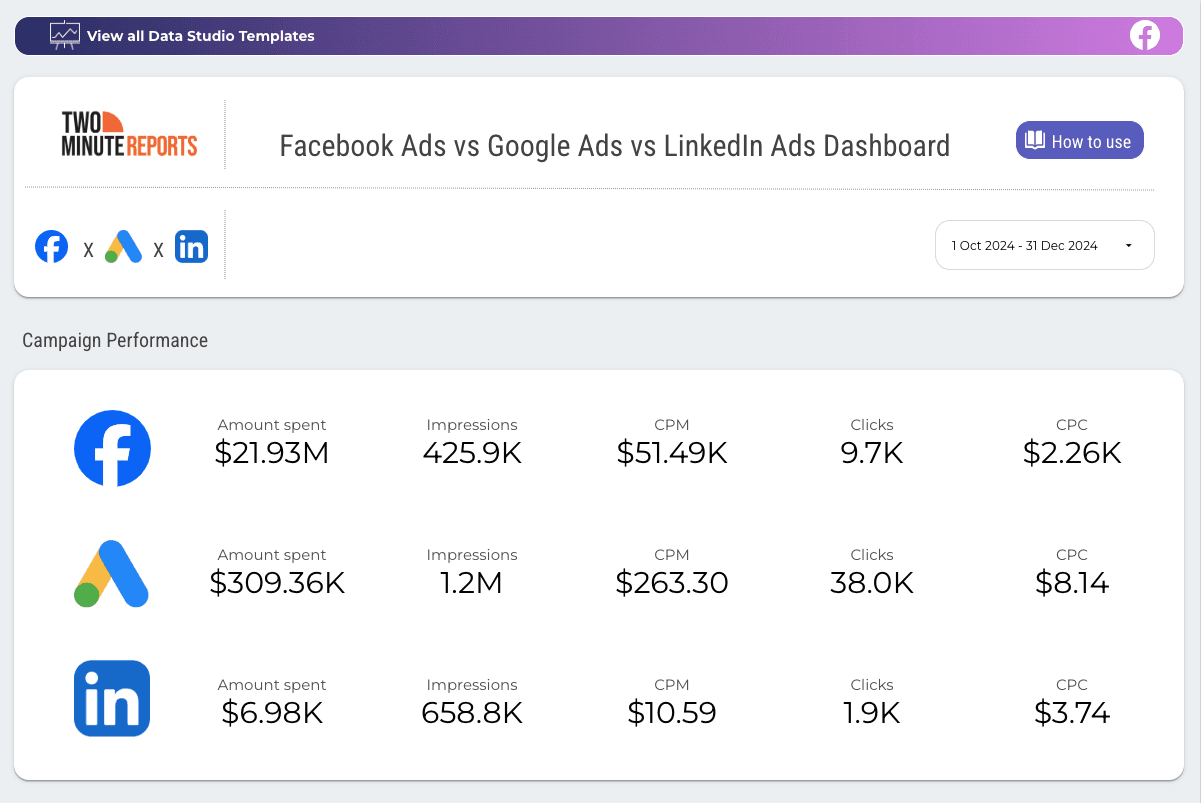
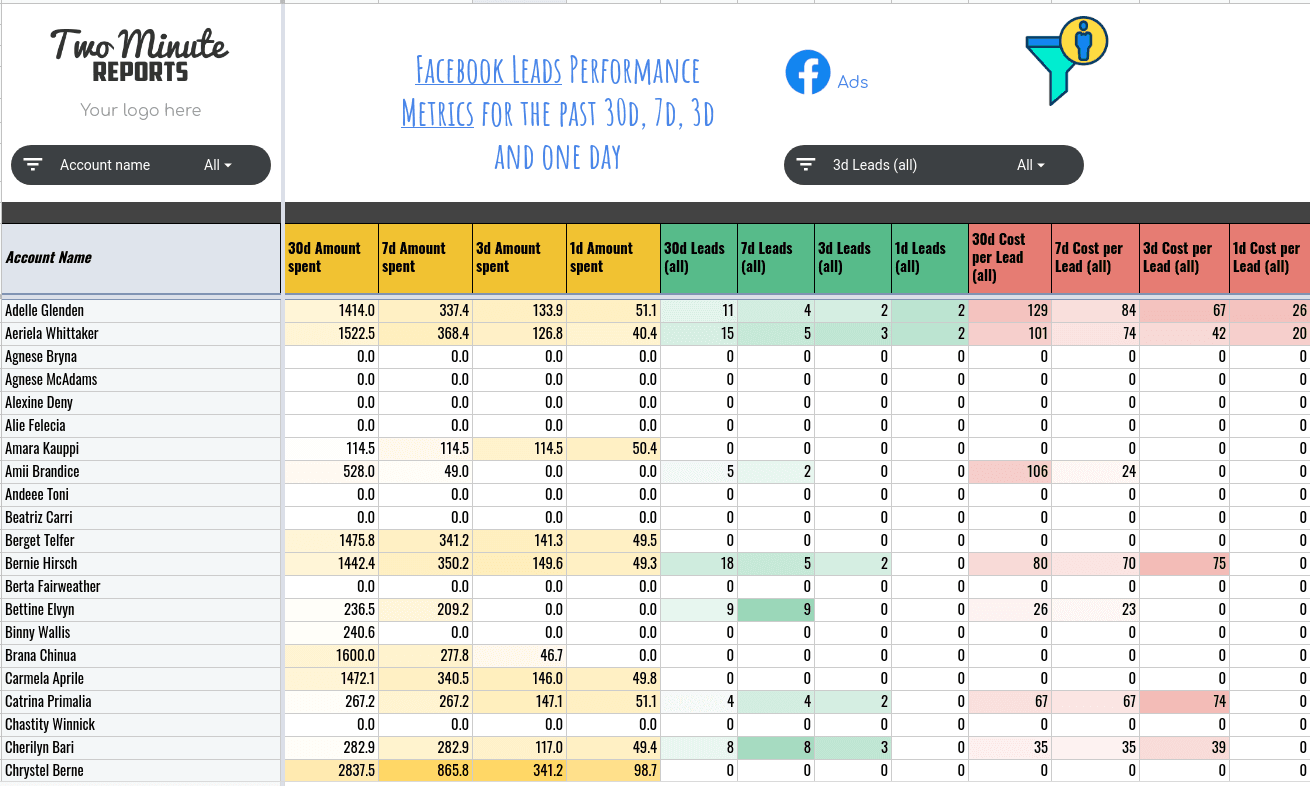
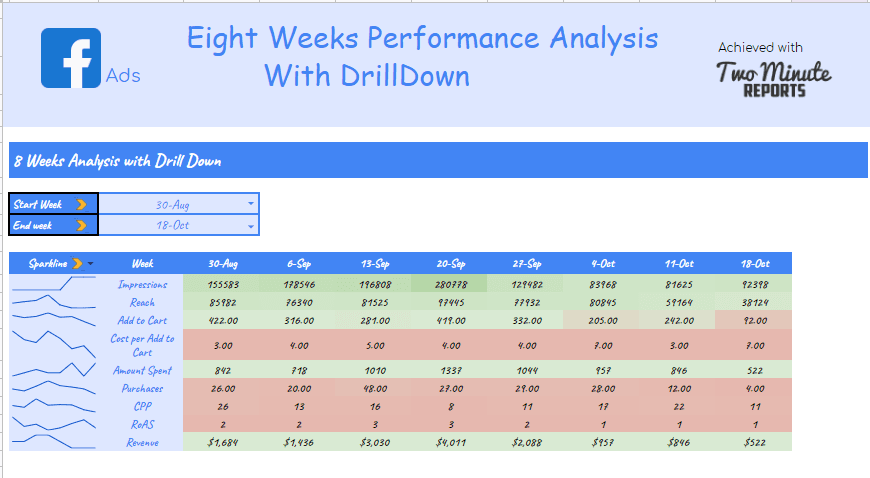
This interactive dashboard provides an overview of data such as impressions, clicks, actions and cost. You can keep track of how your Facebook Ads are performing with this detailed dashboard template.
Overview:
1) It contains dynamic charts that give a detailed idea of your Facebook Ads performance.
2) It also provides a list of top campaigns based on the amount spent, clicks , conversions, purchases (all), cost per conversion, cost per purchase (all).
Breakdown:
1) The campaign objective breakdown section contains the total amount spent, link clicks, cost per action, actions, conversions and impressions for different campaign objectives.
2) The age breakdown section contains information about the number of people in different age groups based on their actions.
3) The gender breakdown section provides an idea about the total number of actions performed by different genders.
4) The device breakdown section contains information about the amount spent, clicks and link CTR using different devices.
5) The country breakdown section presents the total number of conversions in each country.
More Advertising (PPC) Templates for Looker Studio
View allReport Categories
More Google Sheets Templates
View allMore Google Looker Studio Templates
View allTake back your time. Wow clients.
Get Two Minute Reports.
Start your free trial todayBuilt by marketers. Built for marketers.
