
Summarize this blog post with:
You open Google Search Console, export the data, clean it up, and drop it into a client deck. It takes longer than it should. And in a few weeks, you’ll repeat the process.
For one client, it is manageable. For five or ten, it quickly becomes tedious.
The problem isn’t the data – GSC captures plenty of it. The problem is that it wasn’t built for client reporting at scale. Row limits restrict deeper keyword analysis, and comparing ranking or performance trends across multiple clients often requires repeated manual work.
That’s where using a third-party Google Search Console connector makes a difference. When connected to Looker Studio, it transforms your fragmented workflow into a structured, scalable SEO dashboard.
In this guide, you’ll learn how to build an SEO keyword ranking report in Looker Studio using Two Minute Reports that lets you track clicks, impressions, CTR, and average position – so you can show clients exactly which keywords are gaining ground, which are slipping, and what actions to take next.
What is a Keyword Ranking Report in Looker Studio?
A keyword ranking report in Looker Studio is a structured dashboard that tracks how your website’s search queries perform over time. By connecting to Google Search Console, you can track and visualize keyword-level metrics, including clicks, impressions, average position, and CTR in a clear format.
How Is It Different From a Google Search Console Export?
A basic Google Search Console data export gives you raw query data for the selected date range. It's useful for analysis, but it’s static and manual.
A Looker Studio keyword ranking report:
- Visualize trends instead of just listing rows.
- Allows date comparisons without re-exporting files.
- Supports filtering by page, query, device, or country.
- Maintain a consistent reporting structure across accounts.
- Deliver client-ready dashboards with controlled access, eliminating version confusion and manual reporting cycles.
This makes it practical for both internal teams and agencies.
What you’ve seen so far is the structural overview of an SEO keyword ranking report in Looker Studio. Now let’s go deeper. Understanding the format is one thing; knowing why it is strategically superior to relying on GSC is another.
In the next section, we’ll break down why serious SEO client reporting requires tracking keyword rankings in Looker Studio and not just reviewing them inside GSC.
Why Should You Track Keyword Rankings in Looker Studio (Not Just GSC)
Relying on Google Search Console means you’re reviewing keyword data. Using Looker Studio means you’re operationalizing it. The difference lies in how you structure, compare, segment, and present it for decision-making. Here’s how it helps:
1. Visualize Ranking Distribution Over Time
In GSC, you see the average position per query. In Looker Studio, you can group positions into segments and plot them as stacked area charts across weeks and months. This reveals:
- Whether visibility is expanding upward (eg, more keywords entering the top 10).
- Whether algorithm updates caused downward shifts across content clusters.
- Whether newly published content is gaining traction gradually over time.
This clear distribution trend helps you measure your online footprint and identify where to focus in your next content optimization cycle.
2. Track Total Keyword Count By Position Bucket
Individual rankings fluctuate. Bucket counts reveal structural growth.
Tracking keyword volume inside Top 3, 4-10, 11-20, 21-50, and 50+ bands allows you to:
- Measure how efficiently keywords move towards page one.
- Detect stagnation when keywords are stuck in the mid-tier bands for an extended period.
- Measure how efficiently content progresses through ranking stages.
This structured keyword tracking mechanism builds a visibility architecture.
3. Replace Static Exports with Always-Current Dashboard
GSC requires repeated filtering and exporting for reporting cycles, and its native export is capped at 1000 rows, which can limit deeper analysis. Besides, agencies managing multiple properties often exceed this row limit.
In such cases, using a third-party Google Search Console Connector, such as Two Minute Reports, allows you to pull larger datasets and build more scalable keyword-ranking dashboards without losing query coverage. Once built, you can:
- Pull fresh data automatically to ensure your dashboards reflect the latest data.
- Remove recurring export workflows.
- Avoid version inconsistencies across reports.
Note: To understand how frequently data updates, check out our article on data freshness in Looker Studio to learn how dashboard refresh cycles work.
4. Apply Branded vs Non-Branded Keyword Filters
Branded queries can inflate performance metrics. With calculated fields and regex filters in Looker Studio, you can:
- Separate brand-driven clicks from discovery-driven visibility.
- Track non-branded growth independently.
- Present clearer SEO performance trends.
This ensures you measure true search expansion.
5. Blend GSC + GA4 To Connect Rankings To Business Impact
Ranking improvements are meaningless if they don’t influence engagement or revenue. By blending GSC with GA4 inside Looker Studio, you can:
- Tie position improvements to engaged sessions and time on page.
- Evaluate whether the top 10 keywords convert.
- Prioritize keywords that influence revenue, not just clicks.
This connects visibility metrics with your website’s conversion efficiency.
Prerequisites: What You Need Before Building Your Keyword Ranking Report in Looker Studio?
Before building your SEO keyword ranking report in Looker Studio, you need access to search performance data and the tools required to visualize it. Make sure the following requirements are in place before proceeding.
- A verified Google Search Console property to access keyword impressions, clicks, and ranking data.
- A Google account with access to Looker Studio for creating and customizing your keyword ranking dashboard.
- At least 2 to 4 weeks of Google Search Console data so you can analyze meaningful ranking trends.
- An established GSC connection with Two Minute Reports to pull data inside Looker Studio.
What Metrics Should You Include In Your SEO Keyword Ranking Report?
The metrics below help you connect search visibility, ranking performance, and actual user behavior, giving you a clear picture of how your SEO efforts are performing.
Note: Average position in Google Search Console represents an average ranking across queries and users, not a fixed position in search results. It should be interpreted as a directional trend rather than a precise rank.
How to Create an SEO Keyword Ranking Report in Looker Studio?
In this section, let me walk you through a clear, step-by-step process for creating an actionable keyword ranking dashboard in Looker Studio using an SEO reporting software such as Two Minute Reports.
Step 1: Connect Google Search Console As Your Data Source
- Go to Two Minute Reports Hub → Select Looker Studio → Choose the Google Search Console connector.
- Click “New Connection” and authenticate your Google account associated with your website property.
- After successful authentication, you can enable the required GSC accounts for which you need to create a keyword ranking report in Looker Studio.


Step 2: Configure your GSC Account with Two Minute Reports
- In the Query Configs section, click +New Query Config
Note: Query Config allows you to group multiple accounts, making it easier to access centralized insights in your Looker Studio dashboard.


- The “Adding New Configuration” dialog box appears. Specify the following: Name of the Query Config, select the account(s) to use, and choose the report type – Analytics, Sitemap, or URL inspection.
- In our setup, we’ll select the Analytics report as it primarily focuses on measuring keyword rankings and SEO performance.


- That’s it. Click Save. Now you can use this Query Config to pull your Google Search Console data directly into Looker Studio.
Step 3: Create your SEO Keyword Ranking Report in Looker Studio
- After creating your Query Config, click Create Report at the top-right corner.


- Select the Query Config that we have created in the previous step – GSC KW Performance Report. Click ‘Next’ and choose ‘Create Report from Scratch’ to start creating your keyword ranking dashboard.
- Follow the on-screen instructions to import your Query Config data, select the required metrics, and click ‘Create Report’ to open your Looker Studio dashboard.
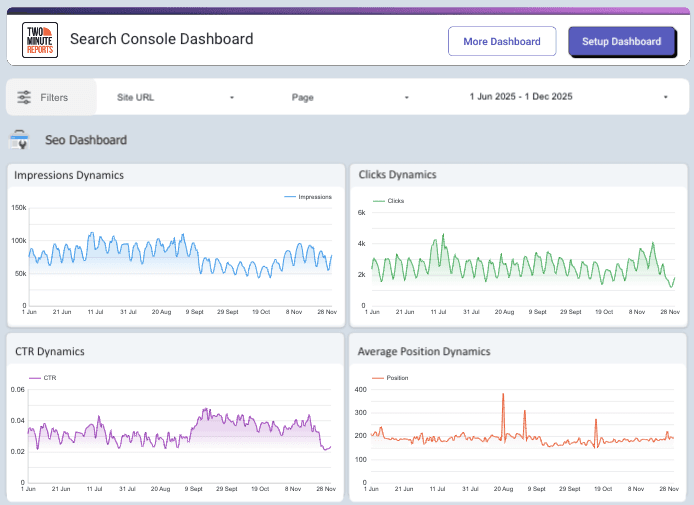
- Once the Looker Studio dashboard opens, you can pull key SEO metrics such as impressions, CTR, clicks, and position, and dimensions such as Query, Page, Device, etc., to get a holistic view of your website’s keyword ranking performance.
Here’s a snapshot of an SEO Keyword Ranking Report in Looker Studio created using Two Minute Reports:


Now your SEO Keyword ranking dashboard is ready for action planning. You can further deepen your analysis by tracking branded vs non-branded keywords, keyword position groups, etc. Let’s explore it in the next section.
How to Design Your Looker Studio SEO Keyword Ranking Report?
Your Looker Studio keyword ranking dashboard feels incomplete without meaningful visualizations. The following interpretations help you craft a data-driven storytelling unfolding actionable SEO insights.
1. Create a Branded vs Non-Branded Keyword Segment in Looker Studio
- Go to Resource → Manage added data sources → Click the Edit option under Actions.


- Next, click Add a field → Add a calculated field. You can paste the case formula with REGEX matching your brand terms.


Here’s how it works:
- Query → keyword from Google Search Console.
- REGEXP_MATCH → checks if the query contains your brand term.
- (?i) → makes the match case-insensitive.
Replace the brandname with your actual brand.
- Finally, click Save → Done.
- Now your newly created custom dimension will be available under the dimensions. You can create a pie chart and showcase the clear breakdown between the branded vs non-branded segment, or any custom visualization, such as a time series chart that aligns with your preference.


Other possible visualizations options include:
- Device segmentation: Compare branded vs non-branded traffic by device (desktop vs mobile) to identify behavioral differences.
- Landing page analysis: See which pages attract branded vs non-branded queries to understand how your content performs.
- Performance table: Create a table with Branded/Non-branded keyword as a dimension and metrics like clicks, impressions, CTR, and position to compare performance directly.
Next, we’ll see how to perform keyword opportunity analysis in Looker Studio.
2. Identify Low-Hanging Keyword Opportunities
- Build your table in Looker Studio: metrics: Impressions, CTR, Position, and dimensions: Query.
- Apply the following filters: Impressions > 100 and Position>=8 and Position <=20. Note that you can change the filters depending on your preferences.
- Your table is now ready. It displays the keywords that have good visibility and ranking between 8 and 20 positions, allowing you to optimize your content marketing strategy.


3. Analyze Keywords Ranking Across Different Position Groups
Understanding where your keywords rank is essential for prioritizing your SEO actions. Now let’s see how to track the keywords ranking in different position bands as follows:
1. Add a table to your report
Insert a table and configure it as follows: metrics such as impressions, CTR, and dimension: Query and position group. This table will show which keywords fall into each ranking band.
2. Review how keywords are distributed:
Look at how many keywords appear in each group:
- Top 3 → high visibility and strong traffic potential.
- 4–10 → page-one rankings that can be improved further.
- 11-20 → close to page one, offering quick optimization opportunities.
- 21–50 → early-stage rankings that may require stronger content.
3. Identify optimization opportunities
Focus on keywords that have:
- High impressions
- Belong to the 11–20 position group
These queries already appear frequently in search results and may move to page one with small improvements, such as better internal linkings and or content updates.


Note: Position Group is a custom dimension in Looker Studio. Follow the same steps as we did for creating a branded vs non-branded keyword segment.
Here’s the Case formula to create it:


4. See Which Keywords Drive Traffic To Your Landing Page
While keyword-level analysis shows what users search for, analyzing performance by landing page helps you understand which pages are driving the most traffic. Here’s how you can do:
1. Add a table to your report
Create a table with the following metrics and dimensions: metrics: impressions, CTR, position, and dimensions: page. Set the Query as a filter to see which specific keywords drive traffic to your landing page.
2. Identify pages with high visibility
Look for pages with high impressions. These pages already appear frequently in search results and indicate strong keyword visibility.
3. Spot pages that need improvement
Focus on pages that have:
- High impressions
- Low CTR
- Average position between 8-20
This means the page is ranking but not driving enough clicks.
Tip: Apply these fitlers: Impressions >= 100; Position >= 8 and Position <=20; CTR <=2%


Now that we have understood the analysis part, next, let’s focus on how to visually present the keyword ranking dashboard to your clients.
Enhance Data Clarity with Colors, Titles, and Annotations
- Open Theme and Layout to apply consistent branding to your dashboard.
- Use consistent colors across charts to make the report easier to understand.
- Use Manage Dimension Value Colors to keep the same colors for each position group across all charts.
- Assign a clear title for every chart.
- Titles should describe what the chart shows, not just the metric name.
- Add a short description or subtitle explaining the chart.
- Add notes when important changes occur.
These small improvements make your SEO keyword ranking dashboard easier to understand and visually compelling for your clients and stakeholders.
How to Share and Export Your SEO Keyword Ranking Report?
Your SEO keyword ranking report is now ready to be shared across your internal team, clients, and stakeholders. Here’s how you can do:
1. Share live link:
If you want to share your keyword ranking report with a specific set of clients or groups, click the Share button at the top right and grant access to the recipients. By enabling advanced sharing settings, you can:
- Prevent editors from changing access and adding new people.
- Disable viewers from generating slides with Gemini in Looker.
- Disable copying for viewers.
- Disable viewers from viewing and creating alerts.
When to use: Use this option when you want to give specific clients or team members direct access to your keyword ranking dashboard.
2. Embed the report
This is a good option if your client prefers to have the report natively in their portal, tracking real-time changes without having to manually open links. This improves accessibility and creates a seamless experience wherein agencies feel that they are a part of the client’s reporting ecosystem. You can either embed using code or via URL in the preferred site.
When embedding works best:
- You run an agency-client portal.
- Clients check the dashboard regularly.
- Maintain all client assets in one place.
3. Export as PDF
You can save a snapshot of your keyword ranking report by downloading it as a PDF. Once downloaded, you can share the file offline using email, print it, or do anything based on your reporting preferences.
For multi-page reports, you can download all pages in the report or select specific pages. You can also rearrange the pages in the PDF output by dragging them in the specific order.
4. Schedule email delivery
If you wish to create a personalized schedule for sending the report, you can schedule your report for email delivery by clicking on Share → Schedule delivery at the top right corner of your Looker Studio dashboard.


You can add the recipients, include the list of pages, enter the start date, specify the schedule, time, and the timezone. Once set, click Save, and your report will be scheduled for email delivery. The email will contain the PDF attachment of your report, along with the preview of the first page and a link to view the complete report.
Agency Tip: Before sharing your Looker Studio dashboard, set a default date range (eg, last 30 days) and apply clear chart labels and annotations for key SEO metrics. This ensures clients immediately see the most relevant insights when they open the report, reducing confusion and unnecessary back-and-forth questions.
Top Google Search Console Looker Studio Templates for Streamlining Keyword Performance
1. Google Search Console Overview Report

This Google Search Console template in Looker Studio gives you a clear overview of your website’s search performance through key metrics like impressions, clicks, CTR, and average position. With interactive charts and filters for queries, pages, countries, and devices, it helps you quickly identify what drives your rankings and optimize your SEO strategy.
2. Google Search Console Dashboard
Gain a clear view of how your website performs in search results with this GSC Looker Studio template. It lets you track and visualize key metrics like impressions, clicks, and CTR through customizable scorecards, line charts, and bar charts segmented by country and device type. You can also compare these metrics across queries and pages to uncover audience intent and refine your SEO strategy.
Optimize Keyword Ranking With Actionable Performance Insights
Now that you know how to build a meaningful SEO keyword ranking report in Looker Studio, the real impact comes from turning those insights into clear optimization opportunities and client-ready reporting.
Before you start building your Looker Studio keyword ranking report, keep these points in mind:
- Prioritize keywords close to page one.
- Evaluate ranking distribution, not just individual keywords.
- Separate branded and non-branded queries in reporting.
- Highlight pages with visibility but weaker engagement.
- Present only the most relevant and meaningful charts to your clients.
- Use the report to guide ongoing SEO experiments.
- Review the report regularly, not just monthly.
A well-structured SEO keyword ranking report acts as strong evidence to proceed with confident optimization decisions. With Two Minute Reports, you can accomplish this by streamlining keyword rankings and analysis across multiple clients in a single Looker Studio dashboard, eliminating manual exports while keeping performance insights consistently updated and ready for reporting and decision making.
Ready to optimize your search visibility? Connect your Google Search Console account with Two Minute Reports and see how you can generate client-ready keyword ranking reports in minutes. Start your 14-day free trial and experience the difference for yourself.
Frequently Asked Questions
A keyword ranking report in Looker Studio is a structured dashboard that tracks how your website’s search queries perform over time. It connects directly to Google Search Console and visualizes keyword-level metrics such as clicks, impressions, average position, and CTR.
A Looker Studio keyword ranking report visualizes trends and allows for date comparisons, filtering, and consistent reporting across accounts, while a Google Search Console export provides raw data that is static and requires manual work to analyze and interpret.
Before you can create your Keyword Ranking Report, you should have a verified Google Search Console property, access to Looker Studio with your Google account, a minimum of 2 to 4 weeks of Google Search Console data, and integration of your GSC accounts with Two Minute Reports for centralized tracking and reporting.
To create your Keyword Ranking Report, start by linking Google Search Console as your data source through Two Minute Reports. Then, set up your GSC account, choose the required metrics and dimensions and include custom visualizations to analyze keyword performance and ranking trends over time.
You can easily share your report by creating a live link, embedding it in a client portal, exporting it as a PDF, or even scheduling regular email updates. This way, you can keep your clients and stakeholders informed without any hassle.
Related Blogs


Meet the Author
Shalini MuruganShalini is driven by ideas that create a tangible impact. At Two Minute Reports, she specializes in content that helps marketers optimize their reporting workflows. When she's not transforming complex data into meaningful insights, you might find her lost in a book, jotting down ideas in her notebook, or connecting the dots others overlook.
