
Summarize this blog post with:
Want to integrate TikTok Organic with Google Sheets and build a centralized view of your client’s performance? You’ve landed in the right place. Two Minute Reports lets you sync your TikTok Organic data into Google Sheets automatically, so the latest performance insights are always ready to share without manual overhead.
How to Connect TikTok Organic to Google Sheets?
You can connect TikTok Organic data to Google Sheets through the Two Minute Reports Hub. It is your centralized workspace for managing all your connections, clients, and destinations. Here’s how to get started:
Step 1: Creating a Connection
1. Go to hub.twominutereports.com and click Connections → Create Connection.
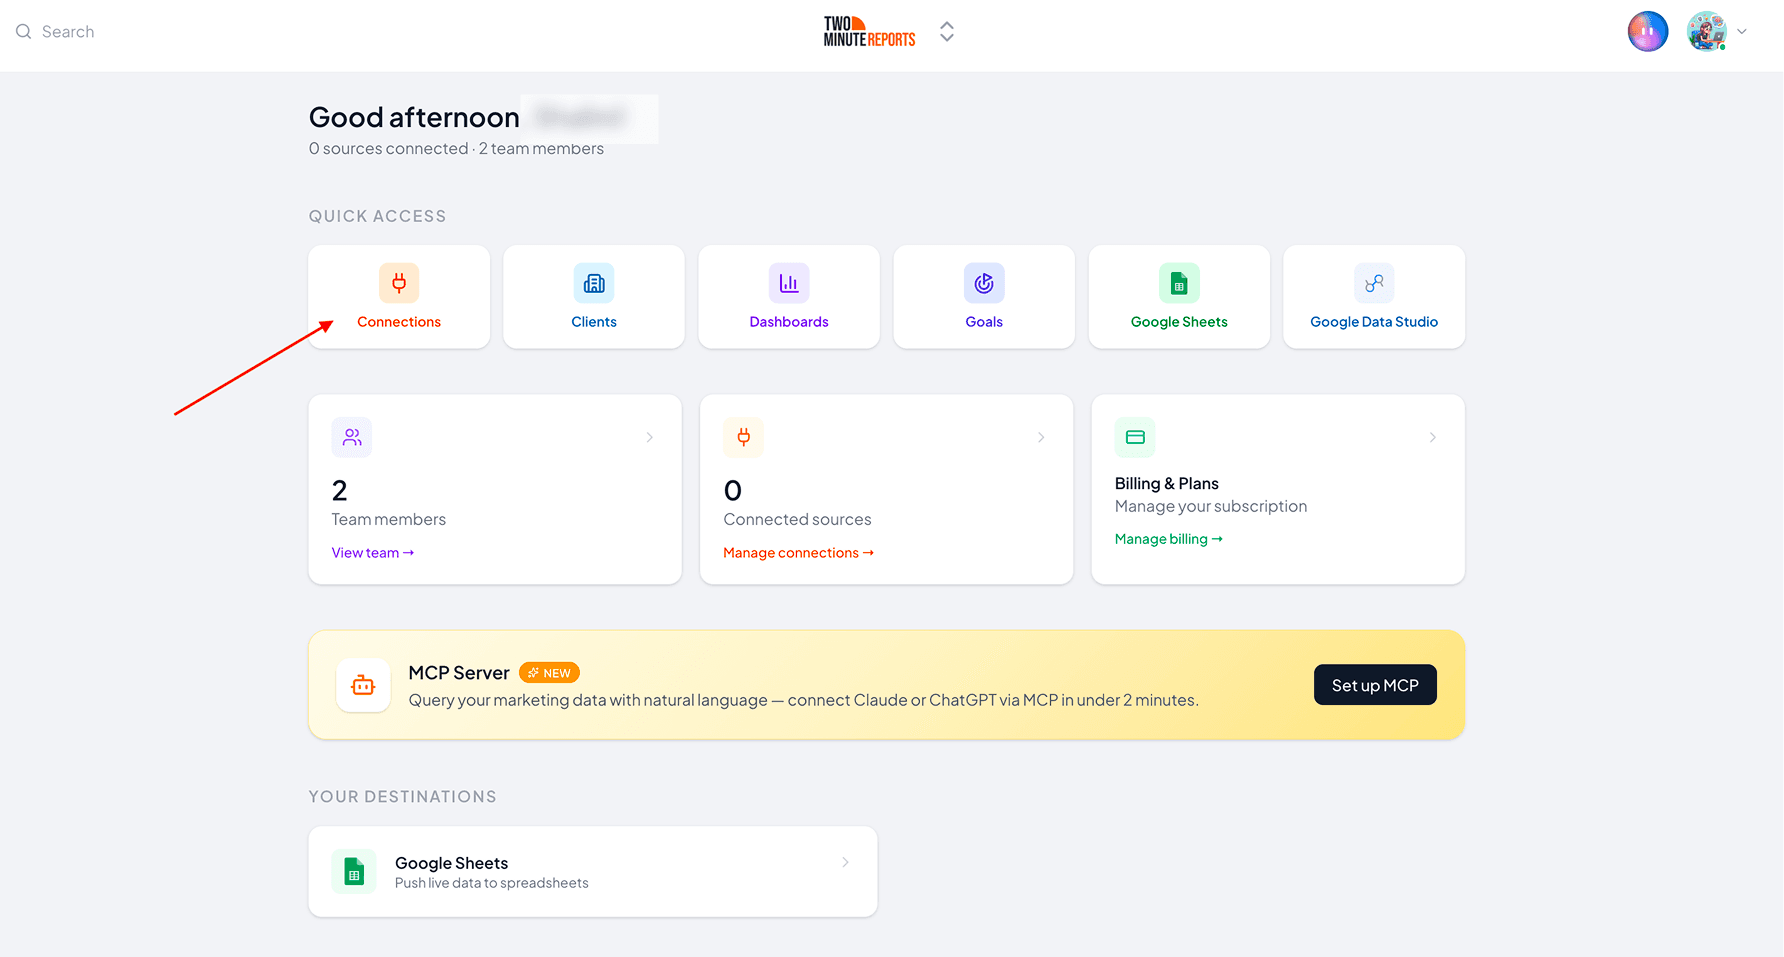
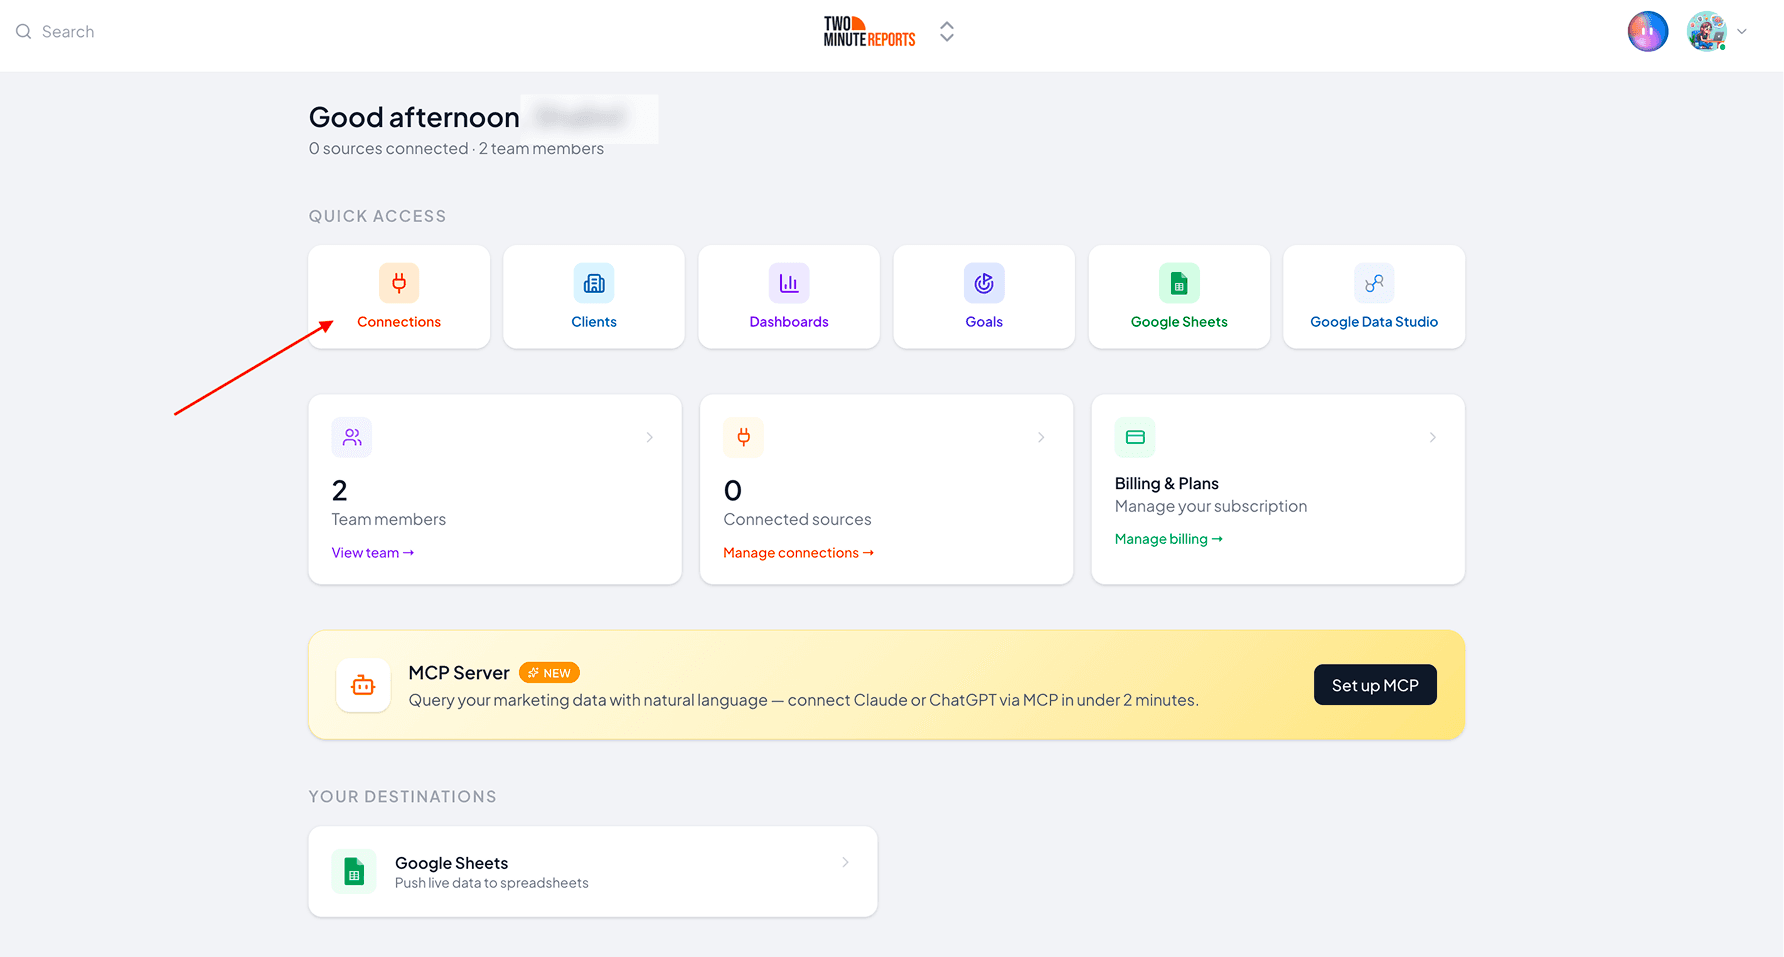
2. Inside the dialog box, complete these three steps:
- Select the TikTok Organic Connector from the list of options.
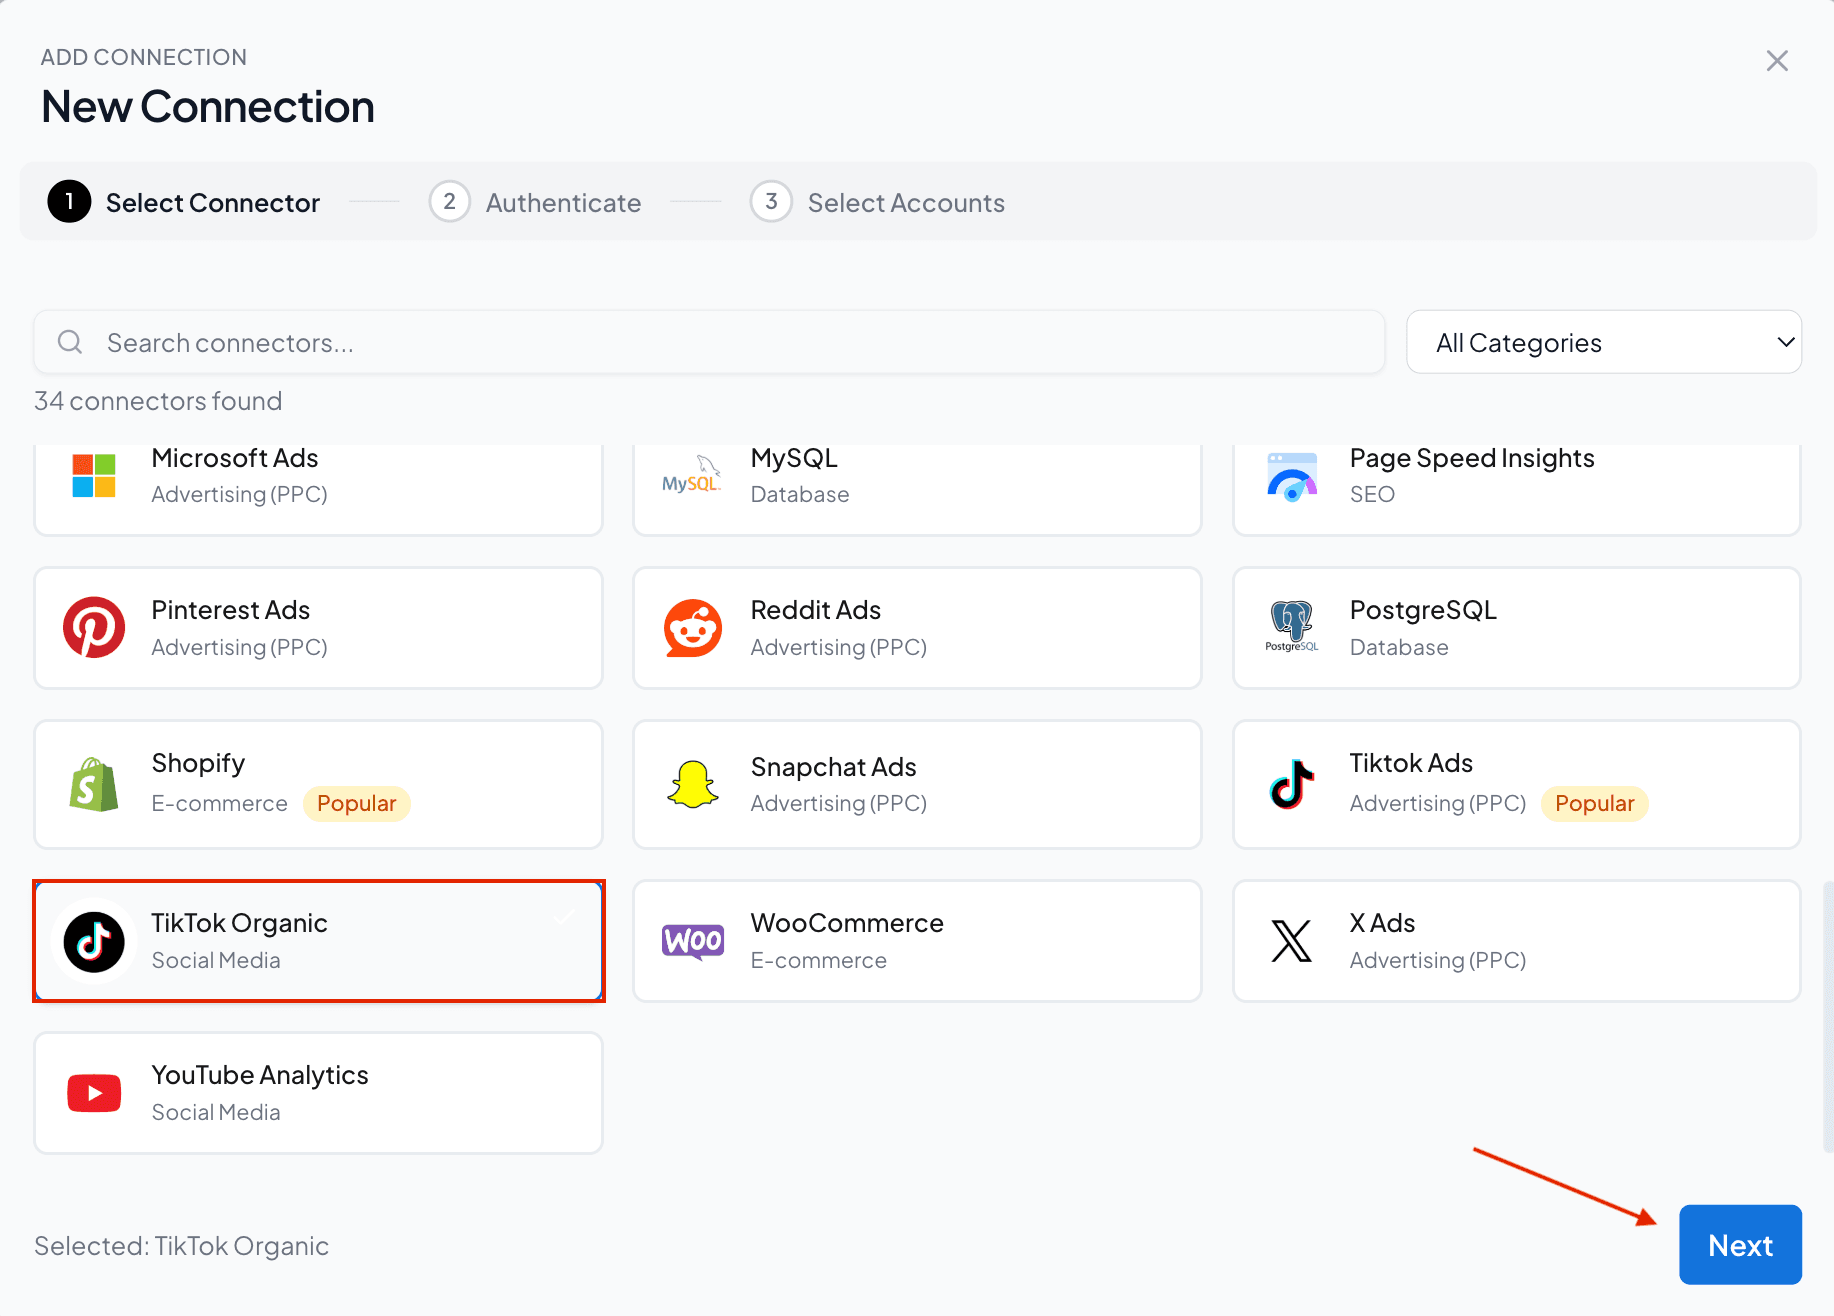
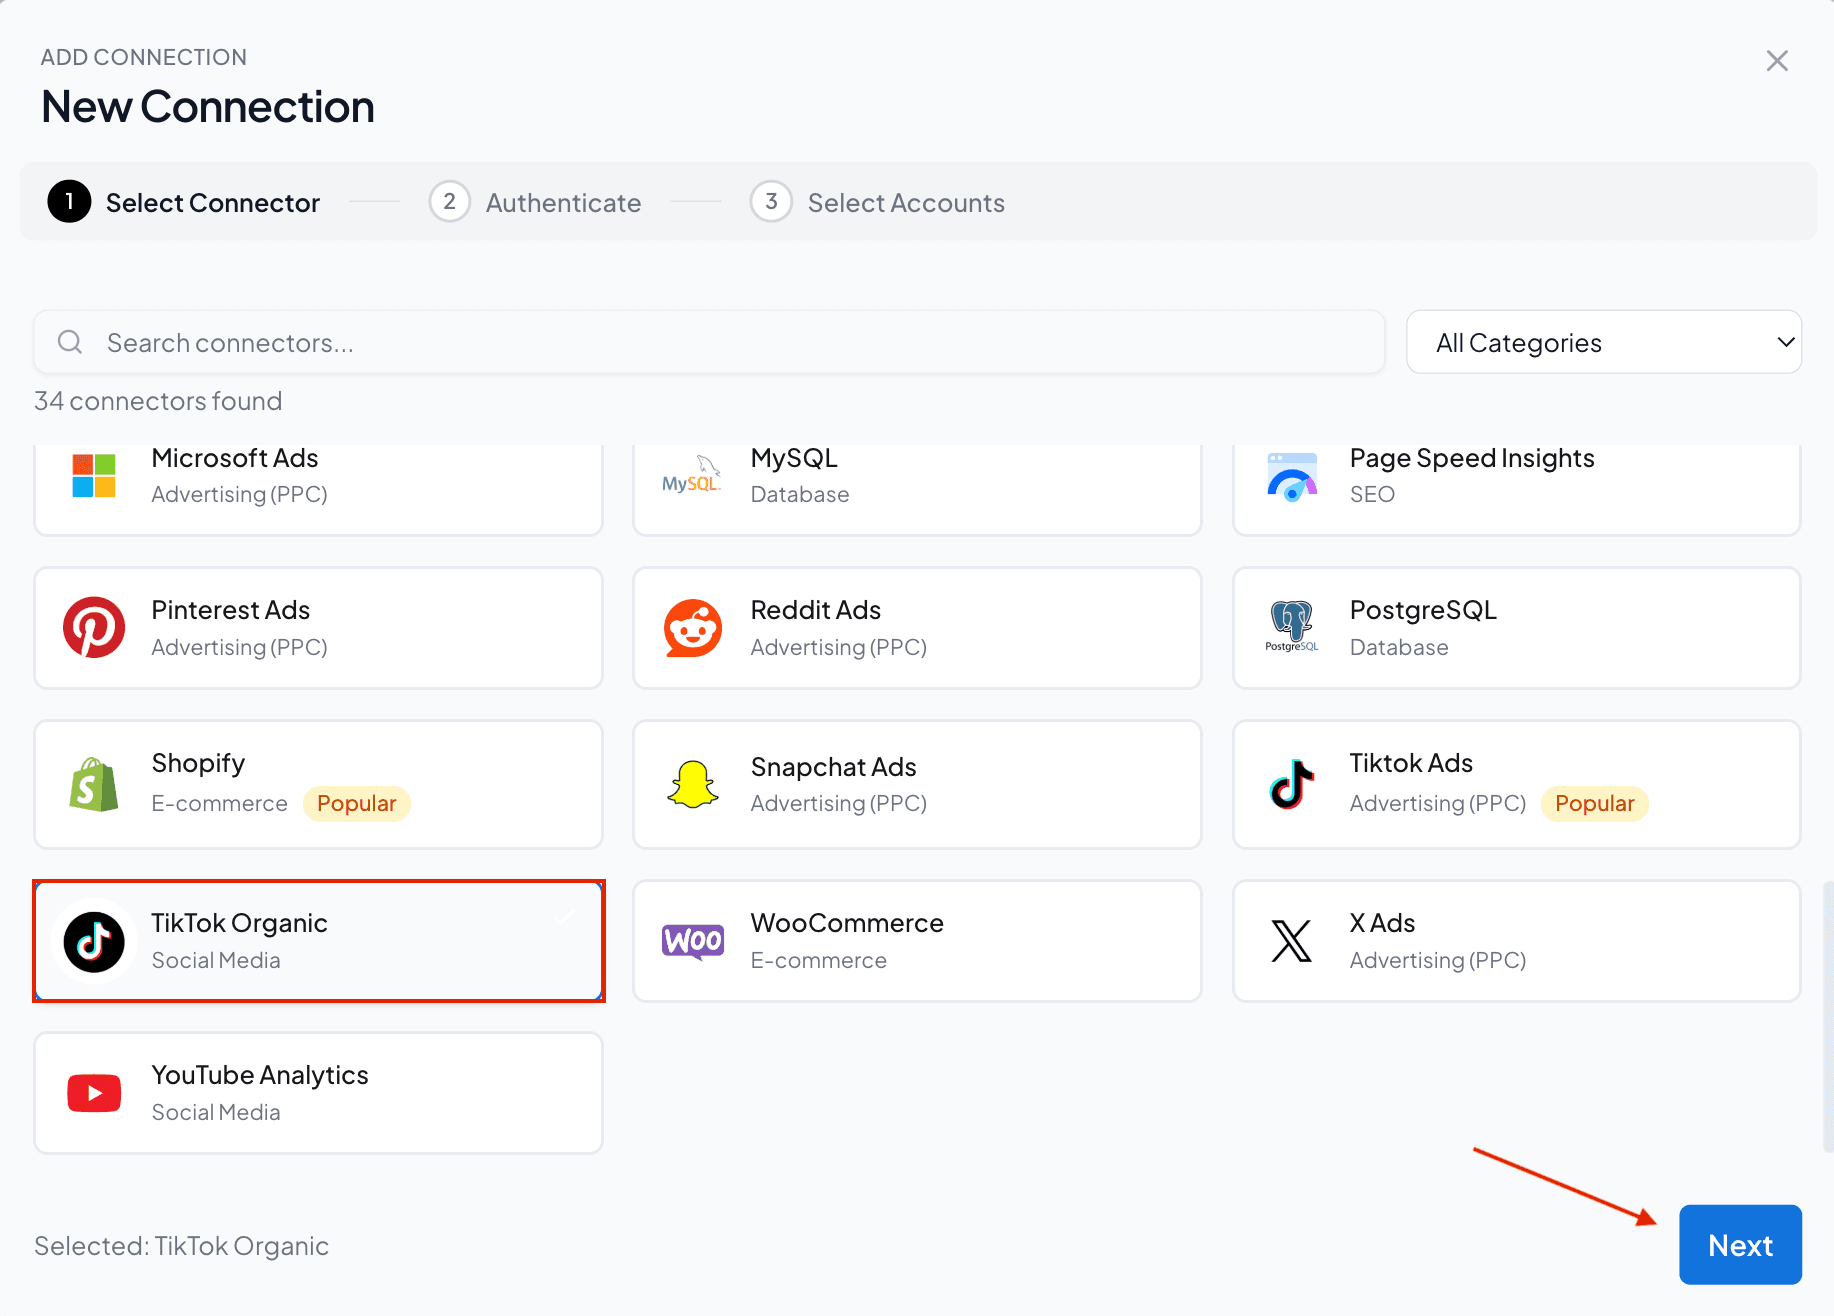
- Enter the name of your Connection and authorize it by logging in with your credentials.
- Enable the TikTok Organic accounts you want to measure performance. Please note that you can’t query disabled accounts.
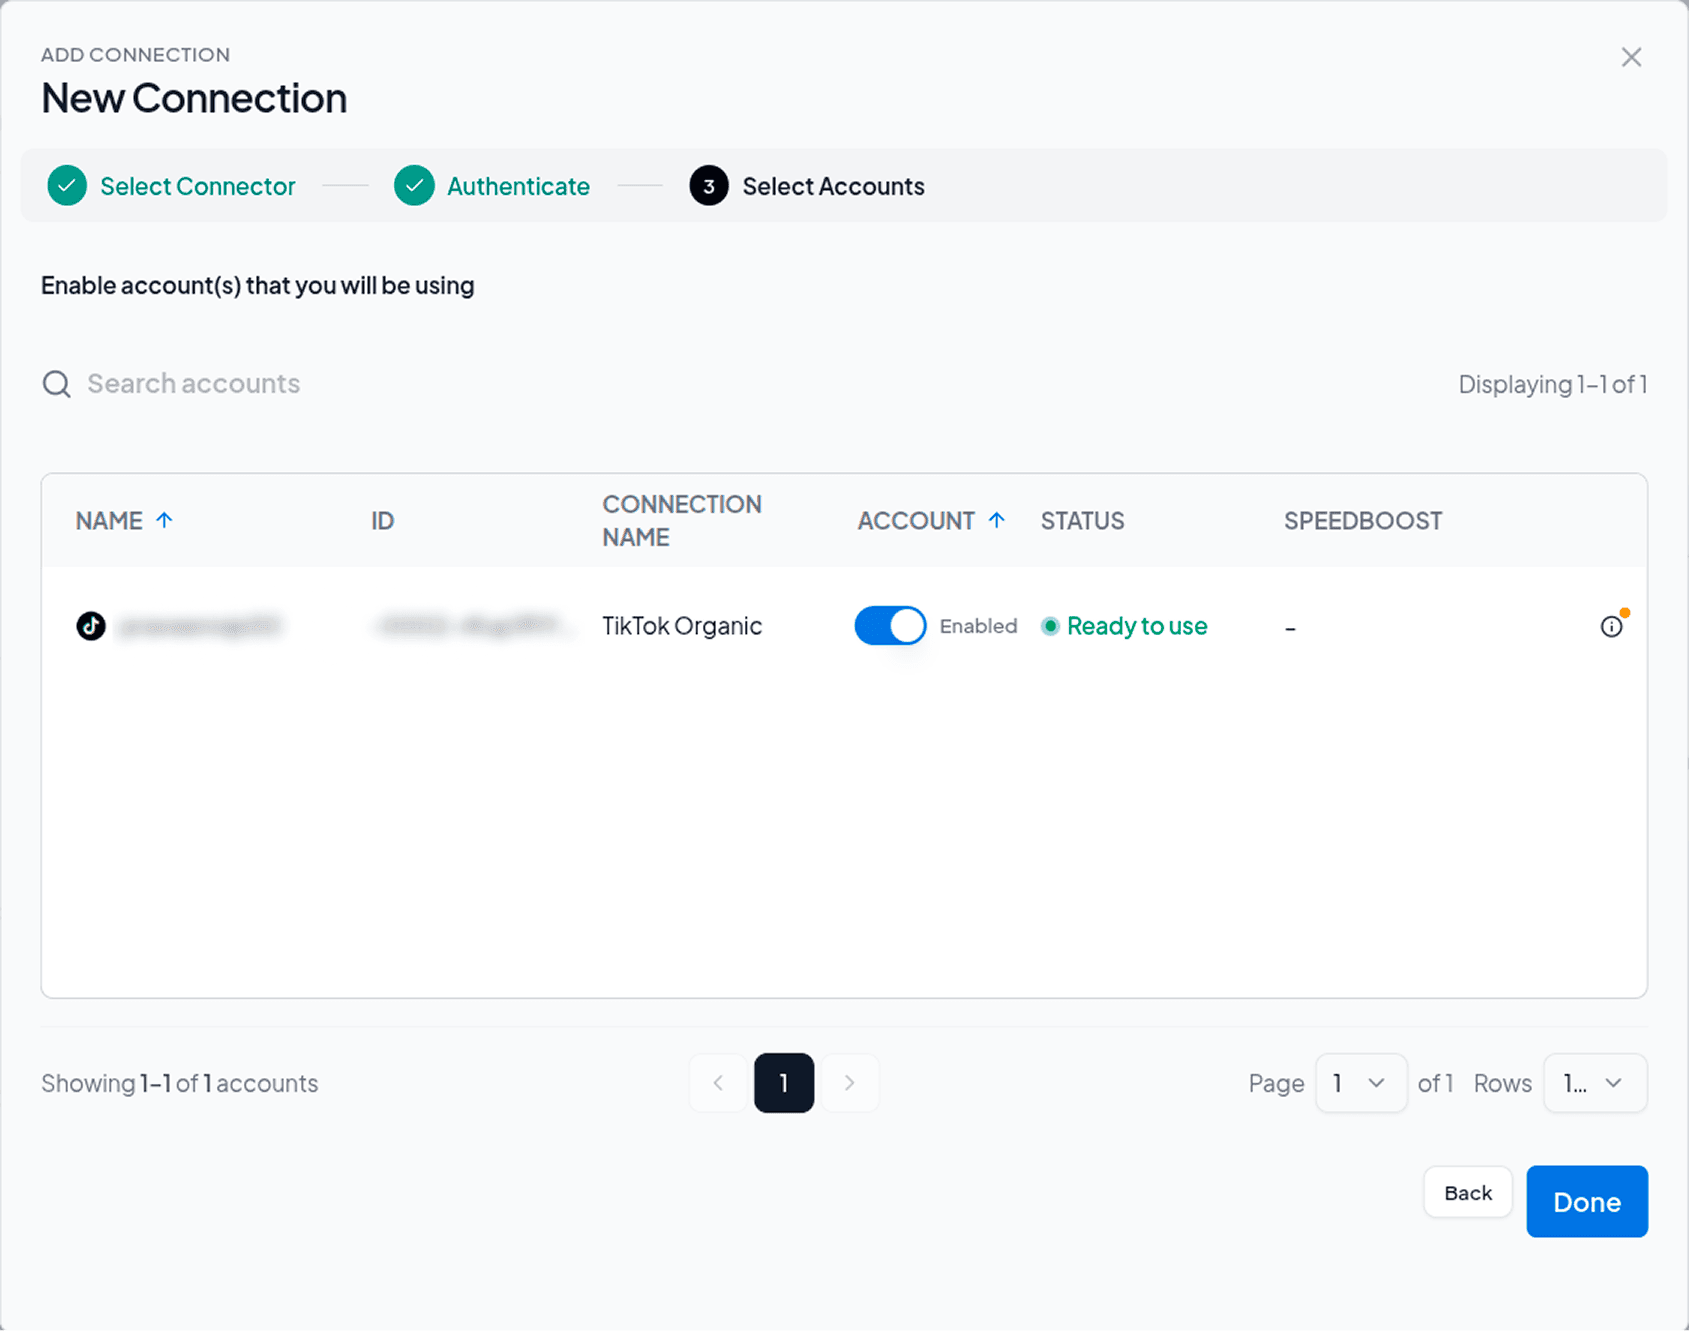
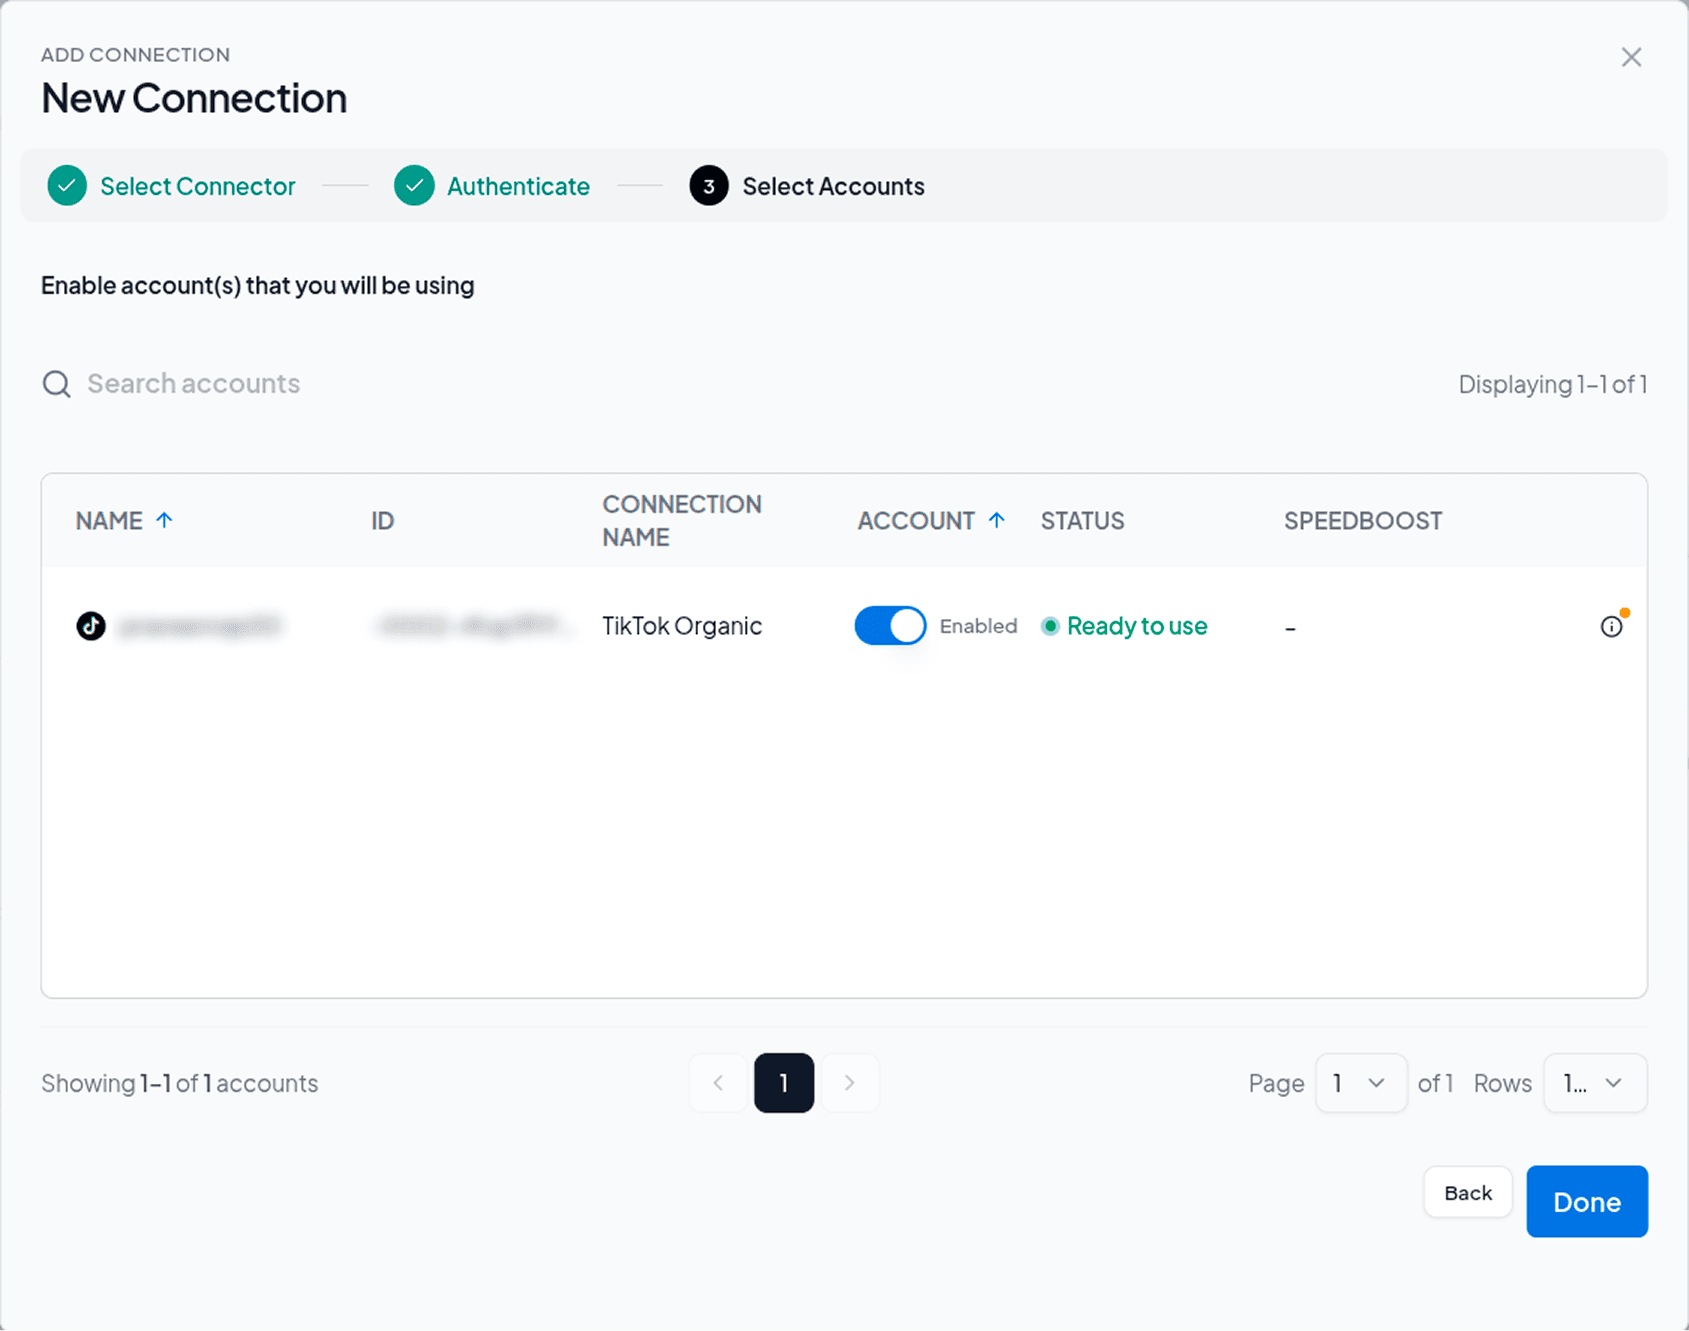
Note: With Speedboost, you can handle high-volume TikTok Organic datasets and create blazing-fast reports without any delays. This is a proprietary technology of Two Minute Reports built to scale client reporting.
3. Once done, navigate back to the Hub Homepage and click Google Sheets → New Google Sheets Report.
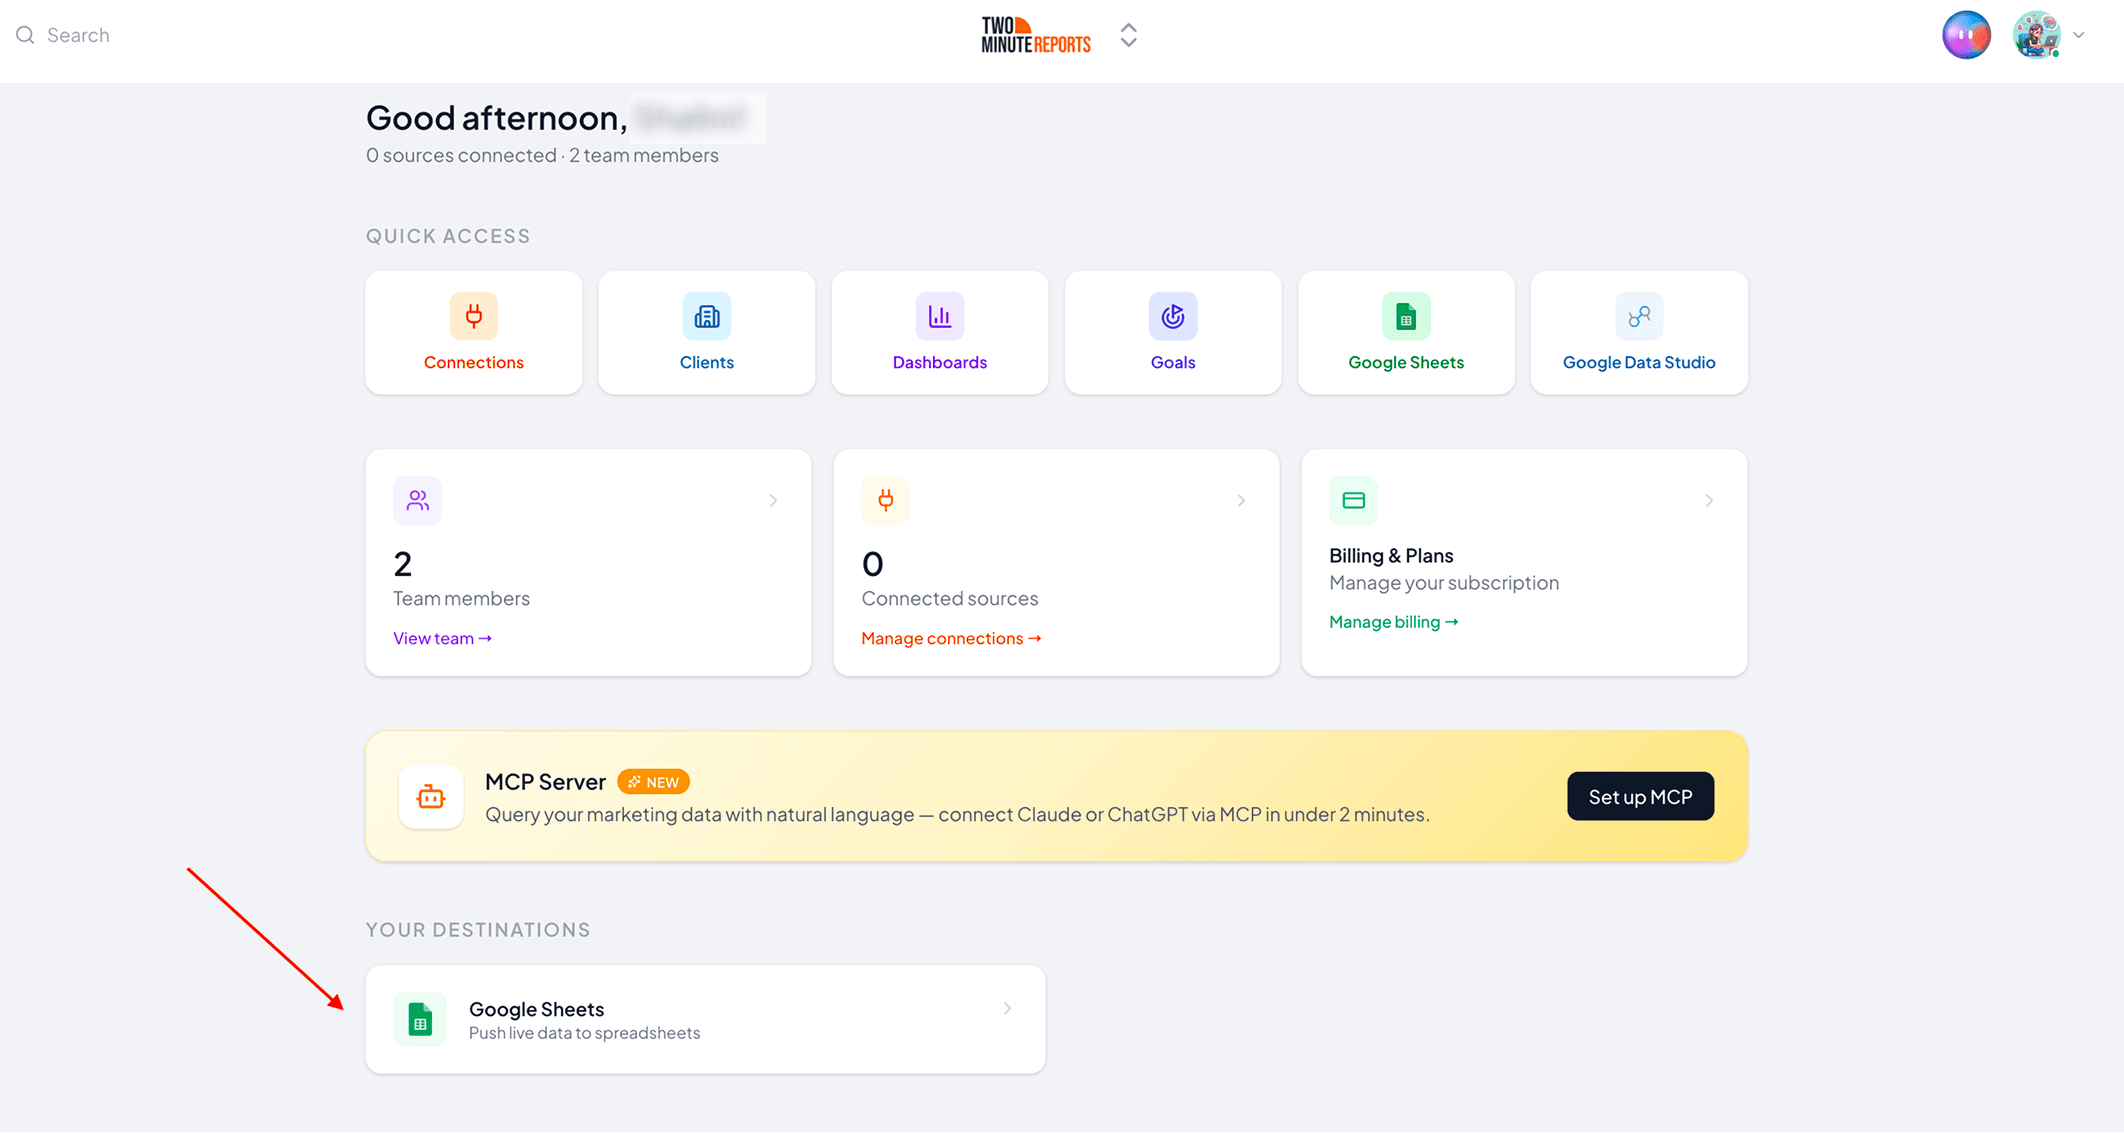
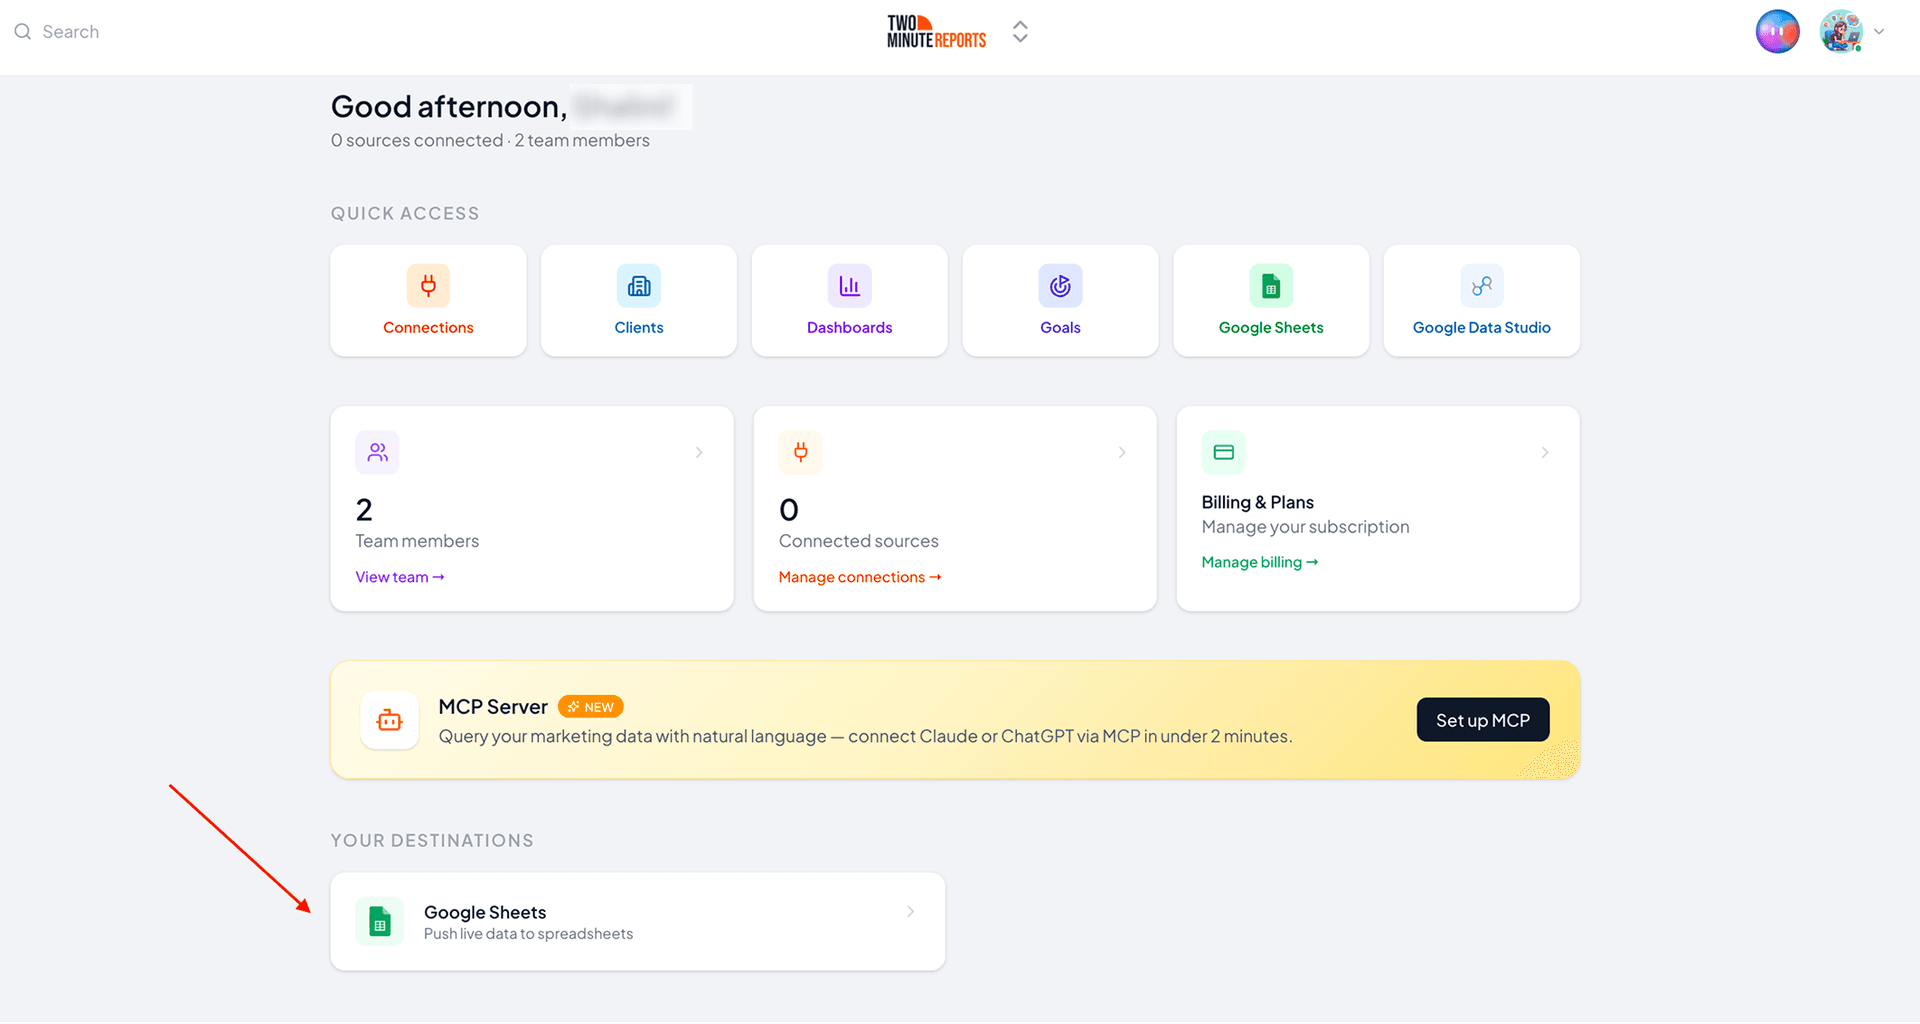
4. Click Use Template and follow the on-screen instructions to launch the Two Minute Reports add-on in your spreadsheet.
Step 2: Configure and Run Your Query
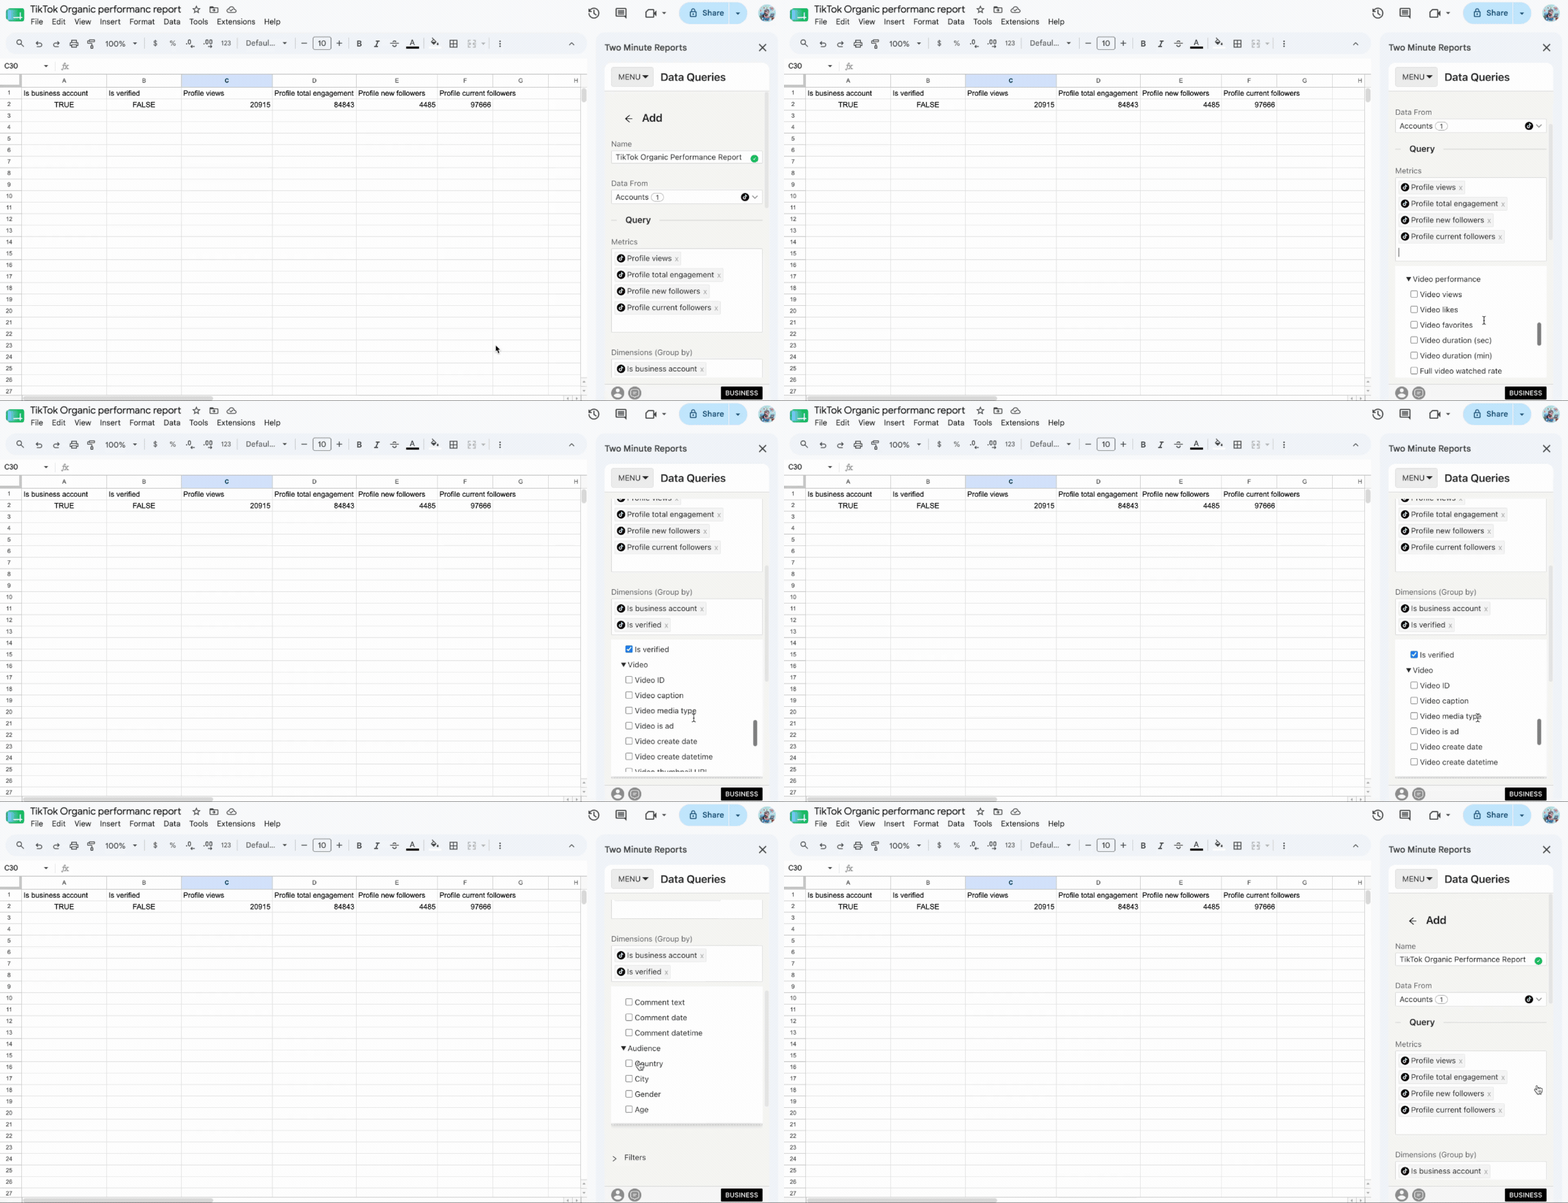
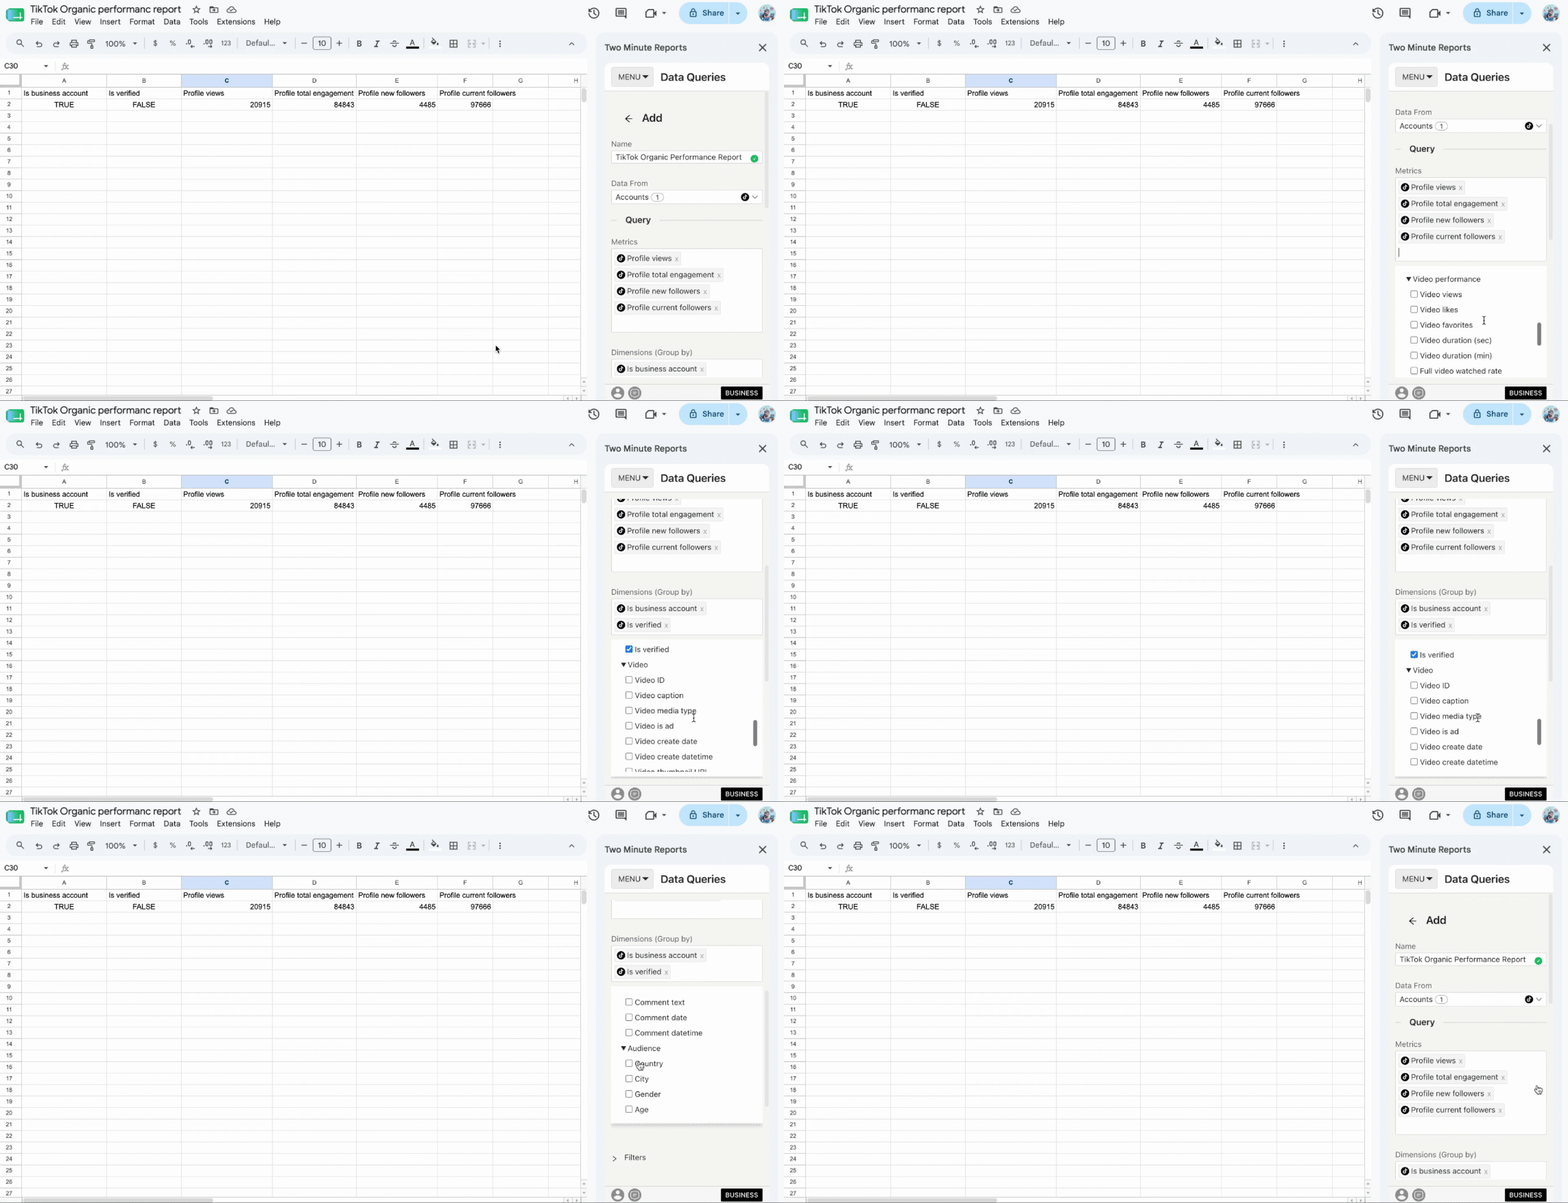
1. Once you’ve installed the add-on, navigate to Menu → Data Queries and click Add.
2. Select the TikTok Organic accounts you want to include from the sidebar.
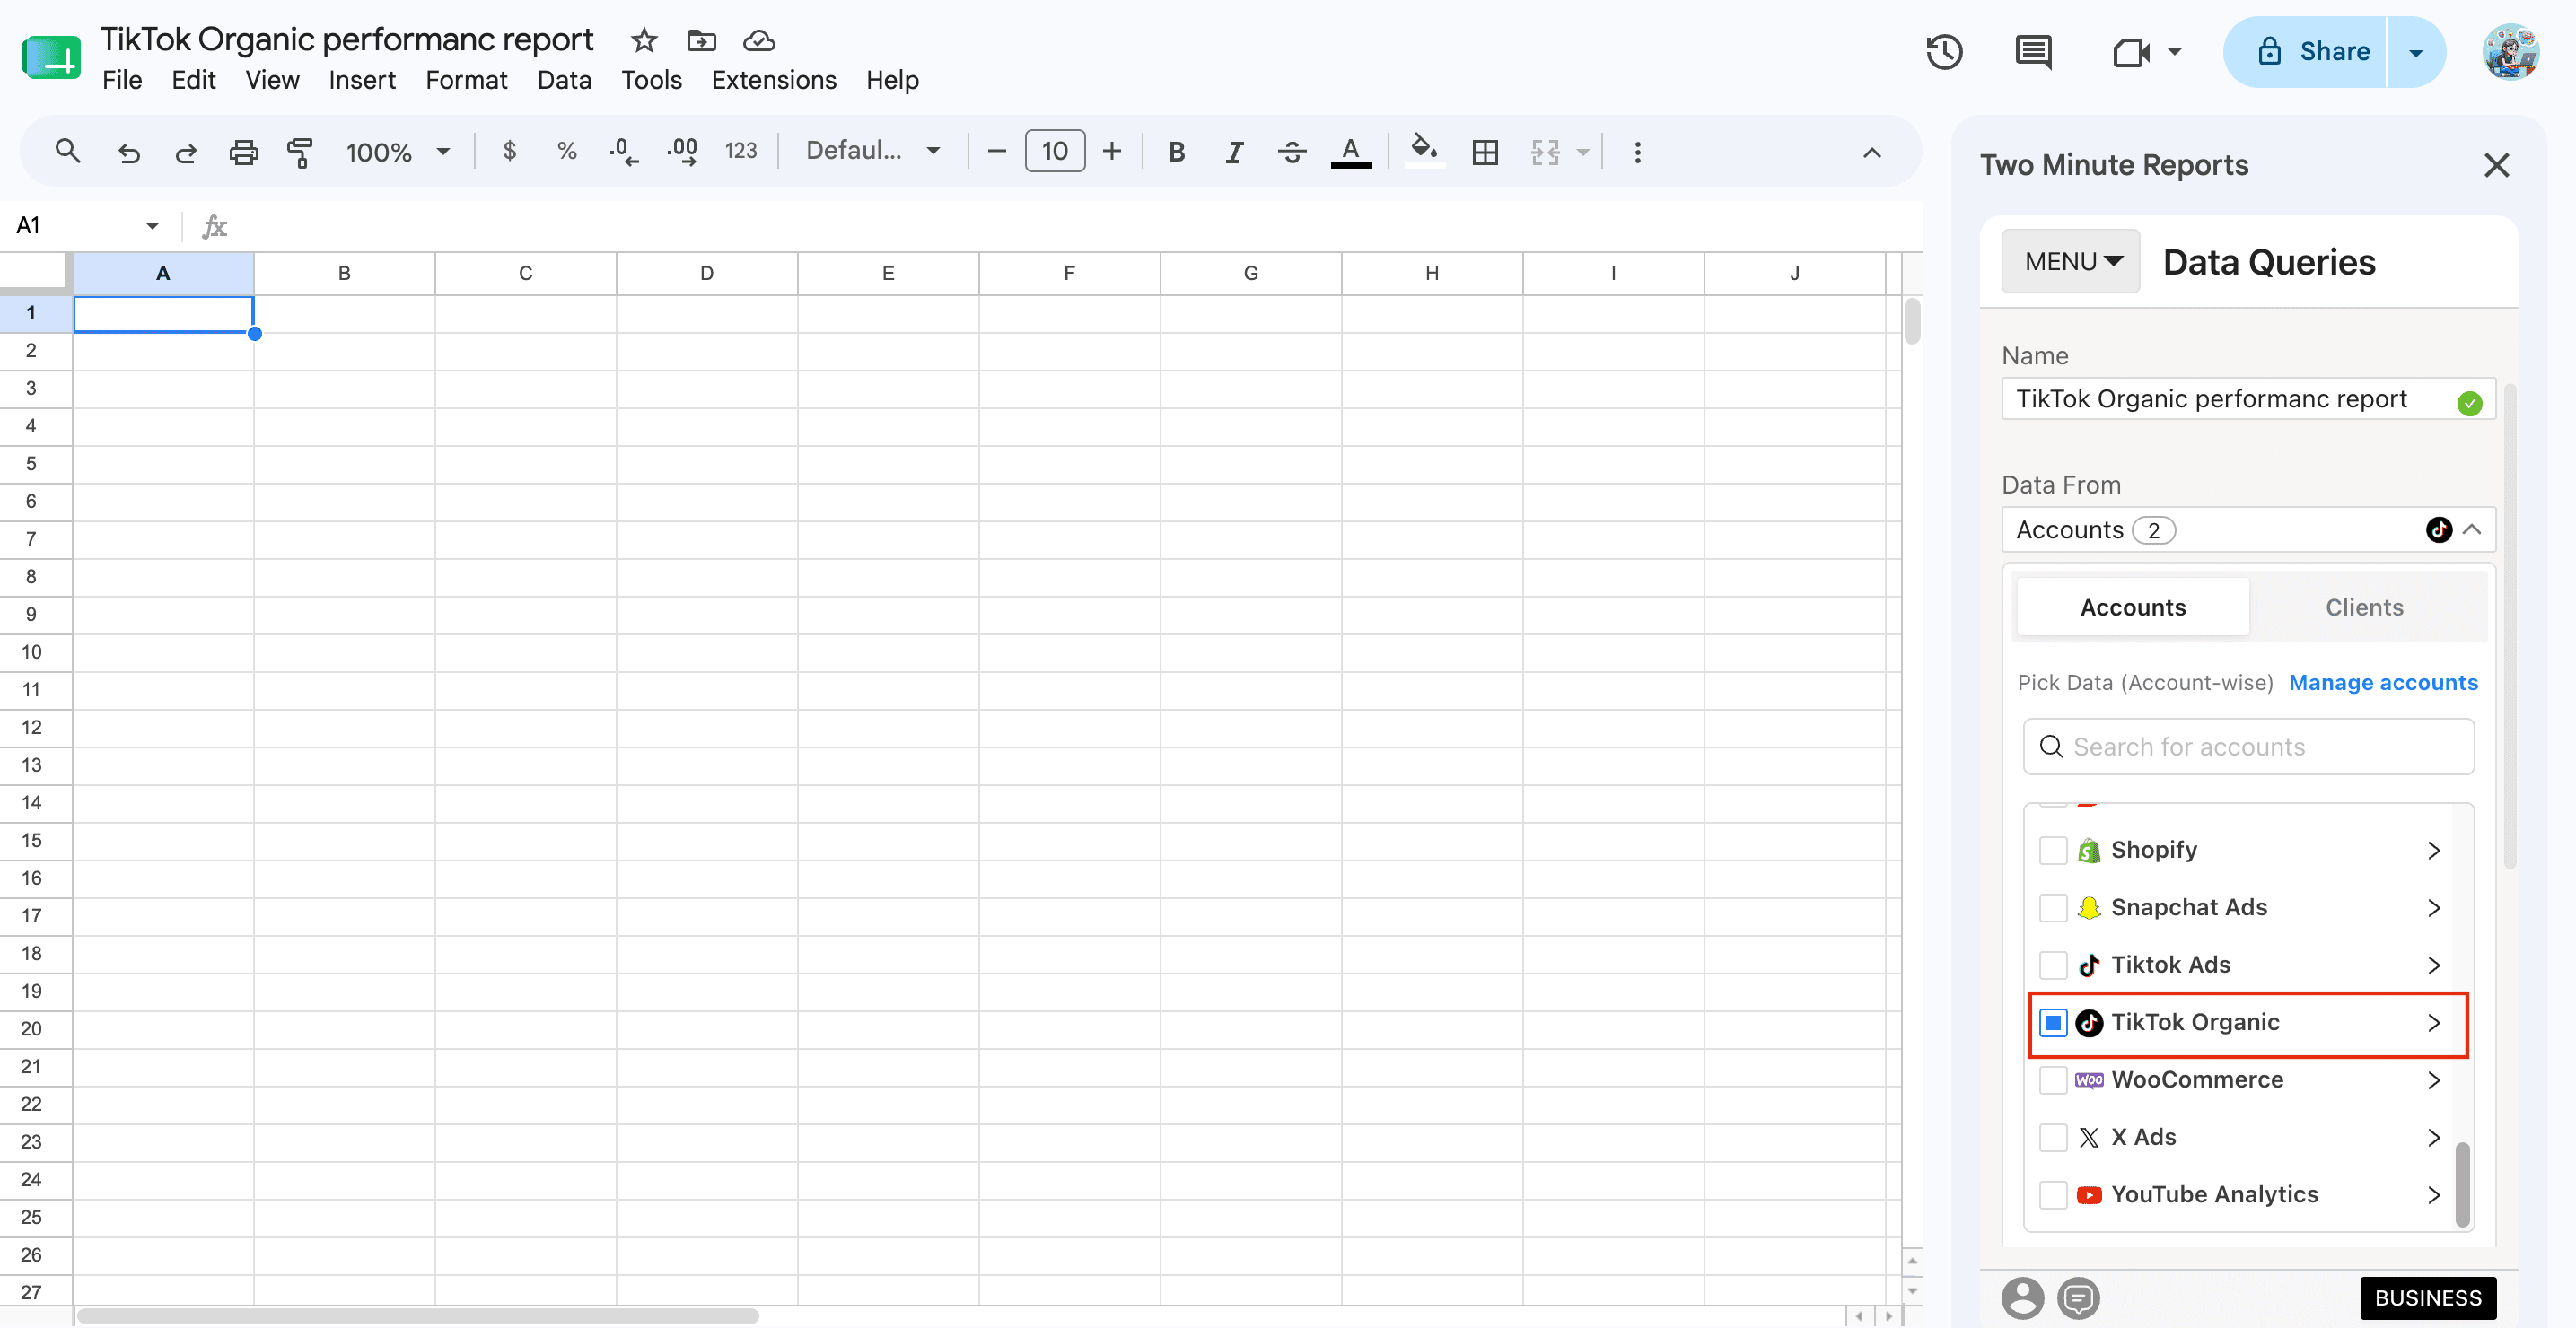
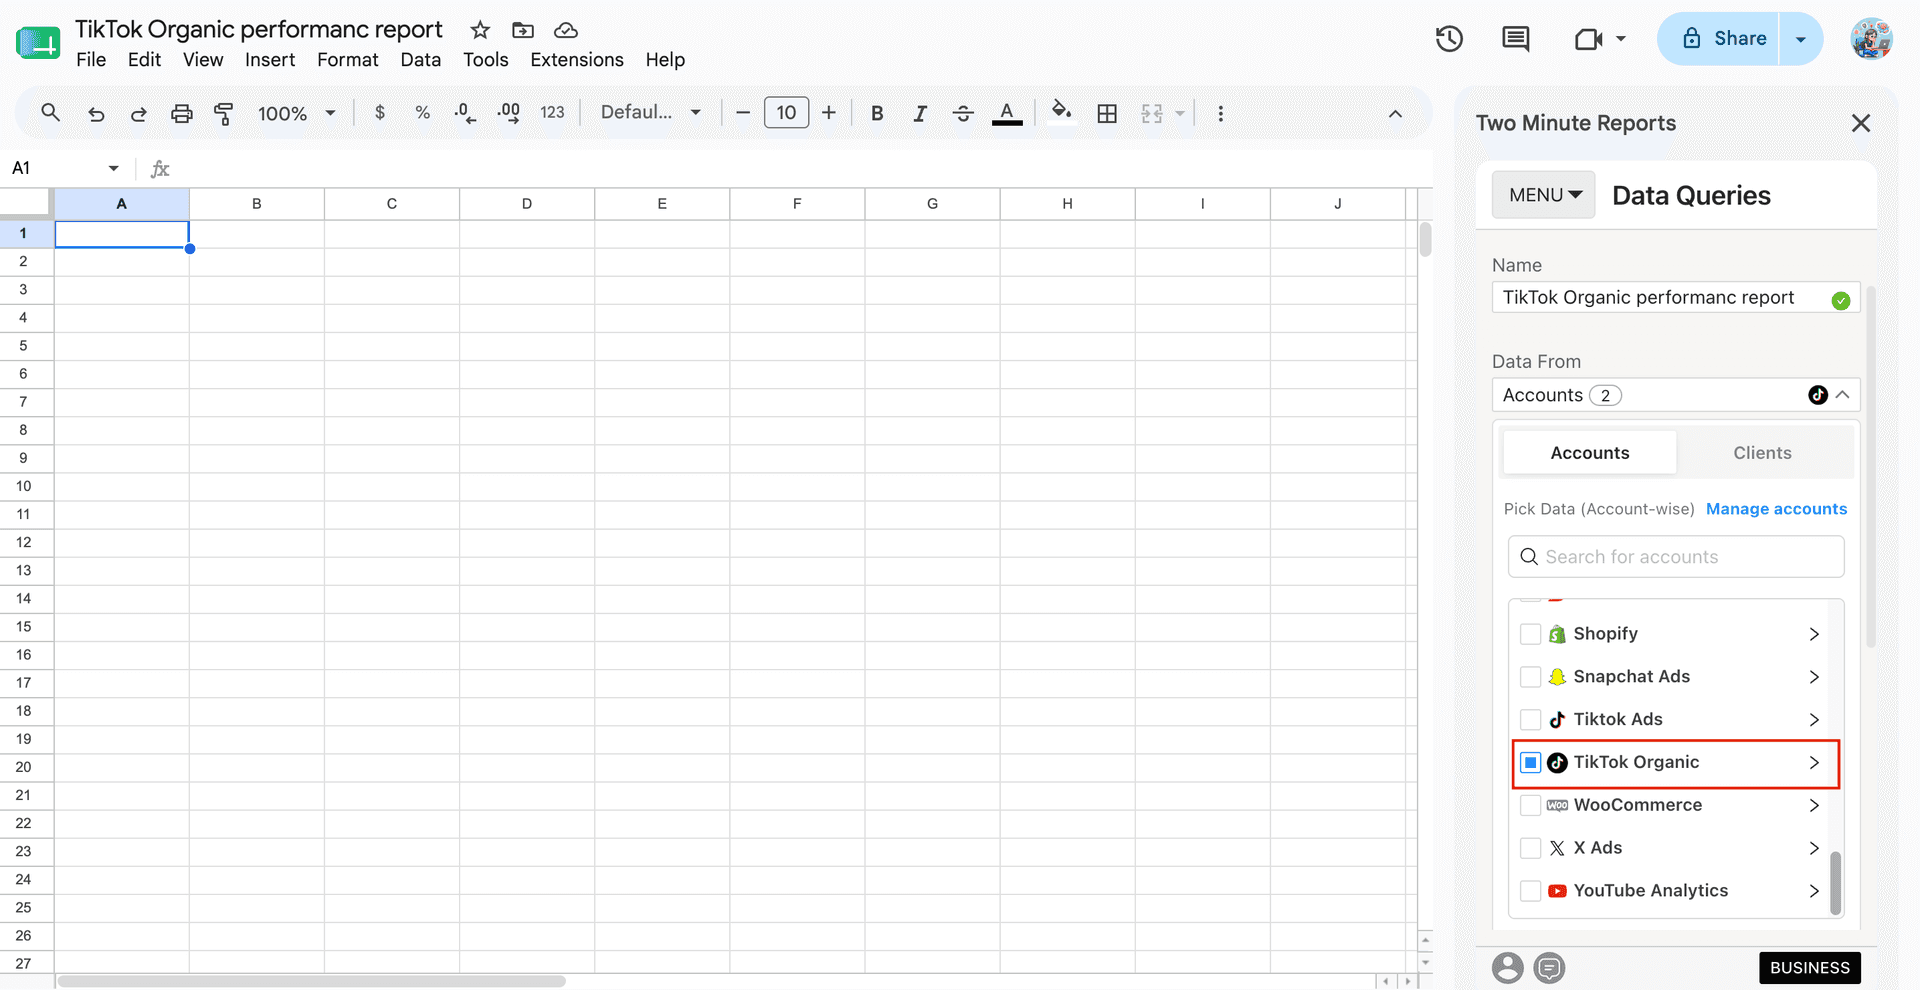
3. If you're managing multiple clients, go to Clients → Manage Clients, map your TikTok Organic accounts to the relevant clients and click Save & Close.
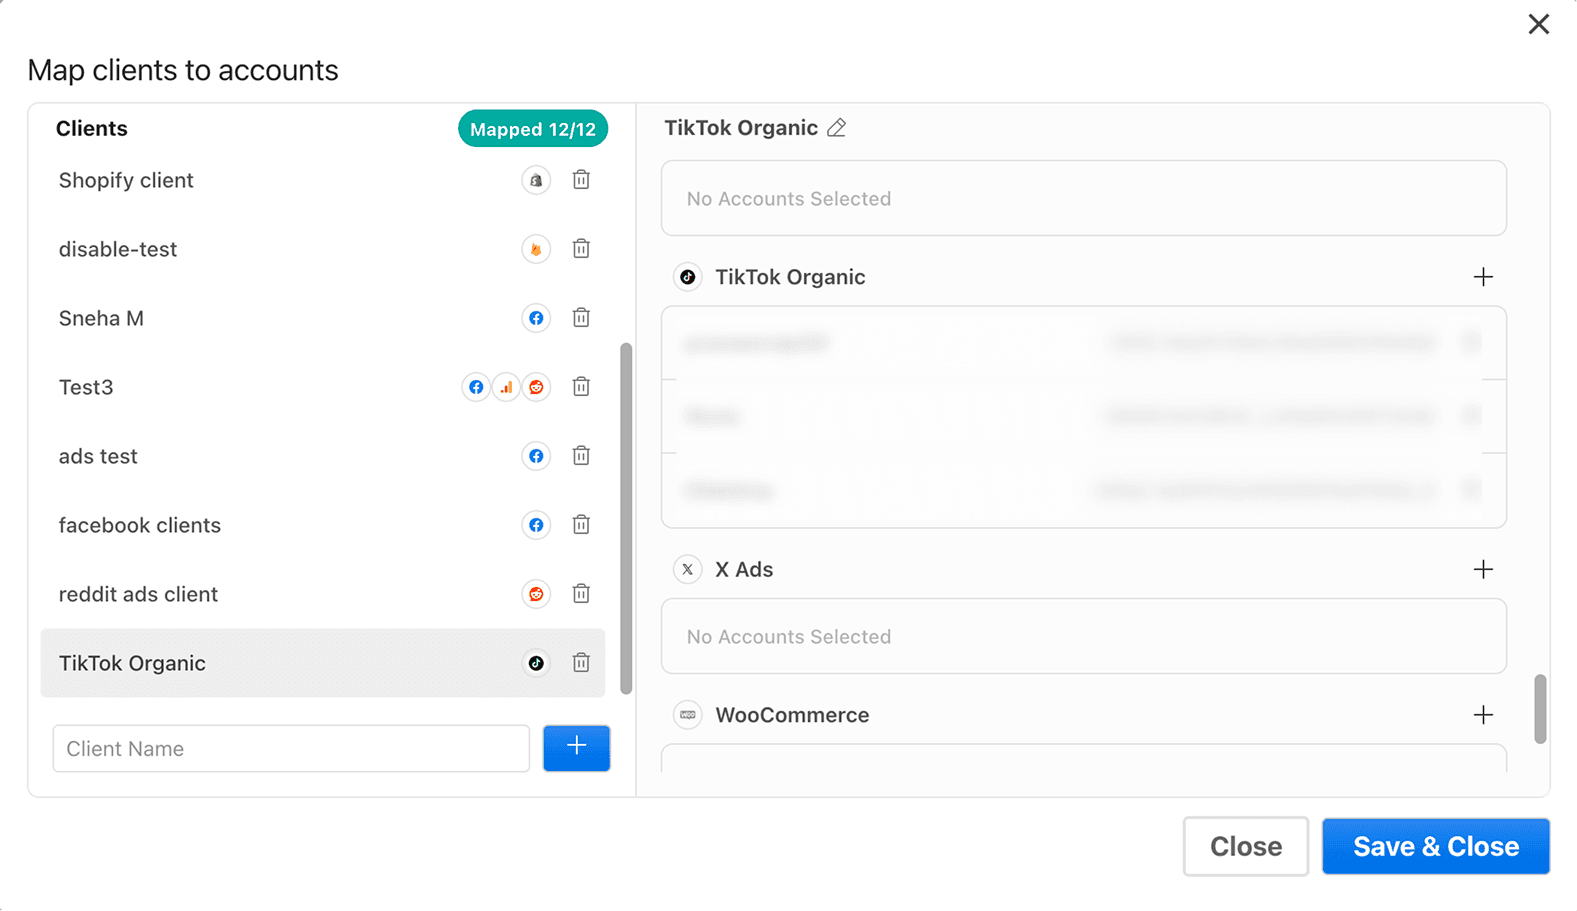
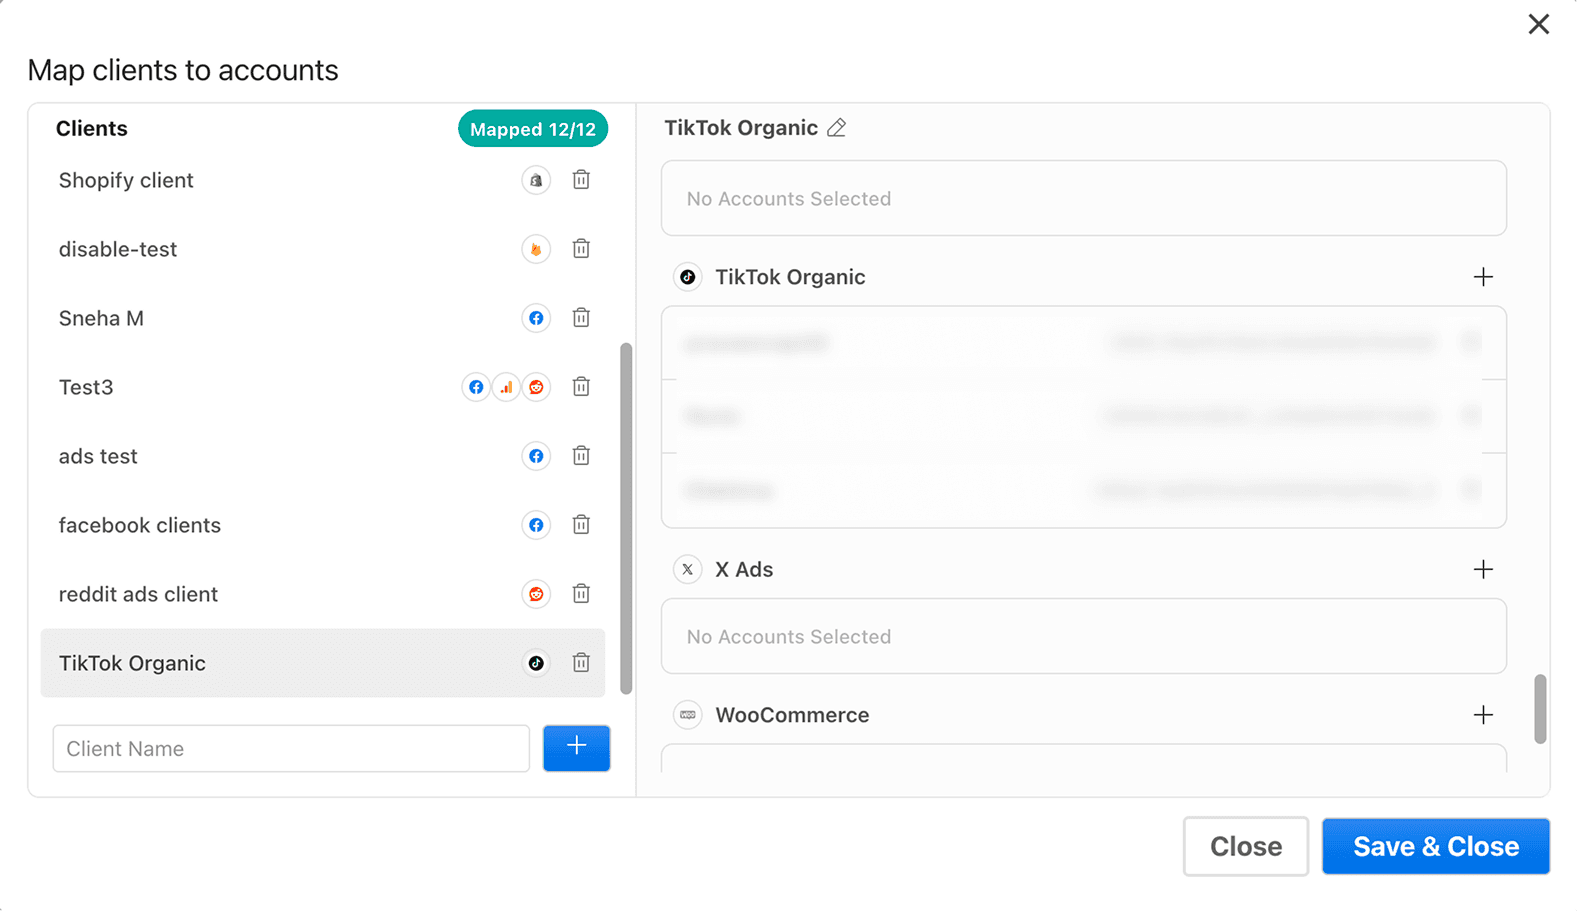
4. Choose relevant TikTok Organic metrics and dimensions and select your date range.
5. Click Run Query to pull the data into your chosen sheet and cell.
Pro Tip: You can set up custom refresh schedules to automate daily, weekly and monthly TikTok Organic performance reporting to your clients. Choose your preferred format – PDF, Excel or Spreadsheet and keep reports updated automatically without manually exporting data every time.
Prefer to work directly inside Google Sheets? You can also connect TikTok Organic to Google Sheets by installing the Two Minute Reports add-on from Google Workspace Marketplace, following the steps below:
- Open a spreadsheet. Launch the add-on from Extensions → Two Minute Reports → Launch.
- Click Menu → Connections → Add and select the TikTok Organic connector.
- Authorize your account and enable the accounts you want to query.
- Click Refresh Connections to confirm your accounts appear in the sidebar.
Once connected, follow the same query steps above to start pulling your TikTok Organic data directly into Google Sheets.
How to Analyze TikTok Organic Data in Google Sheets?
Once your TikTok Organic data is connected to Google Sheets via Two Minute Reports, you can work with a wide range of metrics and dimensions to analyze and optimize your content performance. Here’s how you can do it:
1. Profile Performance & Follower Growth
Metrics: Profile views, Profile total engagement, Profile likes, Profile comments, Profile shares, Profile new followers, Profile daily lost followers, Profile daily total followers, Profile reached audience, Engaged audience, Profile current followers.
Dimensions: Date, Profile display name, Profile username.
Analysis: Measure audience growth by comparing new followers with daily lost followers, and analyze engagement trends alongside profile views to understand what drives audience interaction. For cumulative metrics like Current Followers, Profile Likes, and Following Count, use the latest day's value rather than summing the column, since each row already reflects the total to date.
2. Video Content Performance
Metrics: Video views, Video likes, Video favourites.
Dimensions: Video caption, Video ID, Video media type, Video is ad, Video create date, Video thumbnail URL, Video share URL.
Analysis: Sort videos by views, then check likes and favourites next to them. Plenty of views but almost no favourites mean your video got seen but didn’t land. Use Video is ad to drop anything boosted, and media type to compare formats.
3. Video Watch-Time & Retention Depth
Metrics: Full video watch rate, Average time watched (s), Total time watched (h), Video duration (sec), Video views.
Dimensions: Video caption, Video ID, Video media type, Video create date.
Analysis: Compare the Full Video Watch Rate and Average Time Watch Rate with the video's length. A short video that people finish means your hook is working; a long one with a low watch rate means people drop off halfway. Put views next to the watch rate to catch videos that reach a lot of people but don't hold them. Compare by create date to see if your retention is improving, or by media type to see which format captures the audience’s attention.
4. Traffic & Action-Driving (CTA) Analysis
Metrics: Website clicks, Bio link clicks, Lead submissions, App download clicks, Email clicks, Phone number clicks, Address clicks.
Dimensions: Video caption, Video ID, Video create date, Profile username.
Analysis: See which videos actually get people clicking; links for traffic, leads and app downloads for the ones who want more. If views increase but clicks remain flat, your content is reaching people but isn't motivating them to take action.
5. Comments & Community Insights
Metrics: Comment likes
Dimensions: Comment text, Comment author display name, Comment username, Comment date, Video ID, Video caption.
Analysis: Get the comment text into the sheet so you can skim what people keep asking and how they react. Sort by likes for the top ones, and group by video to see which posts got people talking.
Ready to Export TikTok Organic Data to Google Sheets?
The value of a report depends on how quickly you can access the insights. When your data is always current, you can spot trends sooner, answer client questions with confidence, and make faster content decisions.
Two Minute Reports syncs 50+ TikTok Organic metrics directly to Google Sheets, giving your agency an up-to-date reporting dataset for multiple clients in one place. Every report, dashboard, and analysis starts with fresh data instead of another export.
Try Two Minute Reports free for 14 days and see how much faster TikTok reporting can be.
Frequently Asked Questions
You can connect TikTok Organic to Google Sheets in two ways. You can install the Two Minute Reports add-on from Google Workspace Marketplace or create a Connection in the Two Minute Reports Hub. Once done, you can enable the accounts for which you want to run queries and build data-driven TikTok Organic reports to make important decisions.
Two Minute Reports lets you pull over 50 TikTok Organic fields into Google Sheets, including profile views, followers, engagement, video views, full video watch time, average video watch rate, website clicks, audience demographics, comments, and more. You can segment the data by date, profile, video, country, city, age, gender, media type, and other dimensions to build custom TikTok Organic reports.
Once you’ve connected TikTok Organic and configured your queries, you can set up automated refresh schedules from the sidebar by selecting Menu → Schedule Refresh. Choose daily, weekly, or monthly refresh intervals, your preferred timezone and your updated TikTok Organic reports will be sent automatically to multiple clients instantly.
Yes. With the TikTok Organic reporting tool, you can connect multiple TikTok Organic accounts and manage them from a centralized workspace. You can enable specific accounts, organize them by client, and pull data into your Google Sheets dashboards for streamlined client reporting.
Yes. Agencies can create separate TikTok Organic connections for each client, map accounts using the Clients panel, and generate client-specific TikTok Organic Google Sheets reports from a single workspace. Automated refresh schedules make it easy to manage reporting at scale.
Yes. You can try Two Minute Reports free for 14 days. During the trial, you can connect your TikTok Organic data to Google Sheets, and explore all available reporting capabilities without any upfront commitment.

Meet the Author
Shalini MuruganShalini is driven by ideas that create a tangible impact. At Two Minute Reports, she specializes in content that helps marketers optimize their reporting workflows. When she's not transforming complex data into meaningful insights, you might find her lost in a book, jotting down ideas in her notebook, or connecting the dots others overlook.