
Summarize this blog post with:
“We’re publishing consistently, but we can’t figure out what’s driving results.”
That is the frustration many marketers face today.
Production is no longer the bottleneck. AI has reduced the cost and time required to create content. Distribution channels are accessible. Yet clarity remains unclear.
As content volume increases, performance signals blur. Traffic grows, but intent varies. Engagement rises, but buying signals remain hidden. Without a structured content measurement framework, reporting turns into activity tracking, not revenue-focused.
The real challenge lies in identifying which content marketing metrics actually guide strategic decisions.
In this article, we break down 15 essential content marketing metrics classified by visibility, engagement, and revenue impact, and explain how to interpret them so reporting translates into measurable ROI.
Let’s get started.
What are Content Marketing Metrics?
Content marketing metrics are quantifiable indicators used to evaluate how different types of content, such as blogs, email, video, social, etc impacts your overall marketing strategy. They help you answer critical questions such as:
- Is our content reaching the right audience?
- Is it influencing audience behavior?
- Is it contributing to defined marketing objectives?
- Is our content strategy delivering measurable results?
For example, if your marketing team wants to evaluate how much traffic a blog generates, how many leads it captures, those answers come only from tracking the right metrics. It helps you connect content performance to tangible outcomes, allowing you to assess whether your efforts contribute to growth and guide future decisions.
Why Should You Track the Right Content Marketing Metrics?
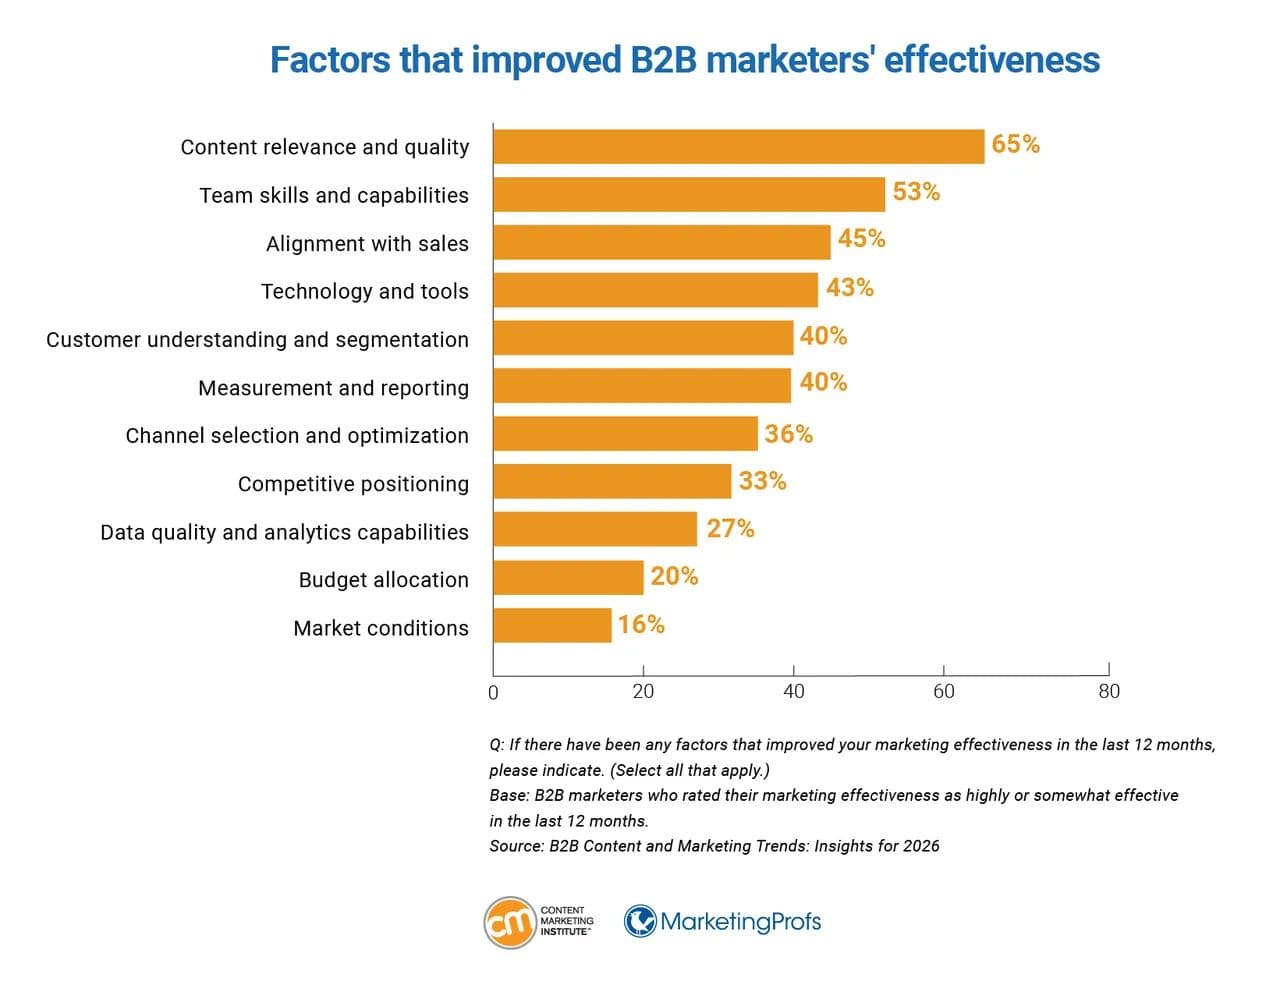
Tracking the right content marketing metrics ensures your strategy prioritizes relevance and quality over sheer output – a factor that 65% of marketers identify as the primary driver of performance.

The right content marketing metrics help you:
- Validate content relevance: Measures whether your content attracts the intended audience segments, not just traffic spikes from irrelevant keywords.
- Assess content quality through behavioral signals: Identify whether users meaningfully engage, return, or move deeper into your funnel.
- Prioritize high-impact topics: Determine which themes, formats, or assets generate qualified leads or influence the pipeline and double down on them.
- Eliminate vague formats: Stop investing in formats or topics that generate surface-level engagement but fail to contribute to marketing goals.
- Improve resource allocation: Shift budget and effort toward content that demonstrates sustained performance rather than short-term visibility.
When you track the right metrics, you move from asking “Did this perform well?” to “Did this move the business forward?” That shift is what separates content activity from content effectiveness.
How to Build a Content Strategy That Fits Your Context?
Building the right content strategy starts with understanding one key factor – Content Market Fit. In our recent podcast episode, Diandra Escobar, founder of Distinctiva, shared her insights on how to craft the right content market fit, which is the process of discovering what resonates with your specific audience through experimentation and data.
Here are the key takeaways:
- Choose your content mix based on your current growth initiatives.
- Select one format (text, carousel, video, etc) to test and commit to it.
- Start with a clear hypothesis. Define what you expect to happen.
- Measure meaningful engagement signals and not vanity metrics.
- Double down on content that generates qualified engagement.
To experiment with this effectively, you need clarity on content types. A balanced content mix includes 4 categories:
- Growth content – Expands reach and attracts a new audience.
- Authority content – Demonstrates expertise and builds credibility.
- Conversion content – Encourages action and drives inquiries or sales.
- Personal content – Humanizes your brand and strengthens the connection.
The right context mix at the wrong stage can hinder growth. The episode below shows you how to align your mix with where you are, not where you think.

15 Important Content Marketing Metrics Every Marketer Must Track
In this section, we’ll be classifying the content marketing metrics in four clear categories:
- Visibility & Discovery Metrics
- Engagement & User Behavior Metrics
- Lead Generation & Conversion Metrics
- Revenue & Attribution Metrics
Visibility & Discovery Metrics
These metrics help you assess whether your content is attracting the right audience and contributing to meaningful brand visibility.
1. Impressions
What it measures: The number of times your content appears in the search engine for relevant queries.
Why it matters: Impressions indicate topical visibility. If impressions are low, your content is either not ranking, not indexed properly, or targeting keywords with insufficient demand.
Optimization tips:
- Identify queries generating impressions but ranking outside the top 10, and strengthen on-page relevance for those terms.
- Expand content depth around high-impression keyword clusters to improve authority.
- Separate branded and non-branded impressions to evaluate category reach versus brand demand.
2. SERP Rankings (Average Position)
What it measures: The average position your content ranks for target keywords in search results.
Why it matters: Ranking position directly impacts click potential. Positions 1-3 capture the majority of search traffic and help in generating 74.5% more clicks. Ranking between positions 4-15 represents optimization opportunities for more visibility.
Optimization tips:
- Prioritize keywords ranking between positions 4-15 for content refinement and optimization.
- Improve internal linking to pages ranking in mid-positions to strengthen contextual authority.
- Align content format with search intent.
3. Click-Through Rate
What it measures: The percentage of impressions that convert into clicks.
Why it matters: CTR reflects how compelling your positioning is within the search results. Strong rankings with weak CTR indicate messaging misalignment, not visibility issues.
Optimization tips:
- Rewrite title tags to emphasize specificity or outcome (avoid vague headlines).
- Align meta descriptions with user search intent.
- Analyze competitors ranking above you, compare the content angle, spot the gaps, and identify improvement opportunities.
4. Organic Traffic
What it measures: The number of visitors who land on your website or landing page via unpaid search results.
Why it matters: This is one of the key SEO metrics that reflects successful discoverability. However, growth should be evaluated alongside keyword intent. Traffic without relevance does not contribute to the pipeline.
Optimization tips:
- Segment traffic by landing page to identify high-performing content types.
- Monitor traffic to commercial-intent pages separately from informational pages.
- Identify declining traffic pages and refresh outdated statistics, examples, or structure.
5. Backlinks and Referring Domains
What it measures: The number and diversity of external websites linking to your content.
Why it matters: Backlinks strengthen authority signals, improving ranking potential and expanding referral exposure. Unique referring domains are more impactful than raw link volume.
Optimization tip:
- Track which content formats attract natural links (statistics, frameworks, listicles).
- Strengthen internal linking to high-backlink pages to distribute authority.
- Audit lost backlinks periodically and remove toxic ones to protect your domain rating.

Gain instant clarity on what’s working and where you’re losing visibility. Monitor impressions, clicks, CTR, and rankings across queries and devices in a single GSC dashboard. Double down on high-performing keywords and optimize for stronger search impact.
Engagement and User Behavior Metrics
These metrics evaluate how users interact with your content after discovery. It reveals whether your content holds attention and drives progression.
6. Average Engagement Time
What it measures: The average amount of time users actively engage with your content (scrolling, clicking, interacting).
Why it matters: Engagement time indicates content quality and relevance. If users land and leave quickly, either the content does not match or fails to deliver value early. Sustained engagement suggests alignment of search intent and content depth.
Optimization tip:
- Improve the first 20% of your article, as weak introductions drive early exits.
- Use subheadings strategically to guide skimming readers.
- Analyze engagement by content length, which directly impacts scroll depth.
- Embed visuals, examples, or frameworks where drop-offs typically occur.
7. Pages Per Session
What it measures: The average number of pages a user views during a single visit.
Why it matters: This reflects how well your content captures users’ attention. High pages per session suggest strong internal linking and logical topic clustering. Low depth often indicates misaligned, poor-quality content.
Optimization tip:
- Build content clusters around core topics and link contextually, not randomly.
- Add “next step” recommendations at the end of the high-traffic posts.
- Guide users from informational content towards consideration stage content.
8. Bounce Rate
What it measures: The percentage of users who leave without meaningful interaction or further navigation.
Why it matters: Bounce rate reveals a mismatch between expectation and experience. High bounce rates combined with high traffic often signal keyword misalignment or misleading titles.
Optimization tip:
- Compare bounce rate by traffic source to identify misaligned channels.
- Align headlines closely with the actual value delivered.
- Improve page load speed and mobile usability.
9. Scroll Depth
What it measures: The measure of how far a visitor scrolls your webpage. For example, 50% scroll depth means users reached halfway through your content, and 75% indicates higher content consumption.
Why it matters: Scroll depth reveals whether your content structure sustains attention. If most users drop before reaching key sections, your content might be misordered.
Optimization tip:
- Place your strongest insights earlier if drop-off happens above 50%.
- Avoid long, unbroken text blocks that reduce scrolling momentum.
- Compare scroll depth across content types (guides vs. listicles vs. case studies).
- Use scroll data to restructure the underperforming pages.
10. Social Media Engagement
What it measures: Interactions such as shares, saves, comments, and reposts across social media platforms.
Why it matters: By tracking key social media metrics, you can analyze which content highly resonates with your audience and refine distribution accordingly to maximize visibility.
Optimization tip:
- Track which content formats generate saves or shares rather than impressions alone.
- Repurpose high-performing blog insights into platform-native formats.
- A/B test hooks and opening lines; if you can’t capture your audience’s attention in the first 2 seconds, you lose them.
Agency Tip: Use a dedicated social media reporting software to track, consolidate, and analyze key metrics from Meta, Instagram, LinkedIn, and YouTube. Understand which content types drive audience engagement and optimize your marketing ROI.
Lead Generation and Conversion Metrics
These metrics determine whether your content is persuasive enough to convert leads into potential customers.
11. Conversion Rate
What it measures: The percentage of visitors who completed a desired action, such as signing up for a free trial, downloading an ebook, subscribing to a newsletter, etc.
Why it matters: Traffic without conversion is distribution. Conversion rate reveals whether your content resonates with your target audience and helps them take the next steps aligned with your funnel stage.
Optimization tip:
- Match CTAs to intent (bottom funnel → direct offers).
- Position CTAs contextually within the article wherever applicable.
- Test value-based CTAs (“Download the LLM SEO Guide”) instead of generic ones (“Click more”).
- Analyze conversion rate by traffic source – organic, social, paid, etc.
12. Marketing Qualified Leads (MQL)
What it measures: The number of leads from your content who are likely to become real customers. A Marketing Qualified Lead takes meaningful action, such as visiting pricing, requesting a demo, etc.
Why it matters: High lead volume can look impressive, but if most leads are not a good fit, your content is attracting the wrong audience. MQLs indicate whether your content attracts potential buyers, not just traffic.
Optimization tip:
- Track which content pieces generate the highest percentage of qualified leads.
- Compare total leads vs MQLs, as large gaps signal targeting issues.
- Align qualification criteria with sales to ensure content performance reflects revenue potential.
13. Customer Acquisition Cost (CAC)
What it measures: The total content marketing investment divided by the number of customers acquired through content-influenced channels.
Why it matters: This metric reveals whether your content marketing efforts are acquiring customers at a cost that supports long-term profitability.
Optimization tip:
- Monitor CAC trends over time to improve long-term efficiency.
- Attribute costs accurately (production, distribution, tools) for realistic measurement.
- Segment CAC by content category to identify high-return themes.
Revenue and Attribution Metrics
These metrics determine whether content contributes to measurable business growth.
14. Assisted Conversions
What it measures: The number of conversions where your content played a role in the customer journey, even if it wasn’t the final interaction before purchase. For example, a user might have discovered you through a blog post. Here, the blog assisted the conversion, even if it didn’t close it.
Why it matters: Content rarely drives last-click conversions in B2B. If you measure only final-touch conversions, you will undervalue content. Assisted conversions reveal how content supports the decision process over time.
Optimization tip:
- Use attribution reports in GA4 to identify content-assisted journeys.
- Identify blog posts that frequently appear early in conversion paths.
- Strengthen internal linking from high-assist pages to bottom-funnel pages.
15. Content Marketing ROI
What it measures: The financial return generated from content marketing relative to the total investment made in it.
Why it matters: ROI determines whether your content marketing efforts are economically sustainable. Traffic growth is meaningless if content costs exceed revenue contribution.
Optimization tip:
- Separate one-time content investments from recurring costs.
- Identify high ROI-content themes and scale similar topics.
- Track ROI trends monthly and quarterly to analyze patterns and effectiveness.
How to Track Your Content Marketing Metrics?
Most content marketers don’t struggle with data availability – they struggle with consolidation. GA4 lives in one tab, Search Console in another, and CRM data somewhere. By the time everything is compiled, the insight is delayed.
Two Minute Reports solves this by pulling data from GA4, HubSpot, Google Search Console, and 30+ other platforms directly into Google Sheets and Looker Studio. Here’s the exact four-step workflow to streamline your content marketing performance tracking and reporting.
Step 1: Define the Question Each Data Source Must Answer
Before you connect, define what decision each data source supports. This prevents dashboard clutter.
Starting with a question prevents you from building a 40-page-long report that nobody reads.
Why this matters: Every metric in your report should let you answer, “We track this because it tells us whether [specific content action] is working.”
Step 2: Connect Your Data Sources
- Install the Two Minute Reports add-on from the Google Workspace Marketplace and open it inside Google Sheets.
- Connect the required data sources and follow the on-screen instructions to authenticate the credentials.
- Map the metrics to the required platforms (GA4, GSC, HubSpot, etc) to track your content marketing performance.
If you’re managing multiple clients, you can easily switch using the dropdown in a single reporting interface.
Step 3: Customize Your Content Marketing Dashboard
- Start with your client’s primary objective – SEO growth, lead generation, revenue efficiency, or content authority.
- Rearrange, group, or remove content metrics based on what drives decisions for your client’s marketing goals.
- Take full control of your content marketing dashboards – add your agency logo, colors, or layouts and deliver branded dashboards to reinforce expertise and credibility.
- Reuse the existing dashboard across multiple clients to save time, improve consistency, and ship insights faster to optimize performance.
Step 4: Automate Report Delivery
- Set custom refresh schedules (hourly, daily, weekly, or monthly) to deliver content marketing reports to your clients on-time.
- Automate report delivery for multiple clients from a single interface. Just add the email address(es), specify the message, and hit send.
- Monitor real-time content performance insights – drops in CTR, sudden spikes in traffic, or reduced MQL volume.
- Use automation as an early-warning system. Act before performance gaps widen.
What to Do When Your Content Marketing Metrics Decline?
The principle: Define probable causes, test small adjustments, measure again. Metrics guide optimization cycles to make the right decision.
Here’s how you can use these insights:
- Treat each signal as a starting hypothesis, not a conclusion.
- Test small adjustments before making structural overhauls.
- Re-measure after optimization to validate the diagnosis.
Wrapping Up
Content marketing metrics matter if they steer your strategy in the right direction. Throughout this guide, we’ve moved from identifying the right metrics to structuring them to optimize performance and diagnosing issues to act proactively. The ultimate goal is to truly measure the impact.
Keep these principles in mind when preparing your content marketing report:
- Every content metric should have a decision attached to it.
- Structure reports by performance stage – visibility, engagement, lead generation, and ROI.
- Automate delivery so monitoring stays consistent.
The point of measurement isn’t to confirm that content is performing. It is to tell you what to write next, what to update, and where to double down. A metrics system that only looks backwards is half-built. Close the loop: review → identify the signal → change the content strategy → re-measure.
If you want to implement this system without manual exports, you can streamline and automate the workflow using Two Minute Reports. Start your 14-day free trial and turn your content marketing metrics into a structured, automated performance engine.
Frequently Asked Questions
Content marketing metrics are quantifiable indicators used to evaluate how different types of content impact your overall marketing strategy. They help answer questions about audience reach, behavior influence, and whether your content strategy is delivering measurable results.
Start by understanding your Content Market Fit, which involves discovering what resonates with your audience through experimentation and data. Choose your content mix based on growth initiatives, select one format to test, and focus on measuring meaningful engagement signals.
The conversion rate measures the percentage of visitors who complete a desired action, revealing whether your content resonates with the target audience and helps them take the next steps aligned with your funnel stage.
To track your content marketing metrics effectively, define the questions each data source must answer, connect your data sources, customize your dashboard based on objectives, and automate report delivery for consistent monitoring. To execute these steps, you need marketing reporting software such as Two Minute Reports, which lets you streamline and optimize your content performance.
When your content marketing metrics decline, define probable causes, test small adjustments, and measure again. Each signal should guide your optimization cycles to make informed decisions.
Related Blogs


Meet the Author
Shalini MuruganShalini is driven by ideas that create a tangible impact. At Two Minute Reports, she specializes in content that helps marketers optimize their reporting workflows. When she's not transforming complex data into meaningful insights, you might find her lost in a book, jotting down ideas in her notebook, or connecting the dots others overlook.
