Summarize this blog post with:
Did you know that 36% of direct purchases made via social media were on TikTok? This demonstrates the significant impact of TikTok on driving conversions.
But here’s the challenge: If you’re running TikTok Ads and manually tracking performance, you’re drowning in data and spreadsheets, struggling to visualize the insights you need to optimize your campaigns.
This tiring process not only slows down decision-making but also makes scaling your client campaigns a nightmare. The solution is to streamline your TikTok Ads reporting in Google Sheets by using a reliable PPC reporting software such as Two Minute Reports.
In this guide, I’ll walk you through two effective ways of connecting your TikTok Ads data to Google Sheets. By the end, you’ll get a clear understanding of tracking key metrics, measuring campaign performance, and creating custom reports to strengthen your ROI.
Let’s get started.
How to connect TikTok Ads data to Google Sheets?
You can connect your TikTok Ads data to Google Sheets using the following methods:
Method 1: Connecting TikTok Ads to Google Sheets using the sidebar.
Method 2: Connecting TikTok Ads to Google Sheets using the pre-built templates.
To begin with, install the Two Minute Reports add-on from the Google Workspace Marketplace. Once done, you can proceed with the first method as explained below.
Method 1: Connecting TikTok Ads to Google Sheets using the sidebar
Step 1: Creating a Connection to your source
To create a Connection, you must connect your TikTok Ads accounts with Google Sheets.
To do this, launch the Two Minute Reports add-on from the extensions menu in your spreadsheet. Next, open the sidebar and perform the following steps:
Go to Menu > Click Connections > Click Add to start creating your new Connection
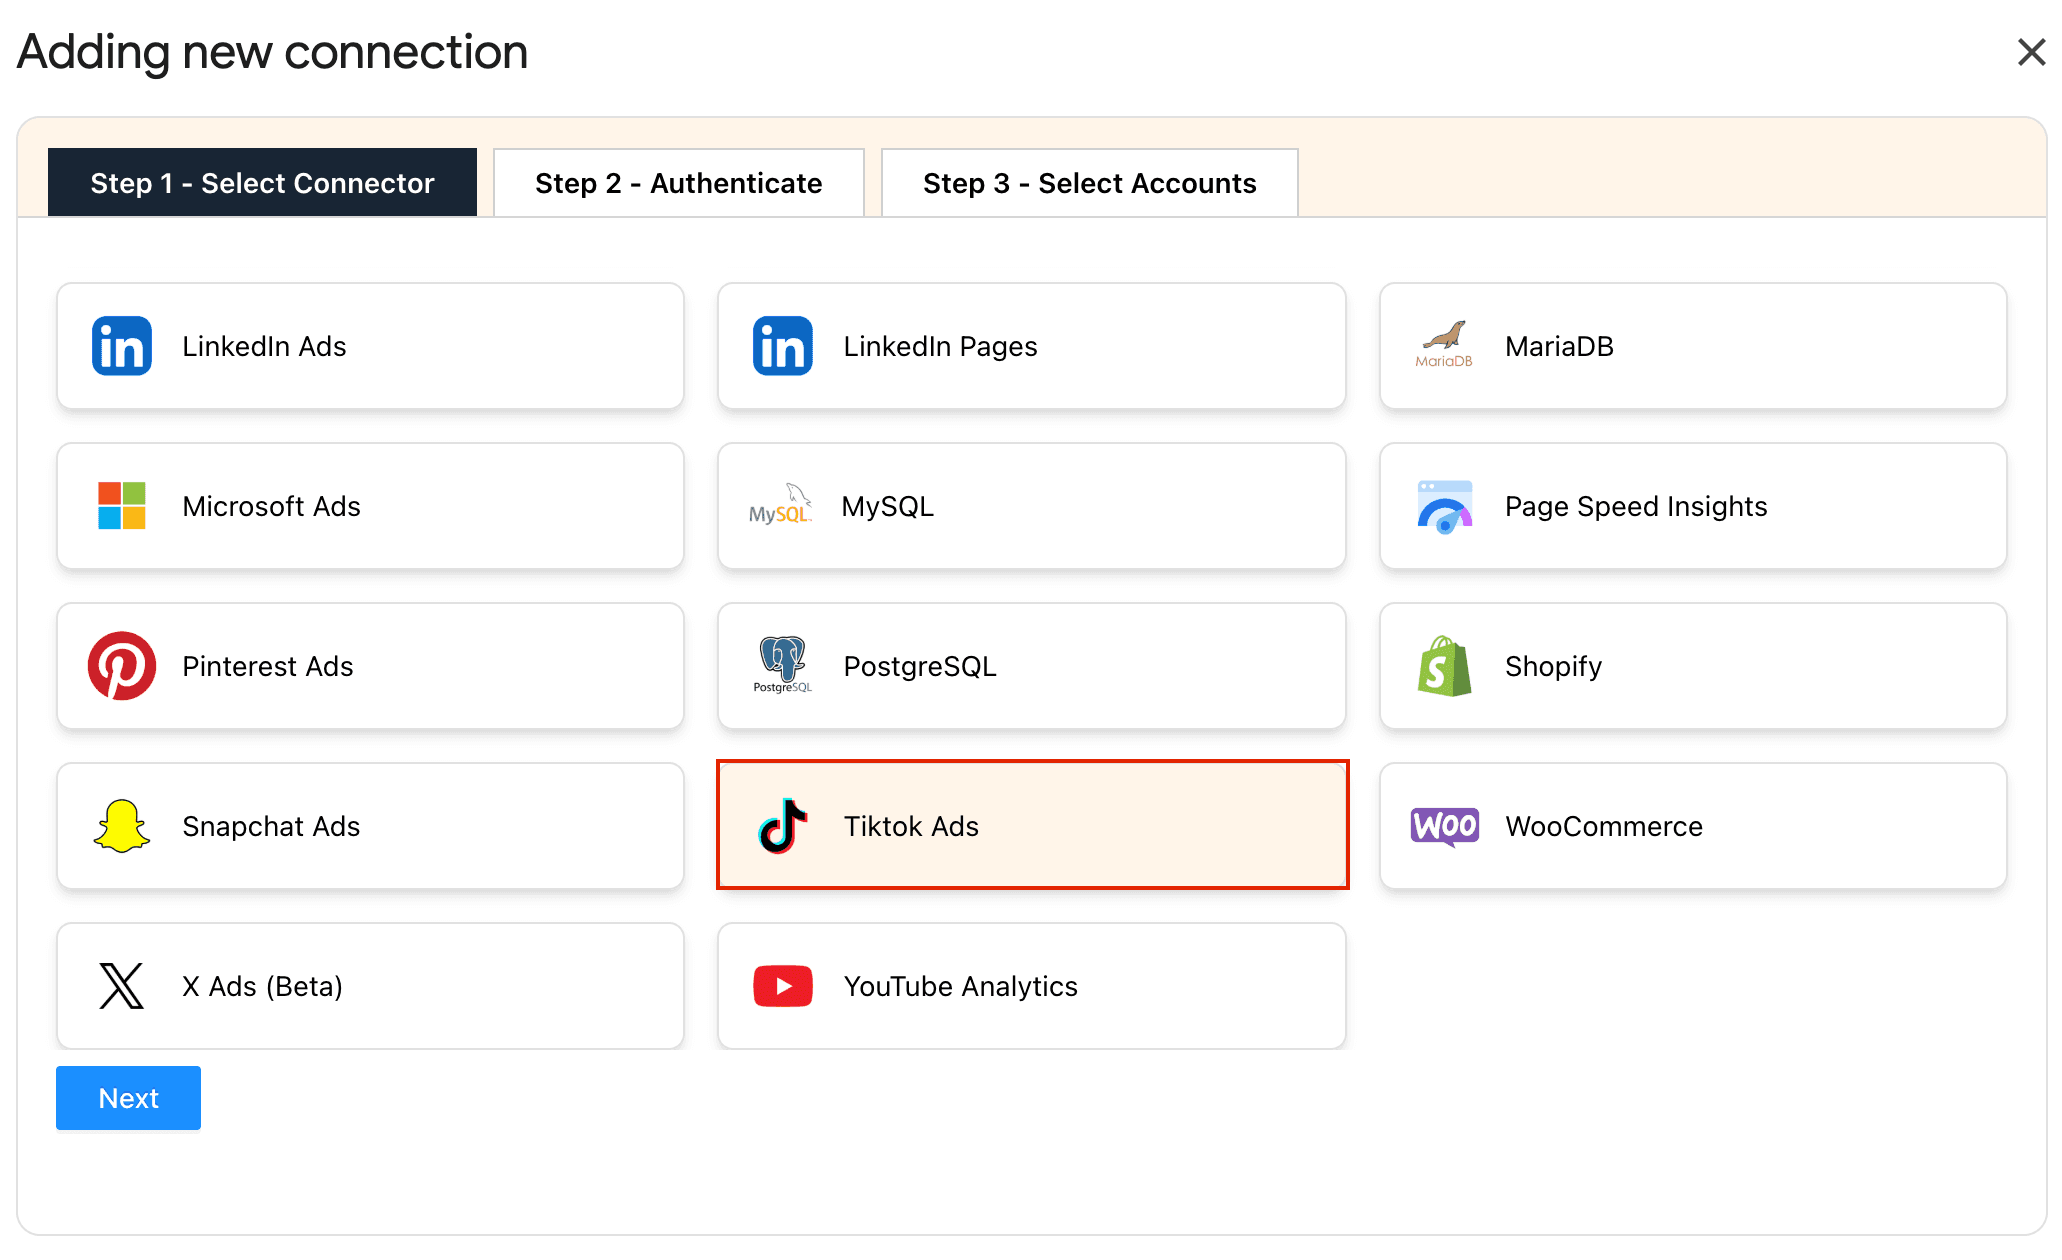
Once this is done, the “Adding new connection” dialog box appears. Next, you can follow the steps below to authenticate your TikTok Ads connection with Two Minute Reports.
1. Select the TikTok Ads connector.

2. Next, authorize your connection by specifying your login credentials. Once you’ve authenticated, you can visualize the following fields: Account name, ID, Name, Status, and Speedboost, as shown below:
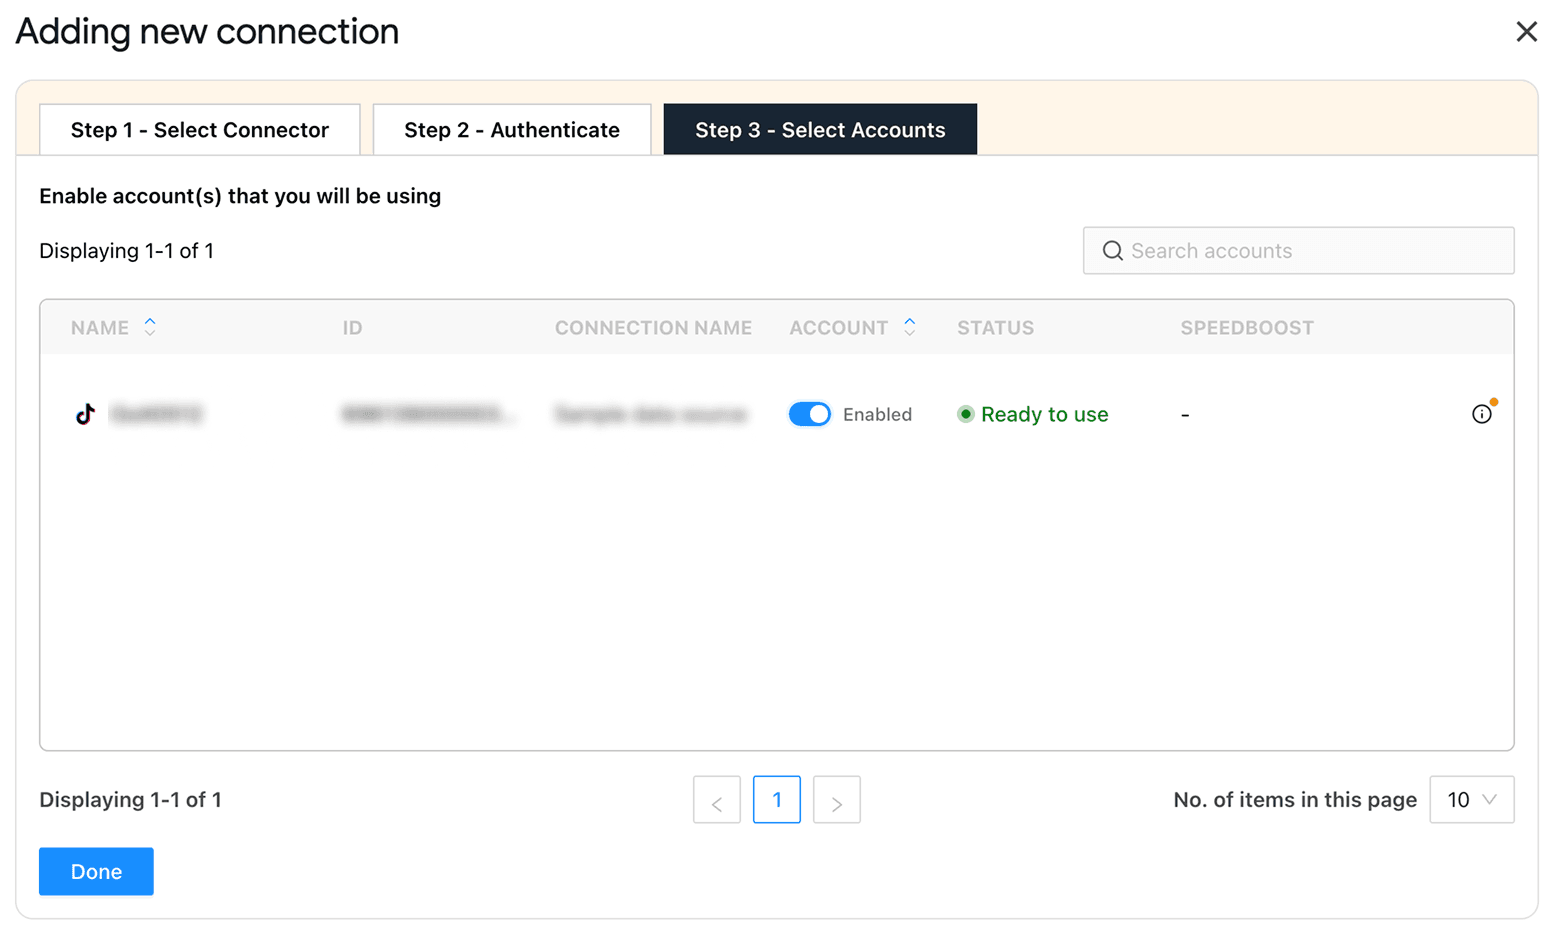

3. Enable the toggle for the accounts you want to run queries. Please note that you cannot extract data from disabled accounts.
Note: With Speedboost, you can retrieve complex TikTok Ads datasets within seconds via smart caching. With 99.9% uptime, you can load TikTok Ads dashboards faster and visualize performance insights to scale campaign ROI.
4. Once you’ve enabled the associated accounts, you can hit “Refresh Connections” to ensure the connected TikTok Ads accounts are reflected in the sidebar.
Now that you’ve created the Connection, the next step is to create a query. Let’s explore how to do that.
Step 2: Creating a query and report configuration
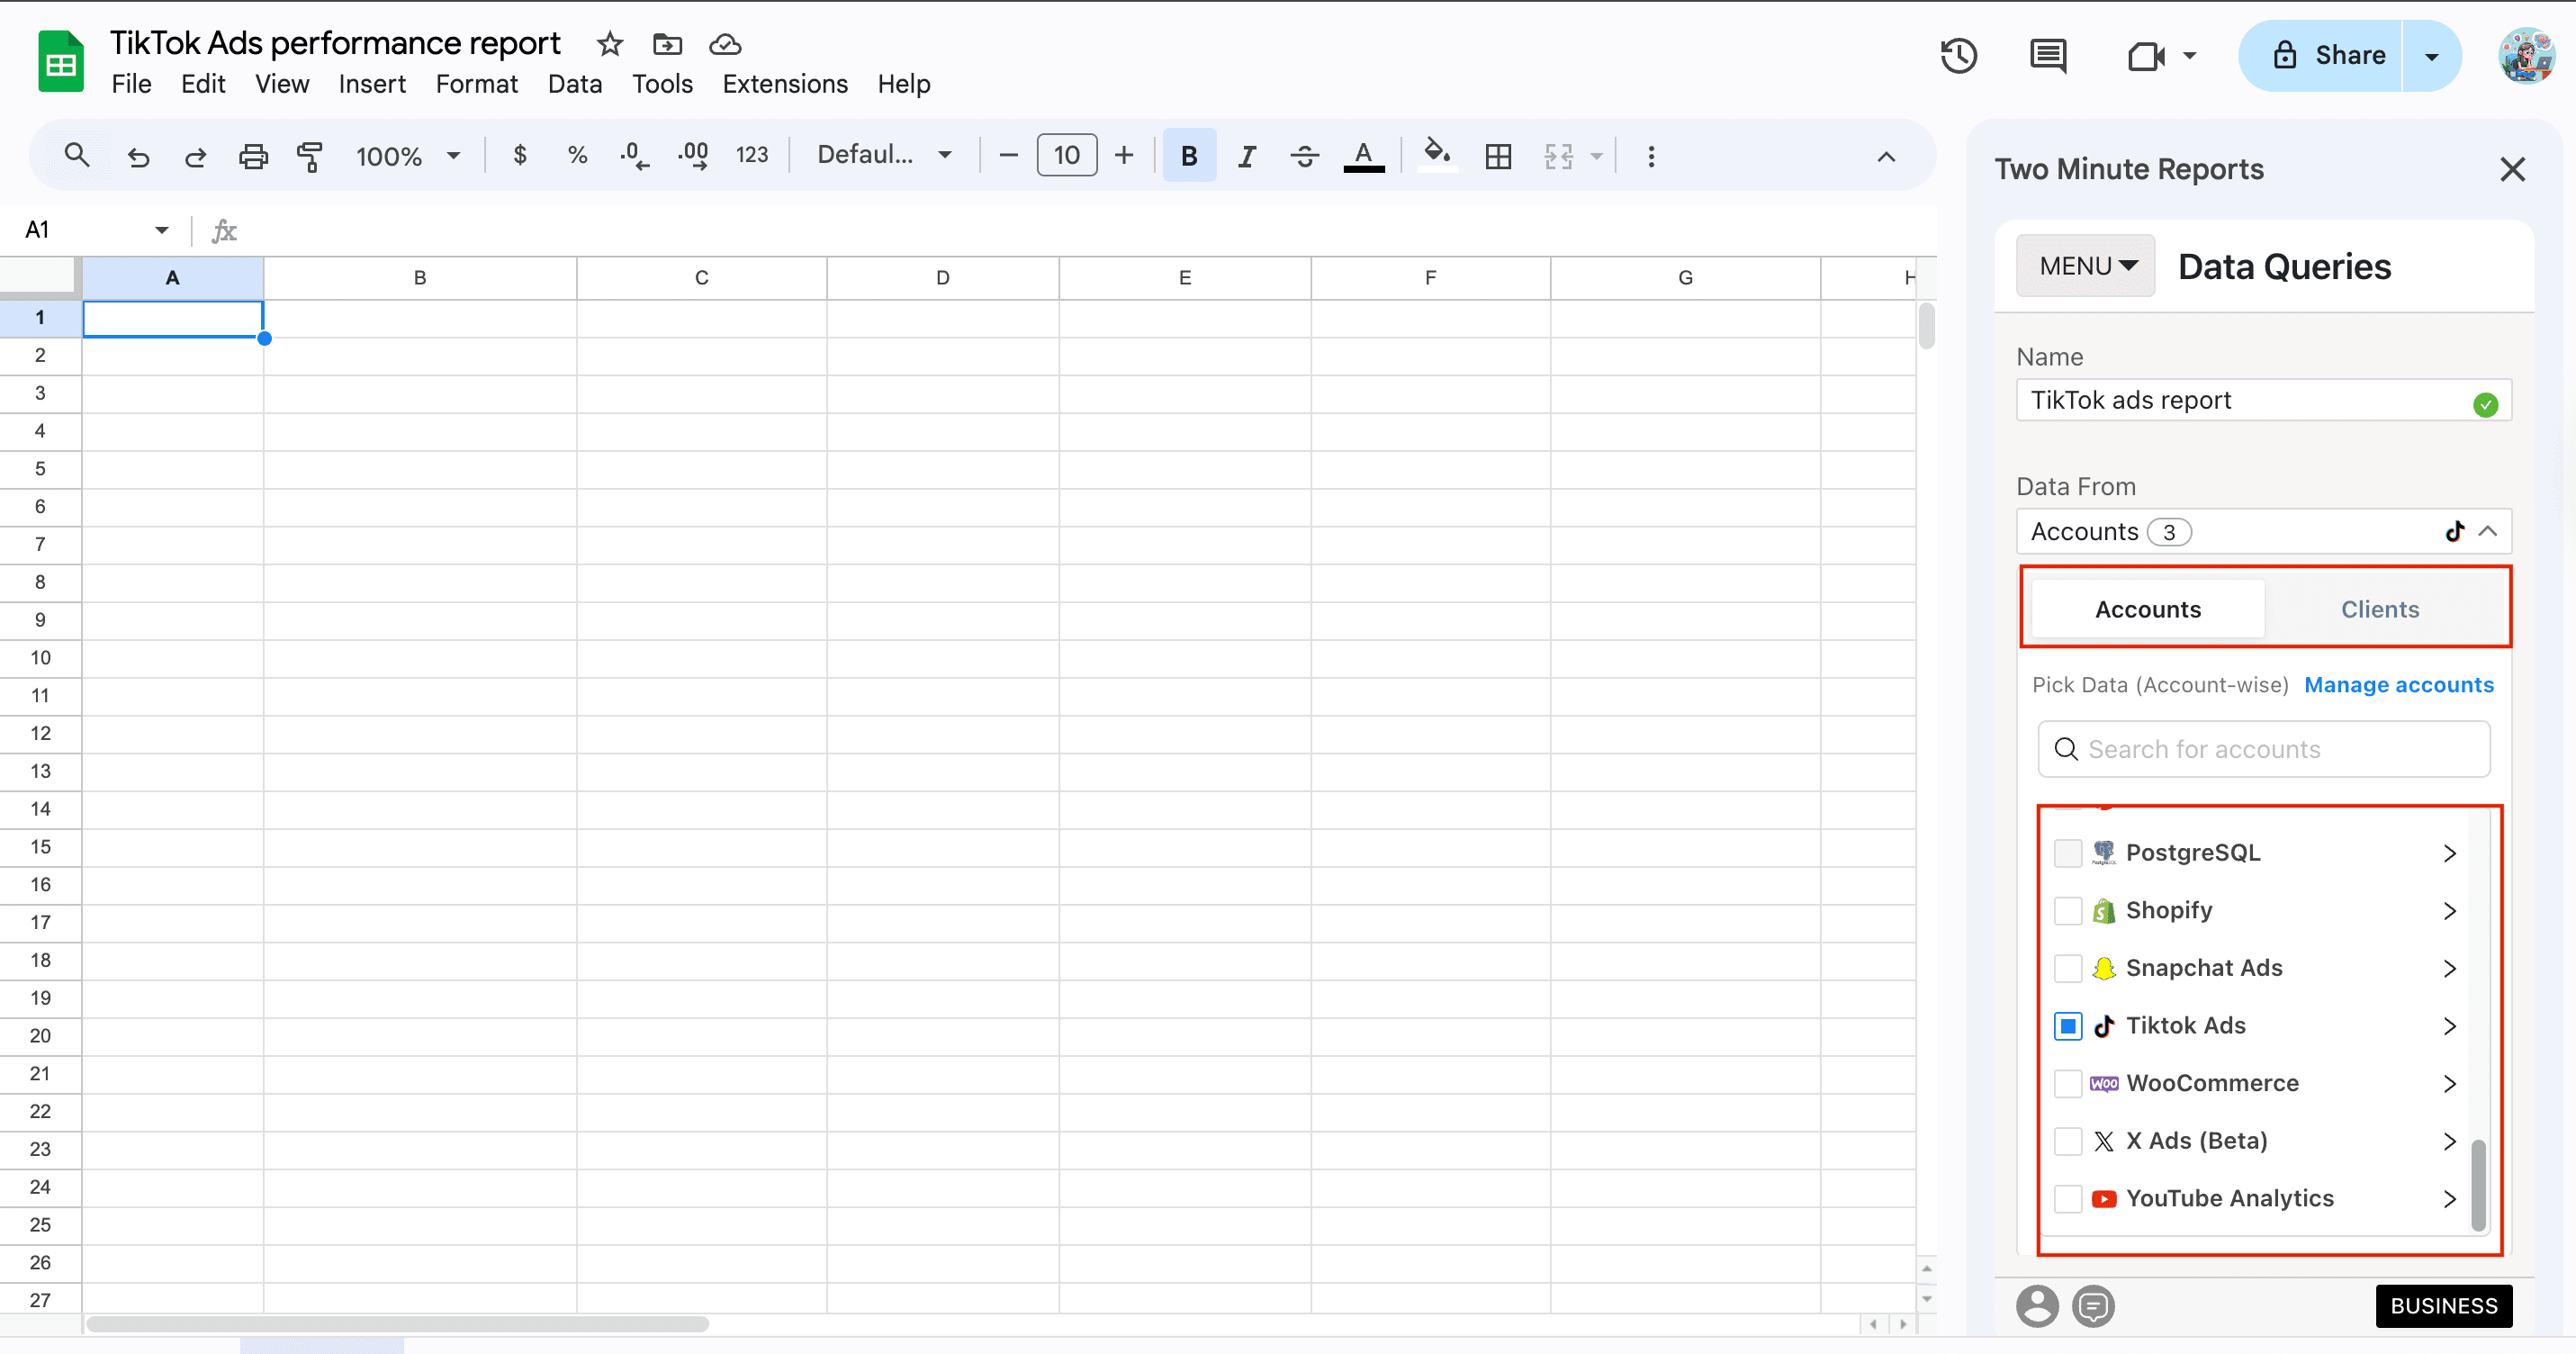
To extract your TikTok Ads campaign data, click Data Queries from the Menu dropdown. You can follow the steps below to create your TikTok Ads report.
1. Click Add and choose your desired TikTok Ads accounts from the sidebar.

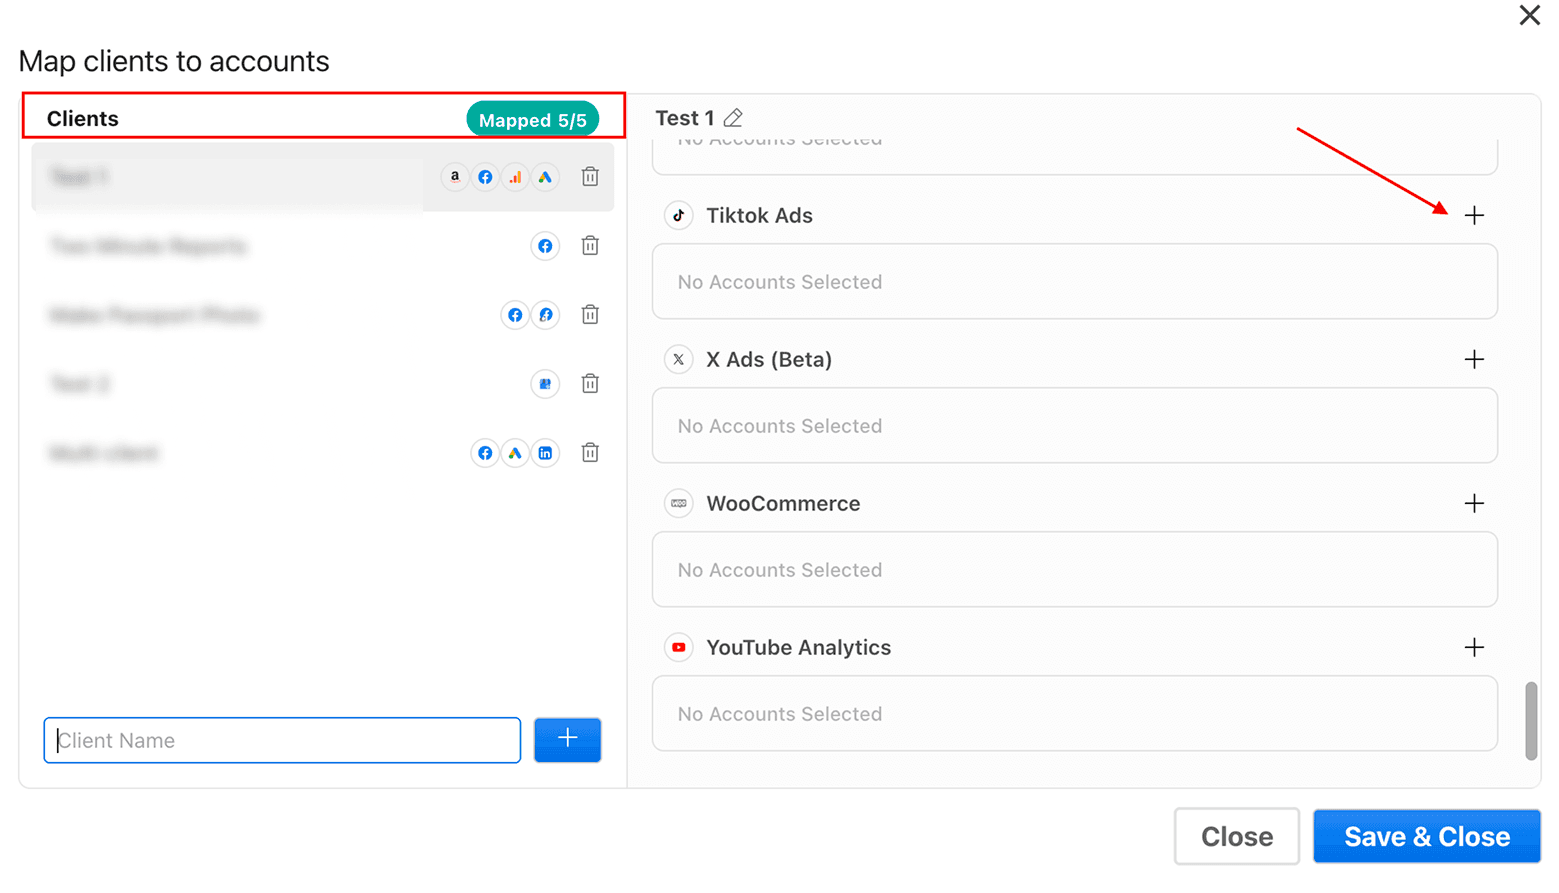
2. Alternatively, navigate to the “Clients” section. Click on “Manage clients” and map the necessary account details. Once done, click Save & Close to save your client’s details.

3. Next, add the required TikTok Ads metrics and dimensions you want to analyze. Then select the date range to track and measure campaign performance.
4. Once you finish the above steps, click Run query to visualize the final results. This query fetches the data from your chosen TikTok Ads account onto the sheet and cell of your choice.

Pro tip: You can set up automated refresh schedules (daily, weekly or monthly) and keep your clients informed with live, real-time performance updates.
Pro TMR tip: Run all your queries directly from the Extensions menu on your Google Sheets. Go to Extension > Two Minute Reports > Choose your desired quick action.
While creating your TikTok Ads report through the sidebar is straightforward, there’s also another easier way to streamline your campaign performance analysis. Let’s look at leveraging TikTok Ads reporting via built-in templates.
Method 2: Create TikTok Ads report using pre-built templates
With Two Minute Reports ready-to-share templates, you can connect your accounts, customize dashboards, and deliver real-time performance updates to clients without manual efforts. You can access the TikTok Ads templates via:
Extensions > Two Minute Reports > Templates
- In the template gallery, you can choose your preferred TikTok Ads templates to track performance.
- Next, click Use to build your report. Your template will open in Google Sheets.
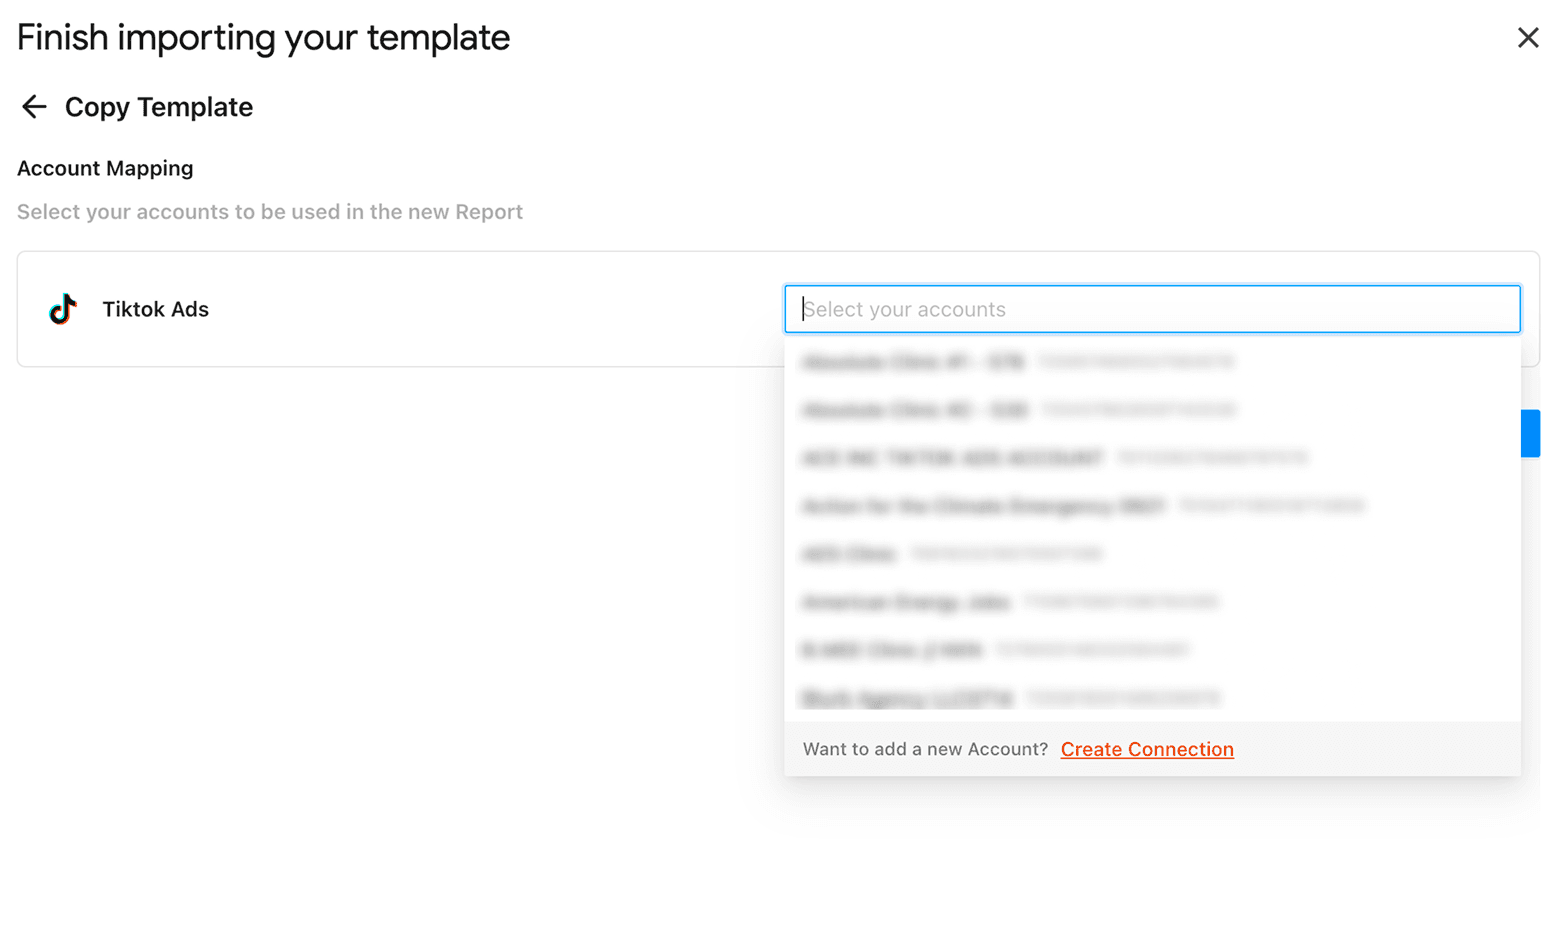
- Finish importing your template by selecting the required TikTok Ads accounts from the dropdown. Once done, click Submit to create your report.

- Next click, Extensions > Two Minute Reports > Run all queries to update your template with the campaign performance data.
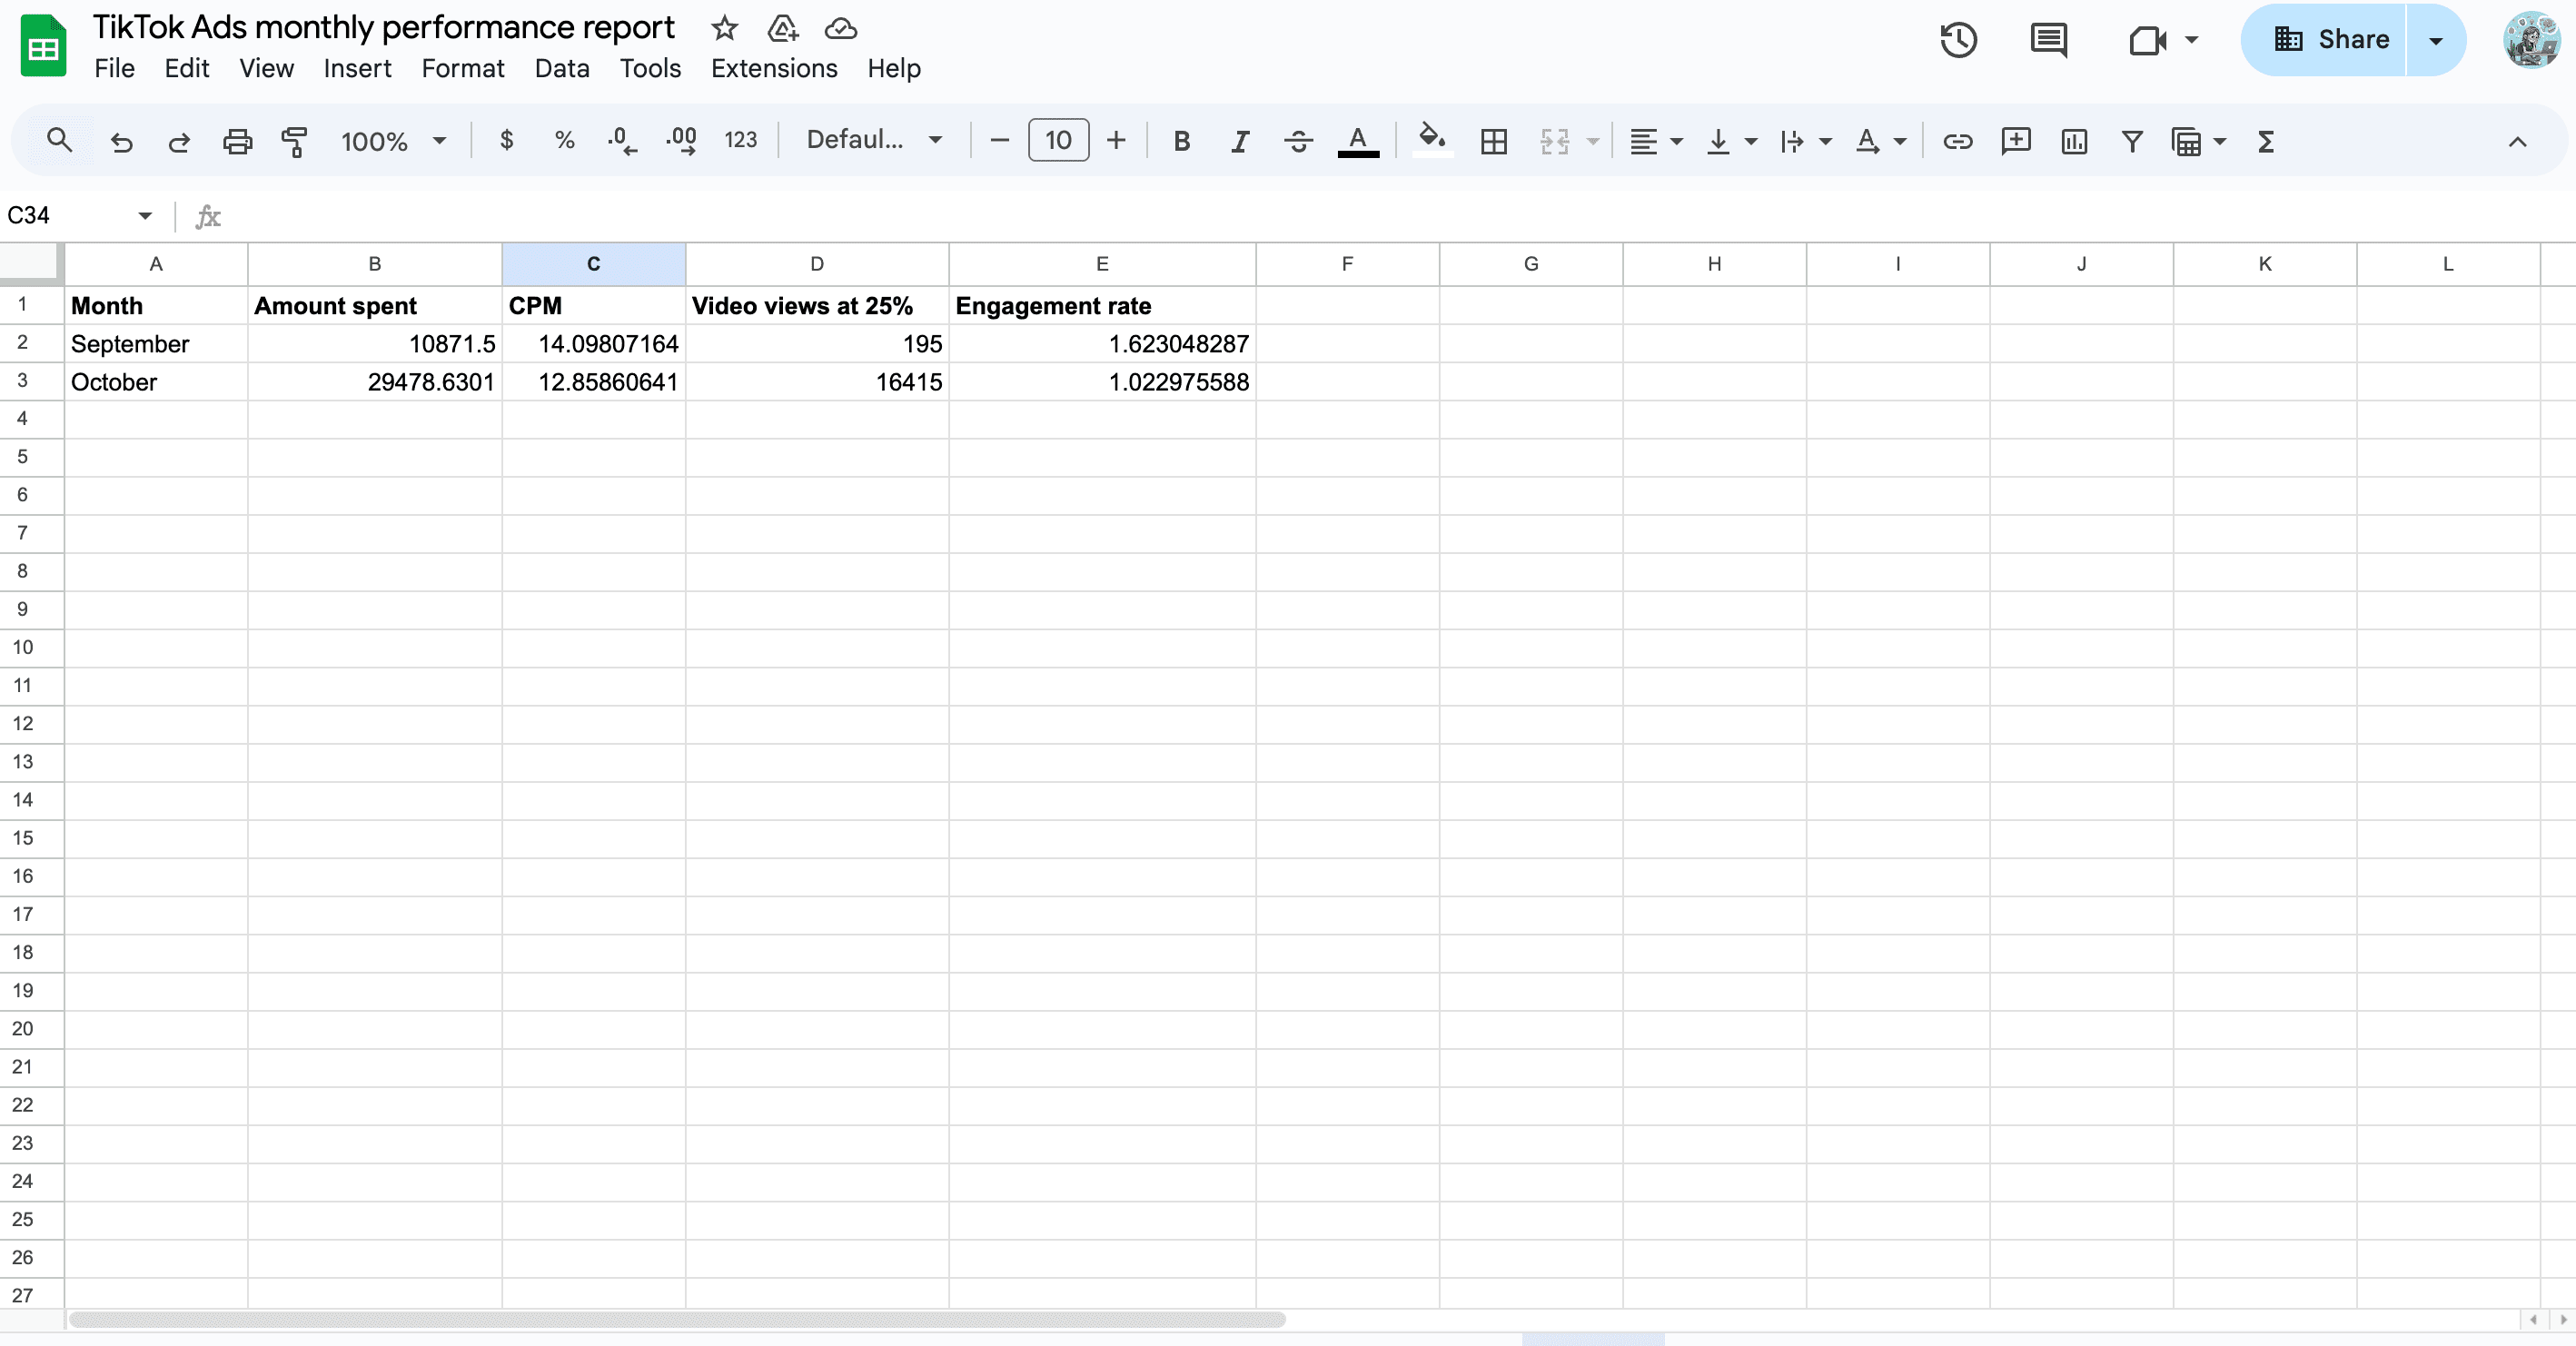
- Once the queries are complete, your template will be auto-populated with actionable TikTok Ads insights.
Why choose Two Minute Reports to import TikTok Ads to Google Sheets?
With its quick, no-code integration, you can automate data import, track campaign performance, and gain actionable insights – without the need for technical skills. Here's why Two Minute Reports is the best choice for effortless TikTok Ads reporting.
1. Centralized data integration: Create a seamless data flow from TikTok Ads to Google Sheets by consolidating key metrics in a single Google Sheets dashboard. This eliminates the need for manual CSV exports, so you can focus on refining and optimizing your strategy.
2. Intuitive reporting: With Two Minute Reports, you can create professional, white-label TikTok Ads reports that are fully customizable to match your brand’s style. The easy-to-use interface allows you to blend data from multiple PPC channels, enabling you to measure cross-channel ad spend and ROI.
3. Faster data syncs: Load complex dashboards faster with our exclusive Speedboost technology. With 99.9% uptime, you can deliver blazing-fast TikTok Ads reports to clients without the wait. No manual setup required.
4. Automatic data refreshes: Never miss a deadline. With automatic updates (daily, weekly or monthly), you can keep clients informed with real-time insights. You can implement proactive measures to address underperforming areas, instead of waiting for manual reports.
5. Unlimited reporting: No matter which plan you choose, you can create unlimited TikTok Ads reports, especially with no data volume limits. Whether you are handling multiple clients or managing large volumes of data, you can generate as many reports as you need, all while maintaining faster performance and reliability.
Overall, whether you are a marketer, agency owner, or freelancer, Two Minute Reports makes TikTok Ads reporting faster, easier, and more effective.
How to build a strong TikTok Ads analytics strategy?
To build a strong TikTok ads analytics strategy, you must first identify the key KPIs that add significance to your goals and ROI. Here’s how you can easily get the hang of things if you understand these five metric categories:
1. Basic insights: Like most advertising platforms, you can visualize the overview of your campaign performance by tracking the following metrics:
- Clicks, impressions, conversions.
- Cost Per Click
- Cost Per Mille
- Cost Per Acquisition
- Conversion Rate
- Click-through Rate
2. Attribution insights: With TikTok Pixel, you can set attributions or triggers for specific activities that meet your requirements. You can get insights about:
- CTA Conversions
- VTA Conversions
- CTA registrations
- VTA registrations
- CTA purchases
- VTA purchases
In summary:
- CTA – Direct interaction (clicks)
- VTA – Indirect interactions (views, followed by actions)
- Conversions, registrations, and purchases – Different types of desired actions that happen as a result of the ad, either directly (CTA) or after viewing the ad (VTA).
3. In-App Event: Refers to the specific actions or interactions that users take within the app after they view or interact with your ad. The common types of in-app events include:
- App installs
- Unique registration
- Add to cart events
- Purchase events
- Total checkout value
4. Video insights: This is one of the most crucial metrics to monitor, as the platform’s core strength lies in video advertising. Some of the prominent metrics include:
- 2, 6-second video views
- 6, 15 focused video-views
- Video views at 25%, 50%, 75%, 100%
- Average video watch time per person
- Average video watch time per video view
5. Instant page insights: When advertising with TikTok for Business, you can create pages that load instantly upon users’ clicks. These pages, known as Instant Pages, function just like a landing page but are highly mobile-optimized. You can optimize by tracking metrics such as:
- Complete payment ROAS
- Cost per Complete Payment
- Landing page views
- Total button click value
- Total add to cart value
- Total form submission
- Download button click cost
Regularly monitoring and optimizing your TikTok Ads based on real-time data will ensure sustained campaign performance, allowing you to refine your targeting and maximize ROI.
Get TikTok Ads data in Looker Studio
Easily integrate your TikTok Ads with Looker Studio via the Two Minute Reports hub and customize your dashboards to reflect the latest campaign performance insights. With centraliized reporting, you can effortlessly track key metrics, giving a comprehensive view of your campaign success.
Whether you’re analyzing engagement rates or comparing performance across multiple clients, Two Minute Reports empowers you to make data-driven decisions faster without the need for complex setups. Visualize actionable insights and refine your strategy to increase profitability.
Connect your advertising platforms with Google Sheets
Bring together your PPC reporting by blending all your data sources in a single dashboard. Connect Facebook Ads, LinkedIn Ads, Snapchat Ads, etc and unlock true cross-channel ROI. Identify winning opportunities, areas of optimization and make quick, real-time changes without having to wait for manual updates. Streamline multi-client reporting, save time and drive better results for your clients.
Frequently Asked Questions
You can install the Two Minute Reports add-on from the Google Workspace Marketplace. Next, open your spreadsheet, launch the sidebar, and connect your TikTok Ads accounts. Then specify your metrics, dimensions, date range and click Run query. Visualize actionable performance insights without having to manually switch spreadsheets.
With Two Minute Reports, you can set up custom refresh schedules – daily, hourly, weekly or monthly and ensure your campaign reports reflect the latest TikTok Ads campaign insights. Deliver professional, white-label reports directly from Google Sheets to your clients within minutes.
You can access our free, ready-to-share TikTok Ads Google Sheets templates to streamline campaign tracking. Once you click “Use Template”, you can launch the Two Minute Reports add-on, import your client’s TikTok ad accounts, run queries and auto-populate the dashboard with meaningful insights.
With data blending, you can compare TikTok Ads with other advertising platforms, such as Meta, LinkedIn Ads, etc, into a single dashboard and unlock cross-channel ROI. No need to toggle between platforms or copy-paste KPIs manually.
You can choose to directly select your client’s TikTok Ads accounts from the Two Minute Reports sidebar and consolidate key KPIs in one place. Alternatively, you can also reuse the existing reports across multiple clients, ensuring you focus more on strategy and accomplish your campaign goals.

Meet the Author
Shalini MuruganShalini is driven by ideas that create a tangible impact. At Two Minute Reports, she specializes in content that helps marketers optimize their reporting workflows. When she's not transforming complex data into meaningful insights, you might find her lost in a book, jotting down ideas in her notebook, or connecting the dots others overlook.