Summarize this blog post with:
X (formerly Twitter) remains one of the most unique ad platforms for marketers – real-time conversations, niche targeting, and a fast-moving audience. Whether you're promoting a product launch, driving clicks to content, or building a brand in public, X Ads offer high-intent, interest-based targeting that few platforms match.
But here’s the catch: while X Ads Manager gives you a decent overview, it quickly falls short when it comes to custom reporting, historical trends, and team collaboration.
Exporting reports manually? It's slow, error-prone, and frankly unsustainable if you're managing multiple clients or campaigns.
That’s where Google Sheets comes in–and more importantly, where Two Minute Reports can save you hours of work. In this guide, we’ll show you how to extract your X Ads data to Google Sheets in under two minutes, without any code or CSV wrangling.
Let’s get your X Ads reporting automated, customizable, and ready to scale.
Why export X Ads data to Google Sheets?
Marketers and agencies need fast, flexible reporting–and the native X Ads Manager just doesn’t cut it. Here's why moving your X Ads data to Google Sheets can transform your reporting workflow:
Go beyond basic KPIs
X’s native dashboard is limited in both scope and flexibility. Google Sheets lets you:
- Access all campaign metrics, not just surface-level ones
- Segment by audience, geography, or creative easily
- Add custom formulas to calculate ROAS, cost per conversion, or engagement rate
- Build your own dashboards using charts, pivot tables, and filters
Pro tip: With Two Minute Reports, this data can be pulled automatically—no more downloading CSVs.
View campaigns on-the-go
X Analytics isn’t optimized for mobile anymore. But Google Sheets is:
- Access your reports from a mobile or tablet
- Share real-time dashboards with clients or teammates
- Even publish your sheet as a live web link
Automate and streamline everything
Tired of downloading CSVs every Monday? Use Google Sheets with tools like TMR to:
- Pull fresh data hourly or daily
- Create fully automated workflows
- Get alerted when performance drops
No coding. No manual work. Just clean data, always ready.
Collaborate with your team (or clients)
Need to loop in your media buyer or show your client how a campaign is doing?
- Share one live link instead of static PDFs
- Control access by user
- Add annotations and comments directly in the report
Combine X Ads with other platforms
Google Sheets makes it easy to build cross-platform performance views:
- Blend X Ads with Google, Meta, TikTok, or GA4 data
- Spot which platform performs best for each audience
- Make strategy decisions with all your data in one place
If you’re running performance campaigns and managing multiple data sources, Google Sheets is your universal control panel–and Two Minute Reports is how you power it.
How to export X Ads to Google Sheets?
This article will take you through simple and efficient methods to extract data from X Ads to Google Sheets. To get started, install the Two Minute Reports (TMR) add-on to Google Sheets. Here’s a step-by-step installation tutorial: How to install TMR

Once installed, you can proceed to follow two primary methods:
- Method 1: Connecting X Ads to Google Sheets using the Sidebar
- Method 2: Connecting X Ads to Google Sheets using in-built templates
Method 1: Create an X Ads report using the Sidebar
Step 1: Creating a Connection to your source
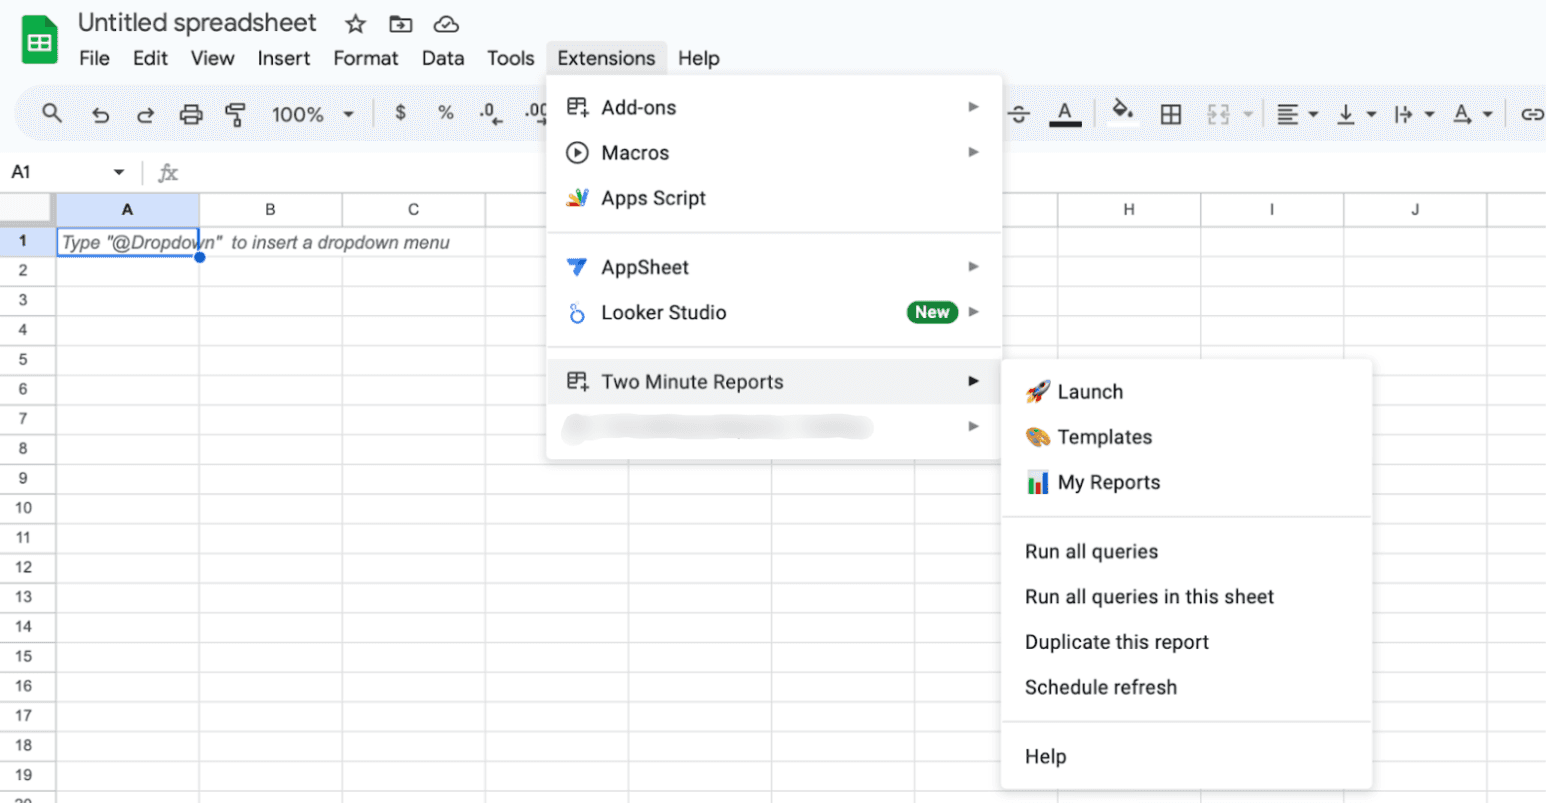
- Open a new Google Sheet and launch TMR from the extensions menu. The TMR sidebar will appear on the right side.
Note: The sidebar serves as the primary interface for TMR, with all its features.
- Navigate to the menu dropdown in the TMR sidebar and click Connections. Next, click Add to create a new Connection.
- The ‘Adding new Connection’ dialog box appears. Here, we will perform three key steps to establish a Connection in Google Sheets, which takes less than 2 minutes:
- Selecting the X Ads Connector
- Authentication
- Mapping your X account with the respective Connector

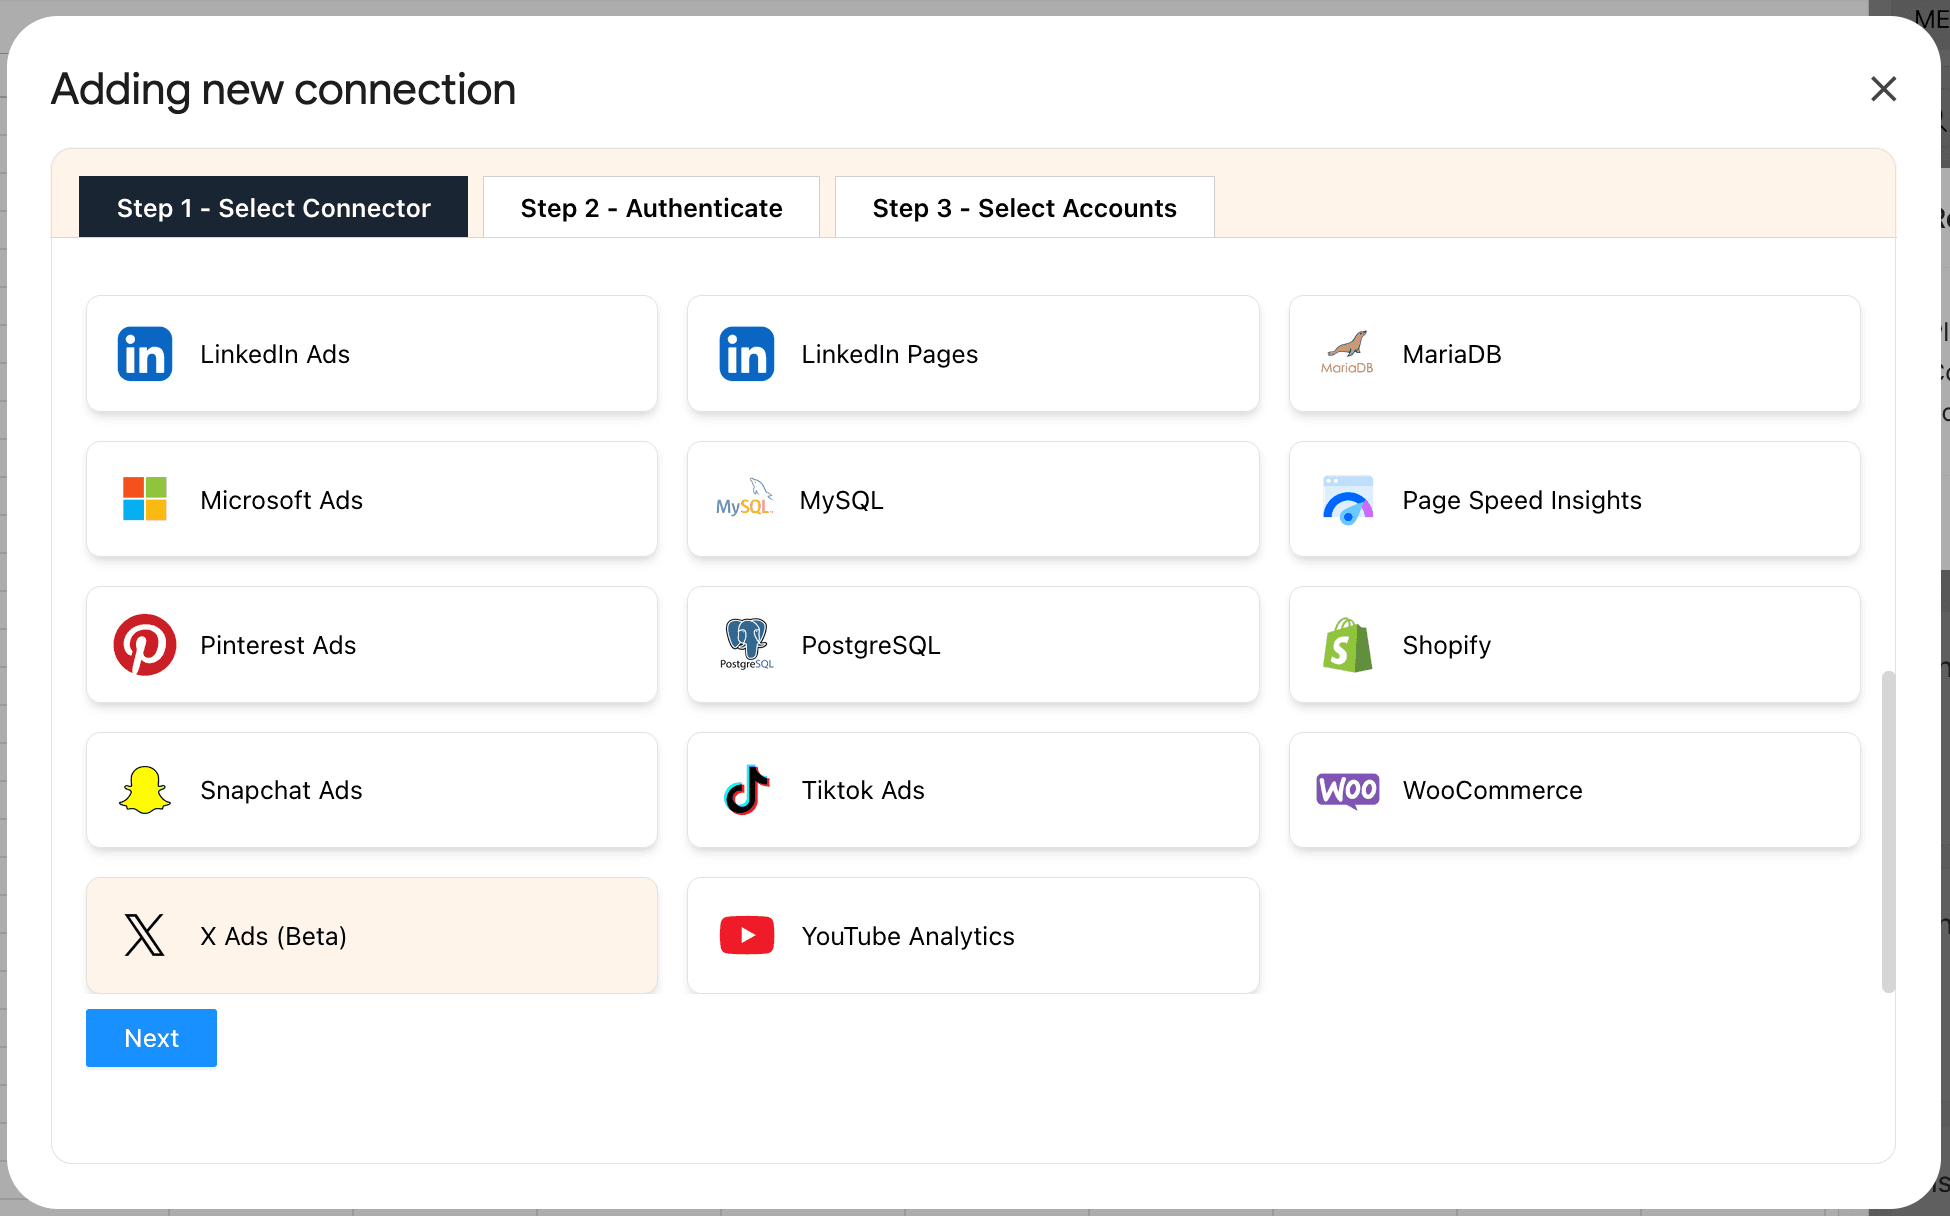
- Select X Ads Connector from the list of options. Next, authorize your Connection by specifying your login credentials.
- Once you’ve successfully authenticated, you’ll visualize a screen displaying your Account name, ID, Connection name, and Status, as shown below:

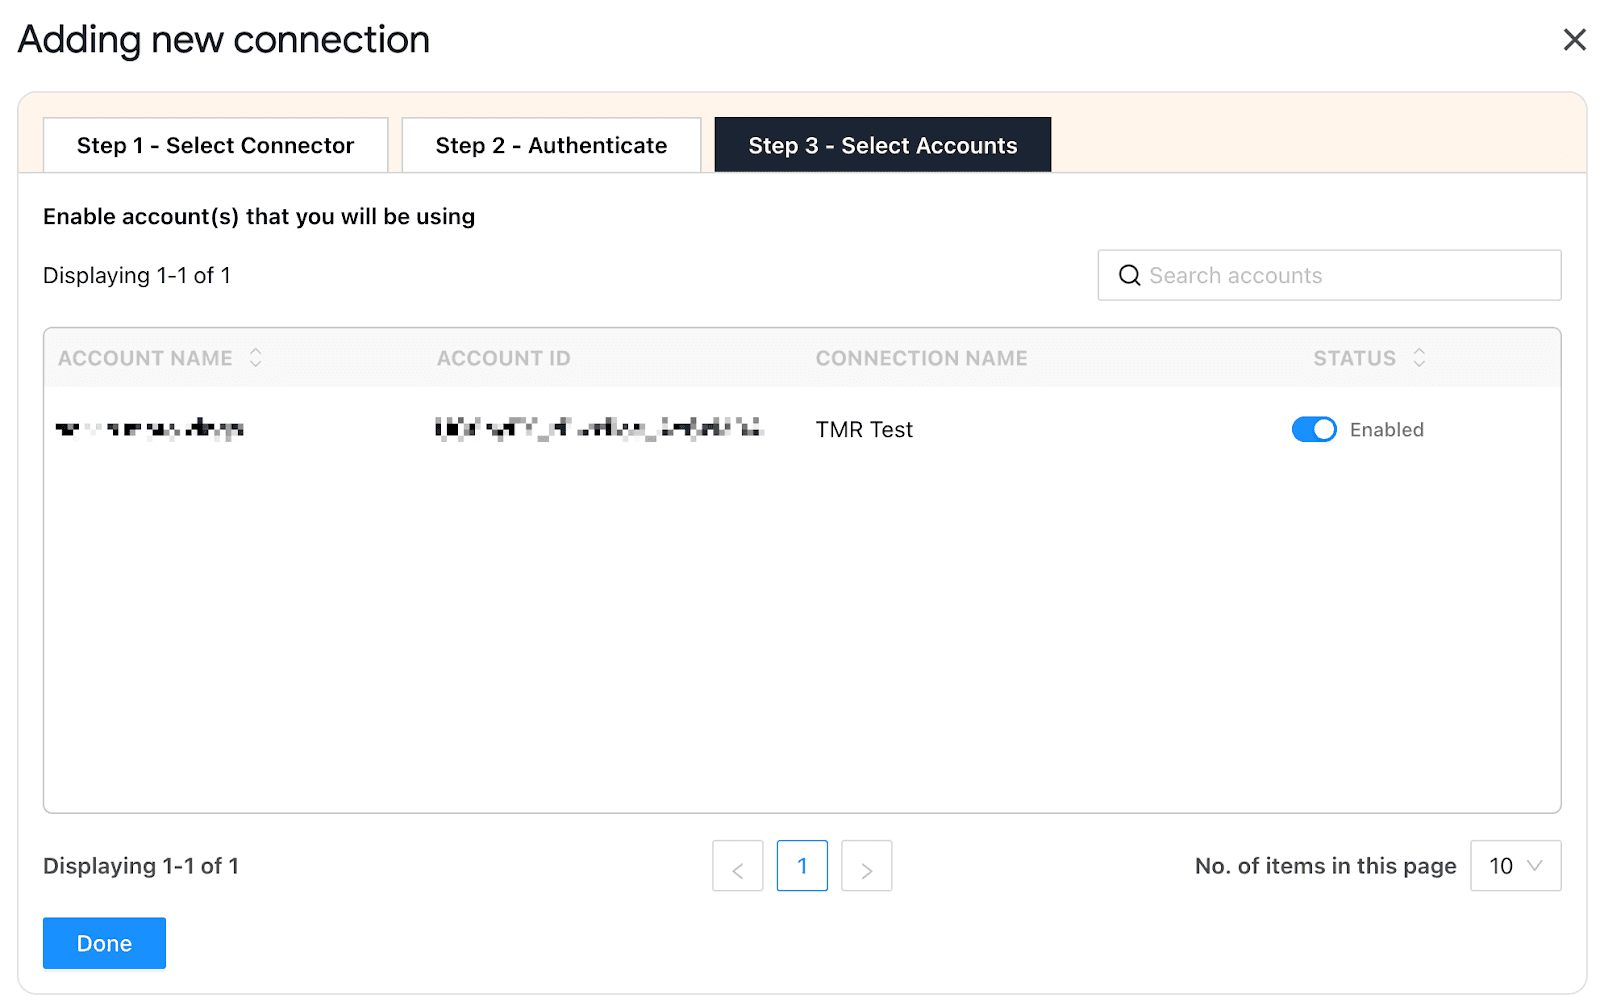
- Enable the toggle for the accounts for which you want to run queries. Please note that you cannot extract data from disabled accounts.
Note: Once you’ve enabled the associated accounts, you can hit “Refresh Connections” to ensure the connected accounts are reflected in the TMR sidebar.
With the Connection established, the next crucial step is to create a query. Let’s explore how to do that.
Step 2: Creating a query and report configuration
To pull your X Ads performance data, navigate to the Data Queries section and create a new query.
- Click Add and choose the respective X accounts to analyze your ad performance.
Note: You can manage multiple client accounts under one roof. Simply select one or more accounts to analyze and gather ad insights.
- Alternatively, navigate to the Clients section. Add your client and map their corresponding X account.
- Click on “Manage Clients” and map the necessary account details. Once done, click “Save & Close” to save your client’s details for future reference.
- Next, add the X Ads metrics and dimensions you want to analyze. Once done, select the date range for which you want to analyze ad performance.

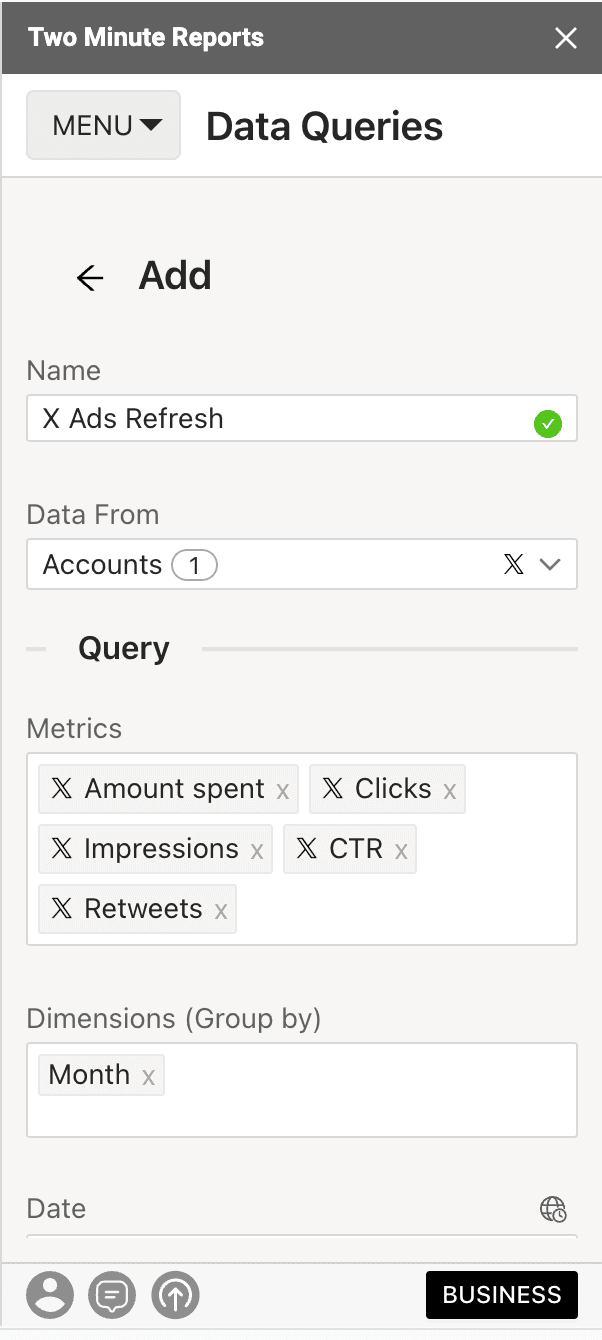
- Next, you have to configure your data reporting by choosing how to customize it. You can also organize and filter your data from within the sidebar.
- Once you finish the above steps, click Run Query to visualize the output. This query fetches the data from the data source onto the sheet and cell of your choice.
Pro TMR Tip: Run all your queries directly from the Extensions menu on your Google Sheets. Go to Extensions > Two Minute Reports > choose your desired quick action.
While creating a report through the sidebar is quite straightforward, there’s also an option to streamline the process further. Let’s look at how to utilize built-in templates for reporting on X Ads.
Method 2: Create X ad reports with templates
Two Minute Reports offers pre-built templates that help you create visual reports quickly. Each template is engineered with the right combination of KPIs and visual aids to serve specific purposes, such as providing an overview or tracking a specific item.
- Once the Connection is created and authorized, you can access the Templates Gallery from the Two Minute Reports sidebar menu.
Note: You can also open the Templates Gallery directly from Extensions > Two Minute Reports > Templates
- In the Template Gallery, you can filter the template that fits your purpose by category or data source. You can also search for specific templates if you have something in mind.
- Once you find the right template, click “Use” to build your template. Then, choose the preferred data source and the relevant Accounts.
- Name your report and click “Submit” to create the report.
Note: Your report will be created in a new Google Spreadsheet.
- Click “Go to your new spreadsheet” to access the new report. Once the new report opens up, launch the TMR sidebar.
- Open the menu next to the “Add” button and click “Run All Queries” to update the template with your data within the date range.
- Once the queries are complete, the template will be updated with your data.
Scheduling data refresh and emails
So far, you have:
- Installed Two Minute Reports (TMR)
- Created a Data Source (X Ads) in TMR
- Created and executed a Data Query that fetches your data
Now you have your data in your Google Spreadsheet. The next time you need fresh data, you can rerun the query.
Or you can automate your data queries.
With the “Schedule Refresh” feature, TMR runs automatically, constantly refreshing your queries to your desired date, time, and duration. This feature is convenient for sending emails, refreshing your spreadsheets with live data, and using them as a dashboard.
Here’s how you set this feature up.
- Click on the menu and then on Schedule Reports to open the section. From this section, you can create a “Schedule,” an instruction for Two Minute Reports to run the query automatically.

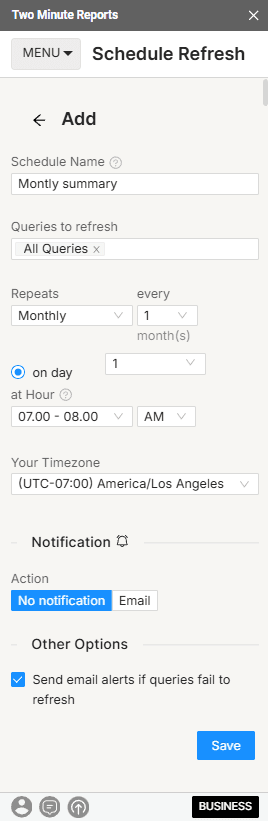
- Name the Schedule and choose the time interval between the data refreshes. From this section, you can choose the following:
- You want your data daily, weekly, or monthly.
- The designated day for the refresh
- The time for the refresh
- Choose the Action for every data refresh— choose whether you need an email notification for every refresh.
- Then choose the relevant sheet for the refresh and type in your email (in case you need an email notification)
- You can also choose to specify the reporting format. You can insert the sheet content in the email body, attach the selected sheet as a PDF or Excel file, or attach the spreadsheet as an Excel file.
- Save the refresh and ensure that TMR will refresh your data at the desired intervals.
Why use Two Minute Reports for X Ads?
If you're managing X Ads campaigns, you know that speed, accuracy, and flexibility are everything. That’s precisely what Two Minute Reports (TMR) delivers – right inside Google Sheets.
Here’s why it’s the go-to tool for marketers and agencies:
Set up in minutes – no coding required
Connect your X Ads account, choose your metrics, and schedule your data pulls. You’ll have clean, structured campaign data in Google Sheets in under two minutes. No APIs, no CSVs.
Bonus: TMR supports automatic refreshes—hourly, daily, or weekly.
All your ad data in one place
TMR isn’t just for X Ads. It supports 30+ advertising and analytics platforms, including:
- Meta (Facebook/Instagram) Ads
- Google Ads
- LinkedIn Ads
- TikTok, GA4, Shopify, and more
That means you can blend X Ads with other channels for unified reporting—all in the same sheet.
Prebuilt dashboards and templates
Skip building reports from scratch. Use TMR’s ready-to-use templates for X Ads performance, creative analysis, and campaign pacing—customizable for your client or in-house use.
Pro tip: Templates make onboarding new clients or accounts lightning-fast.
Share reports automatically
Set up automated email reports for clients, stakeholders, or internal teams—formatted and sent at your chosen frequency.
No need to update and send manually ever again.
Built for scale
Manage multiple ad accounts across clients? TMR handles:
- Multiple X Ads accounts in one report
- Scheduled syncs
- Blazing-fast, reliable reports with Speedboost
AI-powered reporting assistance is underway.
Two Minute Reports isn’t just a collection of Connectors–it’s your reporting assistant, your time-saver, and your campaign command center. For marketers who want data without the drag, it’s a no-brainer.
Advanced tips to optimize X Ads performance using Google Sheets
Getting your X Ads data into Google Sheets is just step one. For marketers and agencies, the real value lies in turning that data into actionable insights – faster, smarter, and with minimal manual effort.
Here’s how to do that using Two Minute Reports and Google Sheets together:
Build a Performance Index to compare campaigns fairly
When you’re managing dozens of campaigns across clients or objectives, comparing just ROAS or CTR in isolation isn’t enough. Different campaigns serve different goals, so you need a composite view.
How to do it:
- Pull in KPIs like ROAS, CTR, CPM, and conversion rate via TMR
- Normalize them using Z-score or scale them between 0 and 1
- Assign weights based on your strategy (e.g., 50% ROAS, 30% CTR, 20% Conv. Rate)
- Create a Performance Index score = (Normalized ROAS × 0.5) + (CTR × 0.3) + …
Why it matters: This gives you an apples-to-apples metric to compare brand, awareness, and performance campaigns—perfect for prioritizing spend or presenting to clients in a single scorecard.
Pro tip: Add conditional formatting to auto-rank campaigns and visualize shifts week over week.
Automate Week-over-Week and Month-over-Month change reports
Clients and stakeholders love seeing growth trends, but manual snapshots take time and are prone to errors. With Two Minute Reports, you can build auto-refreshing WoW and MoM trackers inside Sheets.
How to do it:
- Schedule daily or weekly TMR pulls
- Use custom date ranges like “This week” and “Last week”
- Calculate change% with formulas like =(ThisWeekCTR - LastWeekCTR) / LastWeekCTR
- Add trend arrows or bars with conditional formatting
Why it matters: Instead of just saying “CTR is 2.3%,” you can say, “CTR is up 14% WoW” – a much more powerful insight for optimization and reporting.
Pro tip: You can also use TMR’s built-in email scheduler to send these delta reports weekly, fully automated.
Track and predict creative fatigue
Even high-performing creatives lose impact over time due to audience burnout or repetition. Ignoring this leads to wasted budget.
How to do it:
- Pull daily CTR or engagement rate per ad creative
- Use a moving average (7-day or 14-day) to track trends
- Highlight creatives with a >25% drop from peak CTR
- Create a "Fatigue Risk" column to flag underperforming ads
Why it matters: Replacing fatigued creatives proactively can improve performance without increasing spend, a key lever in maximizing ROAS.
Pro tip: Build a dedicated creative monitoring tab in your Sheet that updates daily via TMR.
Identify budget efficiency zones
More spending doesn’t always mean better returns. Use Sheets to discover diminishing returns thresholds.
How to do it:
- Group campaigns into spend buckets (e.g., <$500, $500–$1000, $1000+)
- Analyze ROAS, CPA, and conversion rate for each group
- Use scatter plots to visualize spend vs. ROAS
Why it matters: You’ll quickly spot which campaigns have room to scale and which ones hit diminishing returns. This helps you reallocate budgets with confidence.
Pro tip: Combine this view with your cross-platform spend data for a full-funnel efficiency map.
Blend X Ads data with CRM or first-party conversions
Surface-level metrics like "leads" or "form fills" don’t tell you much. Instead, connect ad data with real outcomes–qualified leads, sales, or LTV.
How to do it:
- Use TMR’s API Bridge Connector to pull lead outcomes or CRM status into Sheets
- Match with X Ads campaigns using UTM parameters or form IDs
- Calculate the cost per qualified lead or the cost per closed deal
Why it matters: This helps you attribute spend to actual business value, not vanity metrics, and optimize toward what drives revenue, not just traffic.
Pro tip: Share this blended report with your sales or ops teams to close the attribution loop.
Cross-channel comparison and efficiency analysis
If you’re running campaigns on Meta, Google, LinkedIn, and X Ads, it's critical to analyze them side by side.
How to do it:
- Pull data from multiple platforms using TMR into the same Sheet
- Normalize key metrics like CPC, CPA, ROAS
- Build a performance comparison table and highlight:
- Best channel for the lowest cost per result
- Highest engagement per dollar
- Best creative format per platform
Why it matters: This view gives you the confidence to shift budget based on data, not intuition, and creates a strategic narrative for stakeholders or clients.
Pro tip: Include this analysis in monthly wrap-up decks to show value across the whole media mix.
With real-time data flowing from Two Minute Reports, Google Sheets becomes more than a reporting tool. Use it not just to report, but to diagnose, predict, and optimize your X Ads strategy with clarity and speed.
Want visual dashboards too? Get your X Ads data in Looker Studio
Two Minute Reports doesn’t just bring your X Ads data into Google Sheets; it also connects seamlessly with Looker Studio (formerly Google Data Studio) for marketers who want live, visual dashboards.
With TMR for Looker Studio, you can:
- Pull real-time data from X Ads into interactive dashboards
- Combine X Ads with other platforms (like Meta, Google, or LinkedIn)
- Visualize performance by campaign, audience, or creative using charts, scorecards, and time-series graphs
- Share client-facing dashboards that auto-refresh – no manual updates required
Ideal for agency reports, weekly reviews, or executive summaries.
Why use both: Google Sheets + Looker Studio
Some marketers prefer data modeling in Sheets and visual storytelling in Looker Studio with Two Minute Reports; you don’t have to choose.
- Use Sheets to clean, blend, and analyze raw data
- Connect that Sheet to Looker Studio for automated dashboarding
- Build custom data workflows with both tools fully synced
Pro tip: Many agencies use TMR to automate data pulls into Sheets, then feed that structured data into Looker Studio for visual client reporting.
Click here to check out all TMR integrations.
Frequently Asked Questions
From X Ads, you can extract core data like impressions and clicks, and more advanced insights. Using Pixel-tracking you can even monitor user actions after they interact with your ads, giving you a fuller picture of your campaign's impact.
To export X Ads data to Google Sheets in under two minutes, you must install the Two Minute Reports add-on.
- Download Two Minute Reports (add-on) to Google Sheets
- Open the Two Minute Report add-on from a spreadsheet
- Connect your X Ads account to Two Minute Reports
- Create a query with the required metrics and dimensions (data) for your reports
- Run the query and get data in the spreadsheet.
To automate data exports from X Ads to Google Sheets, you can schedule reports using TMR. Under the "Schedule Refresh" tab, you can automate your report to refresh automatically at your desired date, time, and duration, with a copy sent to your inbox.
Yes. Two Minute Reports supports data from all X Ads accounts, including those under X Pro or Business. As long as you have ad account access, you can connect and pull data – no extra setup needed.
Two Minute Reports supports multiple X Ads accounts. You can pull data from each into a single Google Sheet or separate tabs. Ideal for agencies, freelancers, and marketing teams managing multiple brands or clients.
Absolutely. You can:
- Fetch all campaigns in one query
- Or filter by campaign name, ID, or objective
- Create separate tabs or dashboards per campaign, client, or goal
TMR gives you full control to structure your data the way you need it.
Yes. Two Minute Reports allows you to pull historical campaign data from X Ads – whether that’s from last week, last year, or custom date ranges. You can fetch performance over time and analyze trends directly in Sheets.
You can schedule data to refresh hourly, daily, weekly, or at custom intervals. TMR lets you set up refresh triggers so your reports always reflect the latest ad performance, without lifting a finger.
No coding required. TMR is a no-code Google Sheets add-on. All you need is access to the ad account – you choose the metrics, set the schedule, and TMR handles the rest.
Yes, you can connect and report on multiple X Ads accounts in the same spreadsheet or dashboard. Perfect for agencies or consultants managing several clients.
TMR supports all standard and advanced metrics from the X Ads API, including:
- Impressions, Clicks, CPC, CTR, CPM
- Conversions, Cost per Result, Spend
- Campaign Name, Ad Group, Creative performance
- Engagement metrics (retweets, likes, replies, etc.)
Yes. One of the biggest advantages of TMR is that you can blend data from multiple sources – X Ads, Google Ads, Meta, LinkedIn, GA4, and more – into one unified report in Sheets or Looker Studio.
Yes! You get a 14-day free trial of all features. No credit card required. Perfect for testing your reporting setup before committing. Try it out here.
Yes. TMR uses Google-approved authentication and follows data privacy best practices. Your data stays in your Google Sheets—TMR simply automates the connection and refresh.
We offer live chat support, email support, and a growing library of tutorials and templates. Whether you're stuck connecting your account or optimizing a dashboard, our team is ready to help.