
Summarize this blog post with:
Did you know that 66% of shoppers start their product search directly on Amazon and not Google?
This highlights the importance of tracking the right Amazon Seller Central metrics to stay ahead of the competition. If your products aren’t showing up where customers are actively searching, you’re already falling behind.
Remember that the metrics you track are not just numbers; they are your roadmap for growing your online business. Whether you’re facing an inventory demand, a drop in sales within a specific category, or frictions in customer purchasing patterns, the right set of Amazon Seller metrics can help you identify and address these challenges with precision.
In this article, let’s explore the top 11 Amazon Seller metrics that let you streamline your ROI and boost profits. Plus, you’ll also learn how to track and automate your store’s sales, inventory, order fulfillment and customer feedback using a reliable reporting tool to stay competitive.
Let’s get started.
Advertising metrics
Track the effectiveness of your Amazon advertising campaigns and understand how your ad spend translates into high engagement and sales.
1. ROAS (Return On Ad Spend)
ROAS measures the revenue generated for every dollar spent on advertising. It is calculated by dividing the total sales by the total ad spent.
Why it matters:
A high ROAS indicates that your ad is profitable, whereas a lower one signals that your ad strategy requires optimization.
Pro tip:
Regularly analyze the performance of different keywords, product placements, and ad creatives. If ROAS is lower than expected, try adjusting your bids or pausing underperforming ads. Additionally, experiment with different ad types (e.g., Sponsored Products vs. Sponsored Brands) to see what delivers the best return.
2. Advertising Cost of Sales
ACOS is the percentage of your revenue that is spent on advertising. It is calculated by dividing ad spend by ad revenue.
Why it matters:
A lower ACOS means you’re spending less for each sale, which translates into better profitability. It is the key to measuring your ad spend efficiency.
Pro tip:
Monitor your ACOS closely. If it's high, reassess your bids, ad placements, and targeting. Ensure your messaging clearly speaks to the most relevant audience.
Note:
ROAS – the higher the better
ACOS – the lower the better
3. Conversion rate
The conversion rate is the percentage of visitors who make a purchase. It’s calculated by dividing the number of sales by the number of visitors to the listing.
Why it matters:
A higher conversion rate indicates that your product listings are effective at converting traffic into sales. If it's low, consider optimizing your product placement, keywords, page navigation, and frictions in call-to-actions.
Pro tip:
Improve your conversion rate by optimizing your product images, descriptions, and pricing strategy. A/B test your product titles and copies to see what resonates best with customers.
Sales Performance
Sales performance metrics help you measure the success of your products in terms of revenue, sales volume, and Buy Box competitiveness.
4. Average Sales per Order Item
This metric tracks the average number of items sold per order. It helps you gauge how well your products are bundled or cross-sold.
Why it matters:
A higher average sales per order item indicates that customers are purchasing more items, which directly boosts your revenue and profit margins.
Pro tip:
Use bundling and upselling strategies to increase the average sales per order item. Consider offering discounts or free shipping for larger purchases to encourage customers to buy more.
5. Total Sales
Total sales represent the overall revenue generated from your Amazon store, including all products sold.
Why it matters:
Monitoring total sales allows you to track overall business health. A drop in total sales can indicate issues with your product listings, inventory, or external market conditions.
Pro tip:
Regularly track your total sales and compare them to seasonal trends or marketing campaigns. Use Two Minute Reports’ pre-built Amazon Seller templates to identify any sales gaps or areas for improvement and automate real-time tracking.
6. Buy Box Percentage
This Amazon Seller metric shows the percentage of time your product wins the Buy Box, the prime spot on an Amazon listing where customers can add items to their cart.
Why it matters:
Winning the Buy Box is essential for driving sales, as most Amazon shoppers purchase from the Buy Box. A lower Buy Box percentage can indicate issues with pricing, seller ratings, or fulfillment.
Pro tip:
To win the Buy Box, ensure your prices are competitive, your inventory is stocked, and your customer service is top-notch. Regularly check (recommended weekly) your Amazon seller metrics to maintain a healthy account and boost your Buy Box percentage.
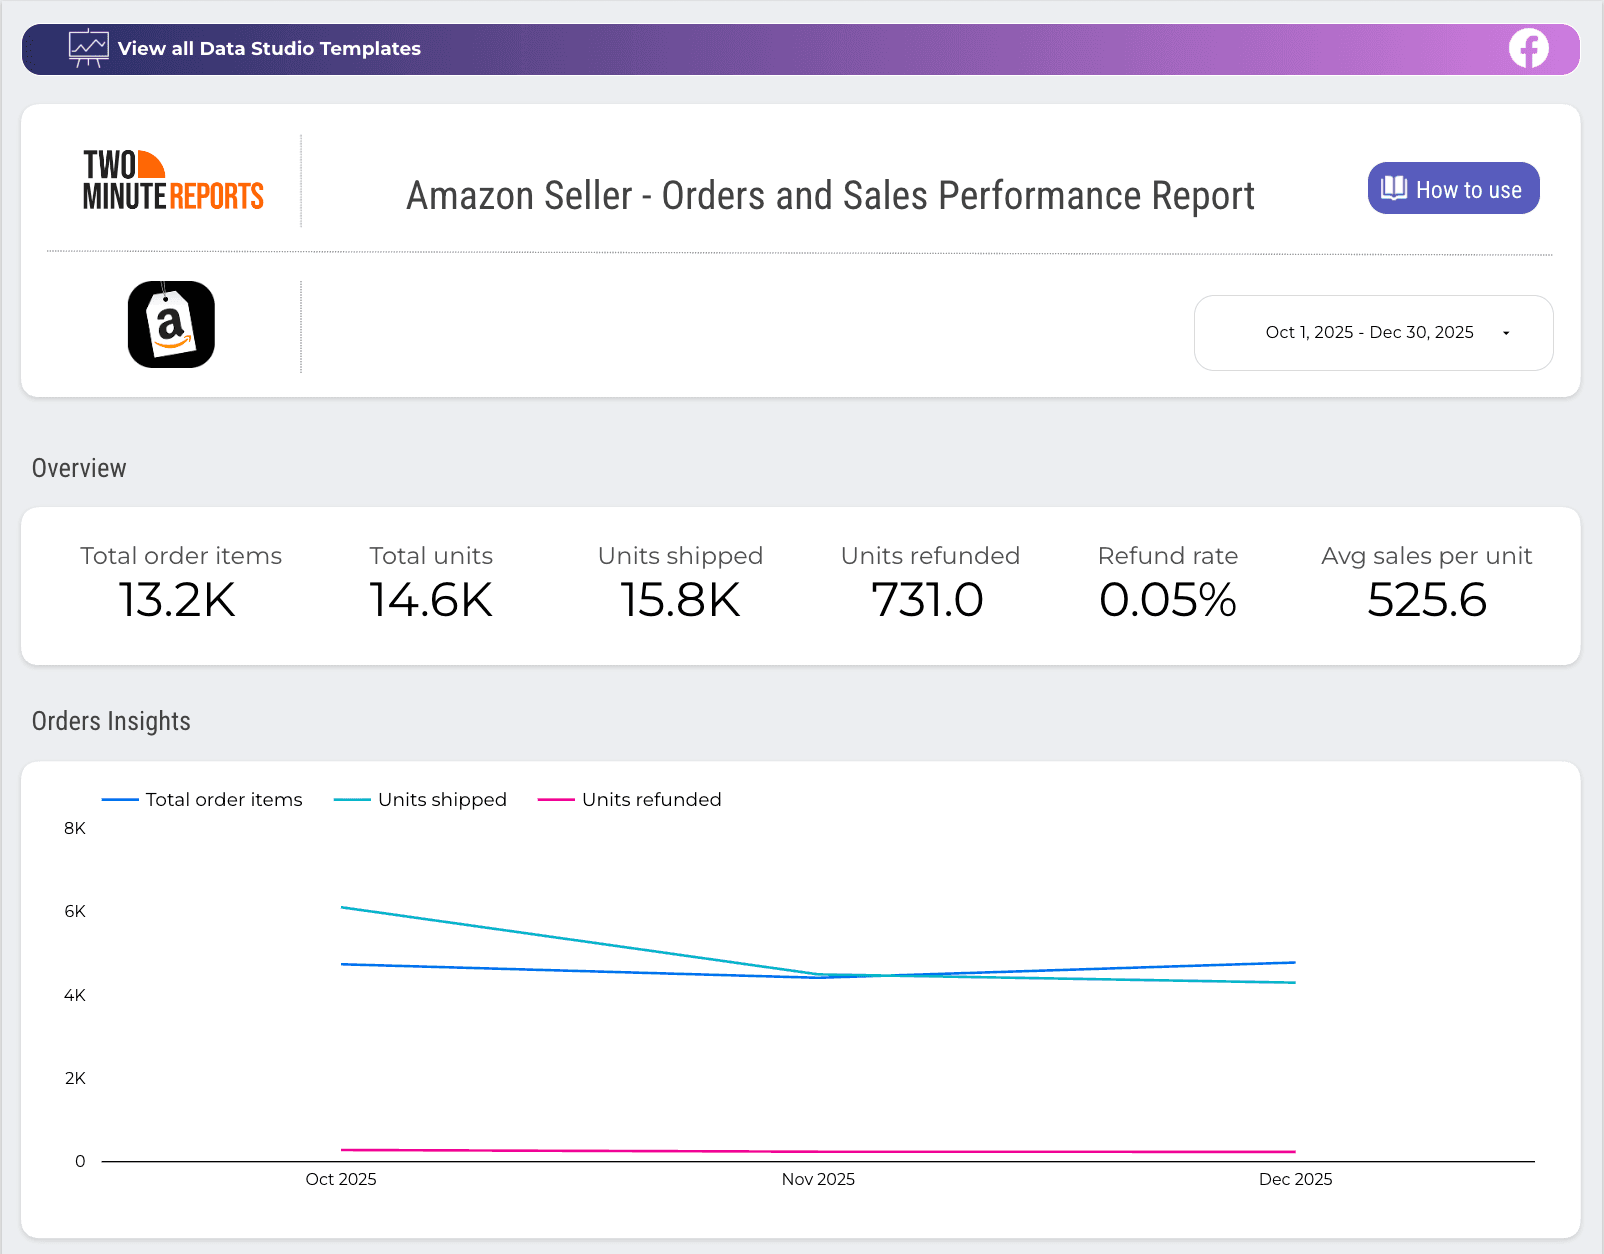

Track orders, average sales per unit, refund rate, feedback insights, page views and more with this ready-to-share Amazon Seller template. Quickly identify what’s performing well, pinpoint areas of improvement, and take action to improve your profit.
Inventory performance
These metrics assess how efficiently you manage your inventory, including stock levels, sales rates, and the ability to fulfill customer orders on time without overstocking or running out of stock.
7. Inventory Performance Index (IPI)
The IPI is a score Amazon assigns to sellers based on their inventory management performance. The following factors impact your IPI score:
- Issues in product listing.
- Amount of excess inventory.
- Inventory in FBA that isn’t sellable.
Why it matters:
A high IPI indicates that you’re effectively managing your inventory, while a low IPI can lead to storage limitations and increased fees.
Pro tip:
Avoid both overstocking and stockouts, as both negatively affect your business and costs. Regularly review inventory performance and ensure your score is above 450.
8. Stockout rate
The stockout rate is the percentage of time a product is out of stock, leading to lost sales opportunities.
Why it matters:
High stockout rates result in missed revenue, decreased Buy Box eligibility, and poor customer experience. The Amazon algorithm considers that out-of-stock products aren’t popular and decreases their organic ranking. Keeping items in stock is essential for maintaining sales momentum.
Pro tip:
Set up automatic inventory alerts to ensure you never run out of stock. Analyze sales trends to anticipate demand spikes and avoid stockouts during peak seasons.
9. Fulfillable quantity
This is the number of units of your products that are currently available to fulfill customer orders, taking into account your inventory levels and Amazon’s processing time.
Why it matters:
Keeping your fulfillable quantity high ensures that you can quickly meet customer demand. A drop in this number can lead to delays in fulfillment, which can negatively affect customer satisfaction, ratings and revenue.
Pro tip:
Make sure you're replenishing stock in time to avoid any delays in order processing.
Customer Satisfaction Metrics
Helps you track how well you’re meeting customer expectations, measuring feedback, returns, and defects to ensure a positive shopping experience that drives repeat business and higher ratings.
10. Order Defect Rate (ODR)
The ODR is the percentage of orders with negative feedback, late shipments, returns, or order cancellations.
Why it matters:
A low ODR indicates that customers are satisfied with their purchases, while a high ODR can negatively impact your seller performance and eligibility for certain Amazon features.
Pro tip:
Keep your ODR low (under 1%) by addressing customer complaints quickly, ensuring timely shipping, and maintaining high-quality products. Proactively resolving issues helps improve your reputation and customer satisfaction.
11. Seller Feedback Rating
This is the rating Amazon customers leave based on their satisfaction with a seller's product and service, usually on a scale of 1 to 5 stars. Aim to secure 4.7 stars with 90-95% positive feedback.
Why it matters:
A high seller feedback rating boosts your credibility and trustworthiness, which can lead to more sales. A low rating can deter potential buyers.
Pro tip:
Actively encourage satisfied customers to leave feedback, and resolve any negative feedback promptly. Responding professionally to negative reviews and improving customer service can significantly enhance your rating over time.
Your Amazon Seller Metrics Action Plan
Now that you know what metrics to track, let us explore the dedicated mastery plan to optimize your Amazon Seller Central performance. Here’s how:
- Building custom dashboards to track key Amazon Seller metrics.
- Important questions to ask during weekly and monthly performance reviews.
Build real-time dashboards to track Amazon Seller Central performance
With Two Minute Reports’ Amazon Seller Reporting tool, you can track sales, page traffic, inventory, and order performance in a single dashboard. Here’s how you can do that in 4 simple steps:
1. Install the Two Minute Reports add-on from the Google Workspace Marketplace.
2. Launch the Two Minute Reports add-on in your spreadsheet. Next, connect your Amazon Seller accounts to Google Sheets to import your seller accounts to Google Sheets.
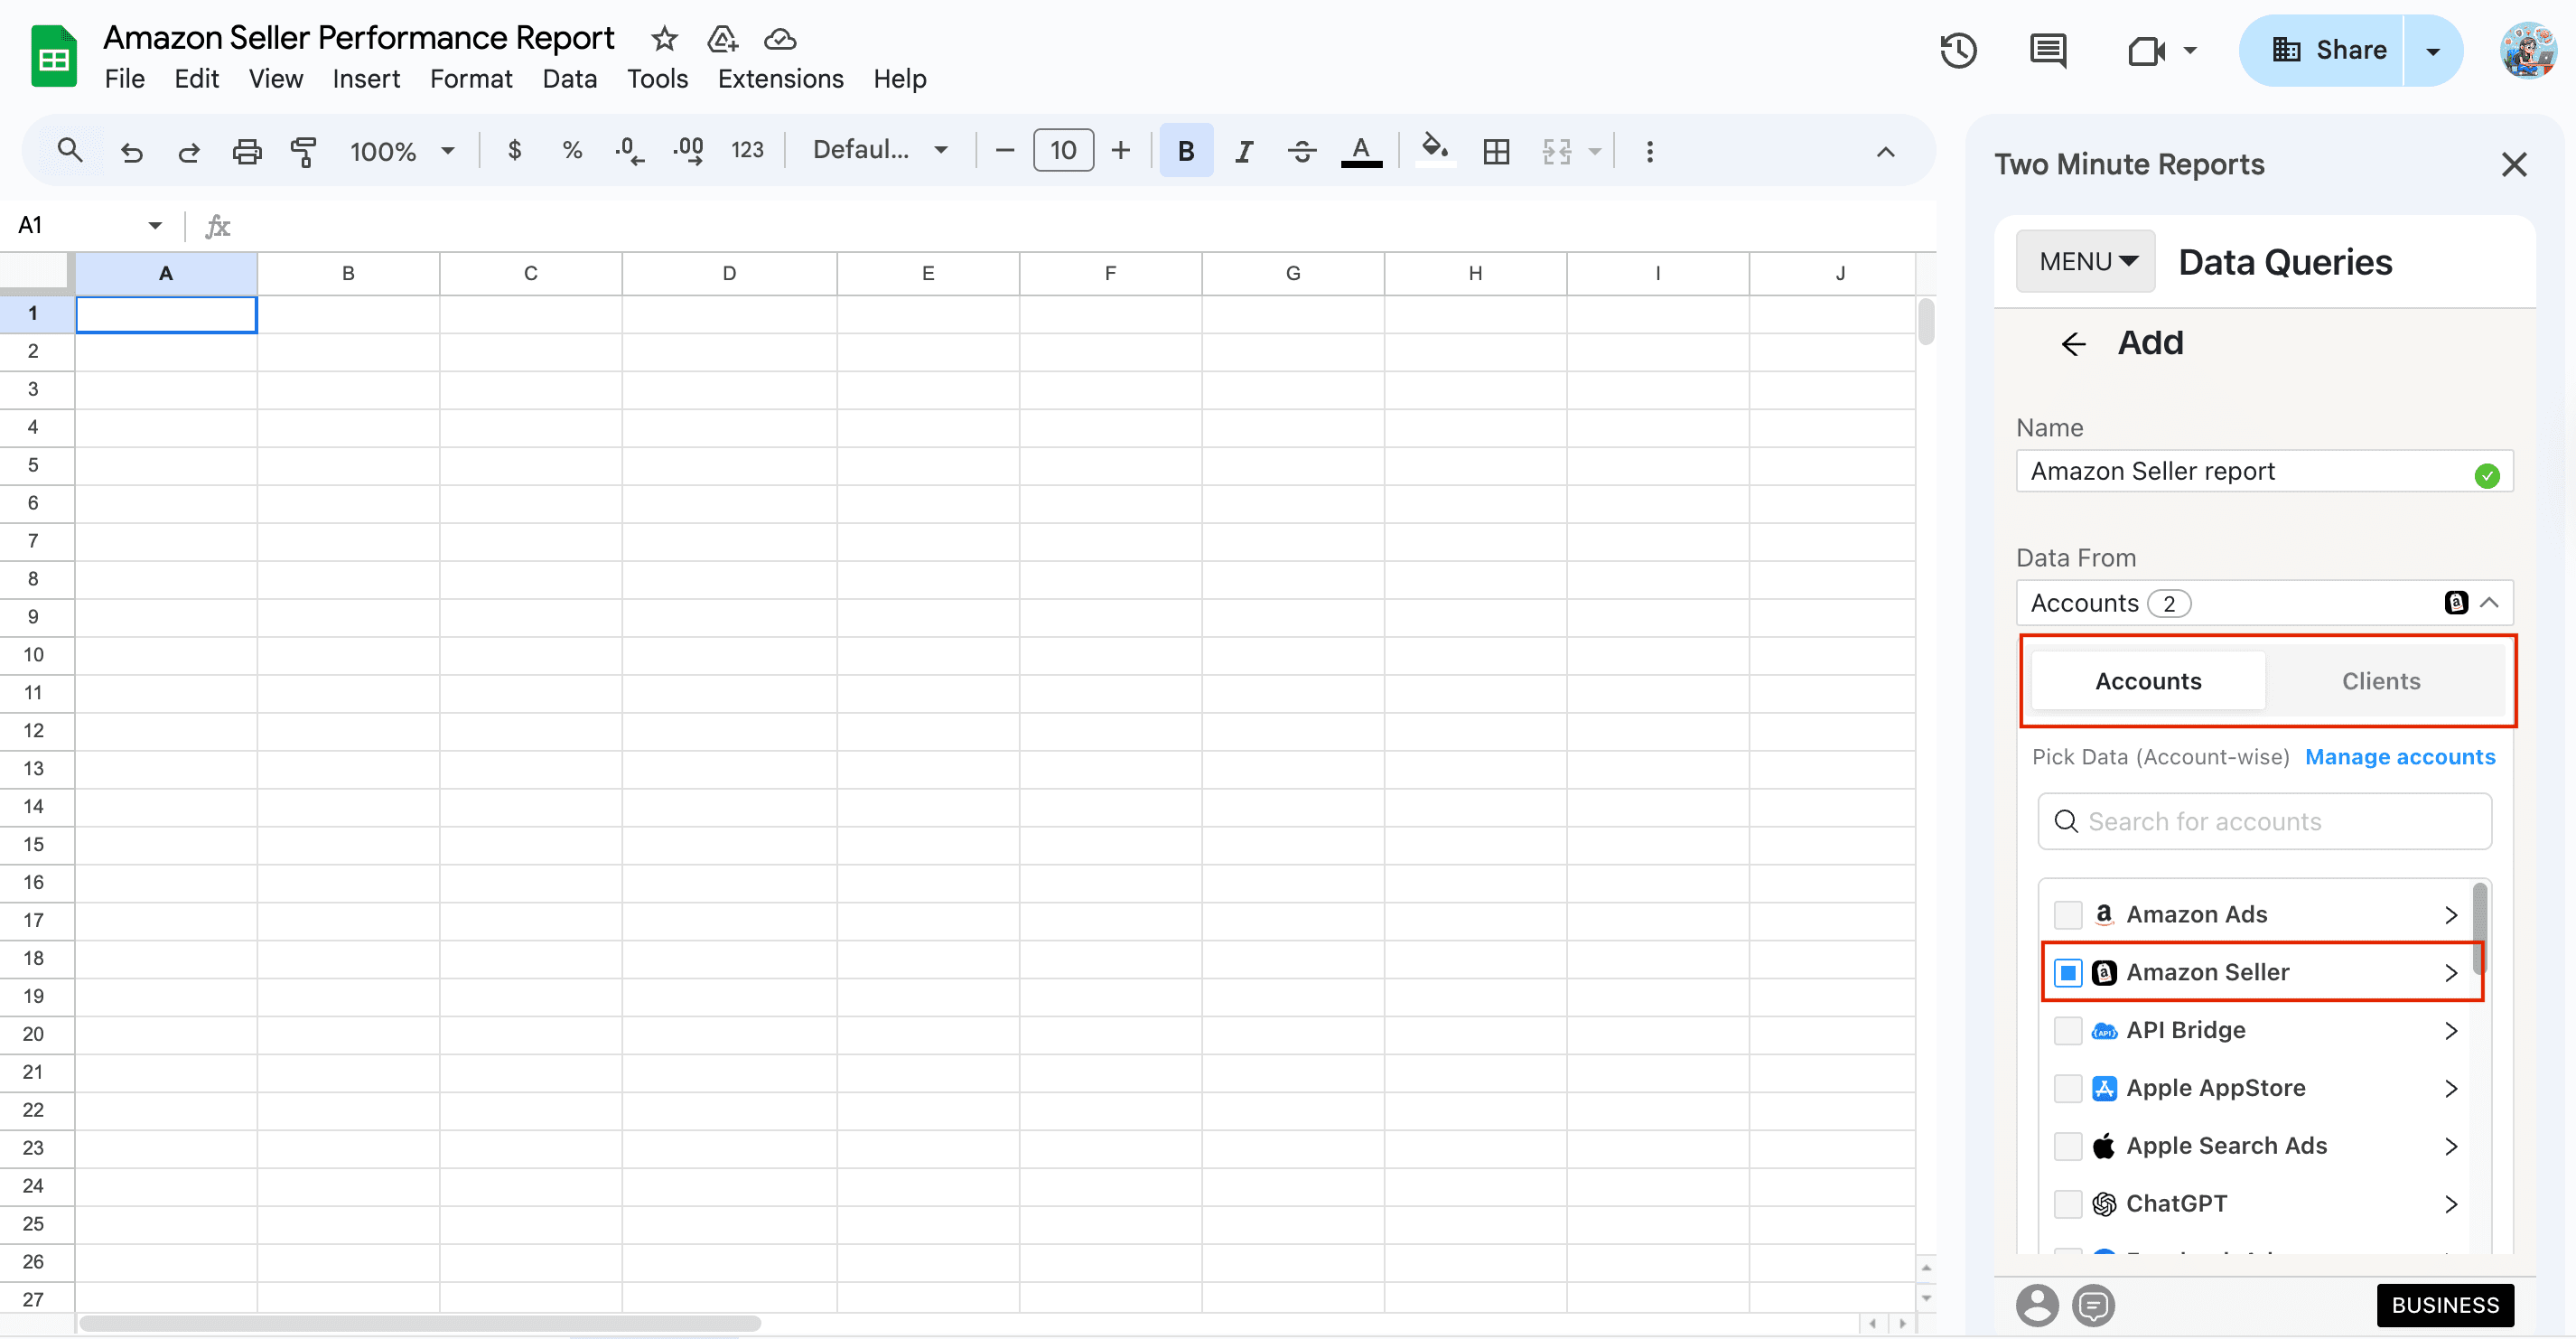

3. Once done, select the Amazon Seller accounts for which you want to track performance – specify the metrics, dimensions, date range and run your query.
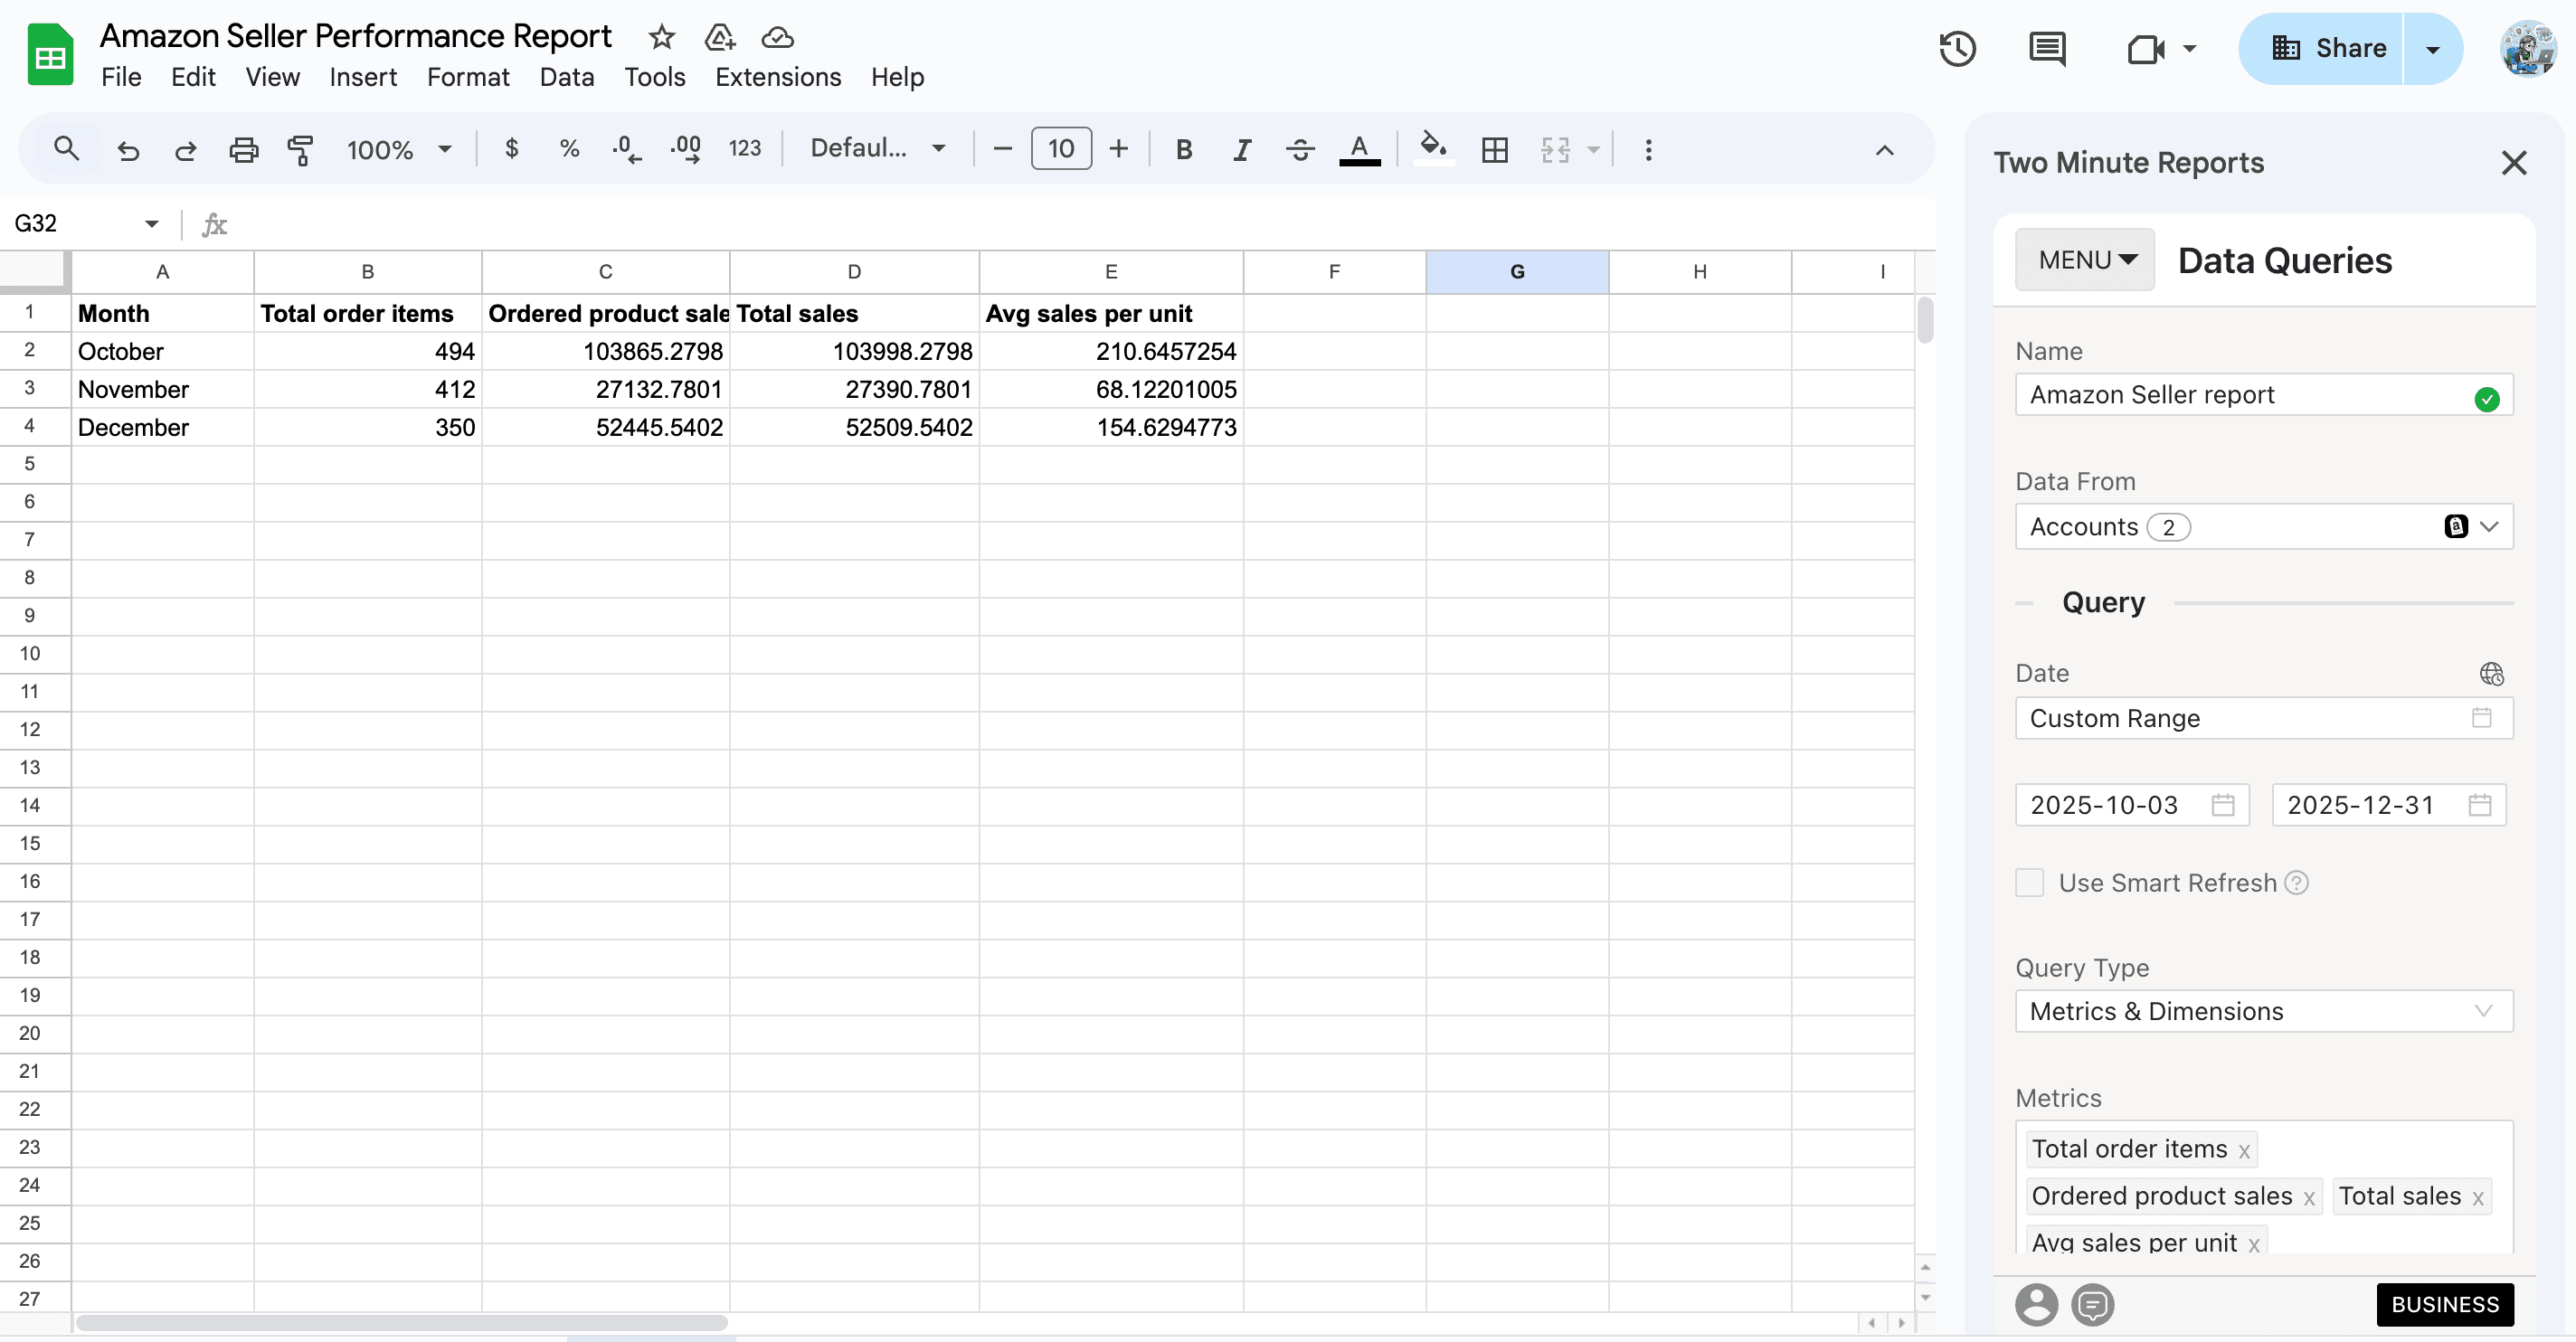
4. That’s it. You can visualize actionable Amazon Seller performance insights in a single dashboard. And the best part? Your reports load 3x faster due to the proprietary Speedboost technology – no more data delays or inconsistencies.

Pro Two Minute Reports tip:
- You can set up automated refresh schedules (daily, weekly or monthly) to access real-time insights and stay proactive with your strategies.
- When selecting the date range for your Amazon sales and performance reports, you can also use the Custom Range (cell reference) option. Simply enter the start and end dates in the required cells. After that, you can periodically update the dates in those cells and your reports get refreshed dynamically.
- You can also connect your Amazon Seller accounts to Looker Studio and share visually compelling, fast-loading dashboards with your clients.
Weekly performance review:
- Are my key products consistently winning the Buy Box this week?
- Has my advertising ROAS improved or declined this week?
- What is the current stockout rate, and do I need to restock any products?
Monthly performance review:
- What is the sales growth percentage compared to the previous month?
- Which key metric improved and declined the most?
- Which key external factors affected my sales performance?
Wrapping Up
Tracking the right Amazon Seller Central metrics is essential for staying competitive in a marketplace that’s constantly evolving. Whether you want to improve sales performance, streamline inventory, or increase customer satisfaction, each metric provides crucial insights into the health of your business.
Don’t forget this: Success on Amazon isn’t just about selling – it’s about selling smart. Leverage these key Seller Central metrics to strengthen visibility and dominate the Buy Box. With Two Minute Reports’ Amazon Seller reporting tool, you can track what matters, access real-time insights faster and drive sustainable strategies to maximize ROI.
Frequently Asked Questions
The key metrics include ROAS, conversion rate, Buy Box percentage, IPI and Seller Feedback rating. Tracking these metrics helps you optimize your ads, improve sales, manage inventory, and boost customer retention.
You should review your Amazon Seller metrics regularly – weekly for ads and sales performance, and monthly for inventory and customer satisfaction. You can set up custom refresh schedules (daily, weekly, monthly) to stay ahead of what’s happening in real-time and make improvements in refining your strategies.
With Two Minute Reports’ Amazon Seller templates, you can build ready-to-share dashboards in both Google Sheets and Looker Studio. All you have to do is connect your Amazon Seller account, specify key KPIs and visualize actionable sales performance insights auto-populated in your dashboard.
Focus on optimizing your product listings. Use high-quality images, write compelling product descriptions, and include customer reviews. A/B test different titles, product descriptions, and pricing to identify what works best for converting visitors into buyers.
Related Blogs


Meet the Author
Shalini MuruganShalini is driven by ideas that create a tangible impact. At Two Minute Reports, she specializes in content that helps marketers optimize their reporting workflows. When she's not transforming complex data into meaningful insights, you might find her lost in a book, jotting down ideas in her notebook, or connecting the dots others overlook.
