
Summarize this blog post with:
You launched the campaign. Set the budget. Picked the audience. Hit publish.
And then you watched the numbers roll in, impressions, clicks, a handful of conversions, and thought: Is this actually working?
Most advertisers never get a clear answer to that question. Why? It’s because checking Ads Manager shows only some green arrows that we call it a win, whereas the big picture is still in shadows. But surface-level metrics don't tell you why a campaign is performing, which audiences are actually converting, or where your budget is silently bleeding out. That gap between data and insight is one of the most expensive mistakes in digital advertising.
This guide closes that gap.
Whether you're managing a modest monthly budget or scaling campaigns across multiple markets, understanding your Facebook Ads analytics is what separates advertisers who grow from those who guess. We'll walk you through the metrics that actually matter, the native tools Meta gives you, advanced analysis techniques, and when it makes sense to go beyond the platform entirely.
What Is Facebook Ads Analytics?
Facebook Ads analytics is the practice of tracking, measuring, and interpreting data from your Meta ad campaigns to make better decisions about where to spend, what to say, and who to target.
It is not a single tool. That is a common misconception. Many advertisers treat Meta Ads Manager as synonymous with Facebook Ads analytics, but the platform is just one piece of a much larger picture. True analytics encompasses everything from initial conversion tracking setup to multi-channel attribution, audience segmentation, creative performance diagnosis, and funnel analysis.
At its core, Facebook Ads analytics covers four interconnected practices:
- Tracking: Capturing the right data points across your campaigns, from clicks and impressions to purchases and customer lifetime value.
- Measurement: Applying the correct metrics and attribution models to understand what your data actually means.
- Performance Analysis: Identifying patterns, diagnosing underperformance, and understanding which variables are driving results.
- Optimization: Using those insights to adjust bids, budgets, audiences, creatives, and campaign structure for better outcomes.
Meta Ads Manager is where most advertisers start, and for good reason. It gives you campaign-level reporting, audience breakdowns, delivery diagnostics, and real-time spend tracking. However, it only shows you what happens inside Meta's ecosystem. It cannot tell you how a Facebook ad contributed to a sale that started on Google, or how your paid campaigns interact with organic traffic and email touchpoints.
That is the limitation that separates basic reporting from real analytics. Advertisers who consistently improve their ROAS are not just reading Ads Manager metrics. They are building a comprehensive measurement practice for their campaigns, one that links ad data to actual business outcomes.
Why Facebook Ads Analytics Matters More Than Ever in 2026
Facebook advertising has never been more competitive, and the numbers prove it.
The number of advertisers on the platform has more than doubled recently, increasing auction pressure across all industries. The cost impact is real: lead-generation costs alone spiked by roughly 21% year over year in 2025, while traffic campaigns saw only marginal efficiency gains. You are paying more, competing harder, and working with audiences that have seen it all before.
a) The algorithm delivers. You still have to think.
Meta's AI-driven tools, such as Advantage+ and dynamic creatives, make launching campaigns easier. But the algorithm decides who sees your ad. It cannot tell you whether your offer is wrong, your creative is worn out, or a different audience would cut your CPA in half. That interpretation is on you, and it requires data.
b) Ad fatigue is a silent budget drain.
When frequency climbs and CTR drops, your audience has tuned you out. Most advertisers do not catch this until performance has already fallen off and budget has been wasted. Frequency analysis is one of the simplest analytics methods, and one of the most overlooked.
c) Not analyzing has a real cost.
Advertisers who skip proper analytics tend to scale campaigns that appear profitable but quietly cannibalize one another, run creatives past their effective lifespan, and optimize for clicks rather than revenue. Each mistake has a direct dollar cost.
Analytics does not just tell you what happened. It tells you what to do next.
Core Facebook Ads Metrics You Must Track
Ads Manager gives you hundreds of data points. Most of them are noise. These eight metrics are the ones that actually tell you whether your campaigns are healthy, efficient, and worth scaling.
New to these metrics? Our Facebook Ads Metrics guide walks you through each one with formulas and examples.
Advanced Facebook Ads Analysis Techniques
Tracking metrics tells you what happened. These techniques explain why and what to do about it.
1) Attribution Analysis
Attribution is how Meta decides which ad gets credit for a conversion. The platform offers several windows: 1-day click, 7-day click, 1-day view, and 7-day view. Each will produce a different ROAS for the same campaign.
This matters more than most advertisers realise. A campaign reported on a 7-day click plus view-through attribution window will almost always look more profitable than the same campaign measured on a 1-day click window. Neither is wrong, but they are telling you different things about how your audience converts.
Before you report ROAS to a client or stakeholder, align on the attribution window you use and keep it consistent. Switching models mid-campaign is one of the most common ways performance data becomes misleading.
2) A/B Testing (Split Testing)
A/B testing on Facebook is the practice of running two versions of an ad with one variable changed, and letting the data decide which performs better. The keyword is one variable. Testing a new image and new copy simultaneously tells you nothing about which change made the difference.
What is worth testing in order of impact: creative format and visuals, headline and primary text, audience segment, placement, and campaign objective. Start with creativity. It typically exhibits the highest performance variance and the fastest feedback loop.
When reading results, do not call a winner too early. Wait for statistical significance, meaning enough impressions and conversions that the result is unlikely to be random. Meta's built-in split test tool flags this for you. If you are running tests manually, a general rule is to wait until each variant has at least 100 conversions before concluding.
3) Funnel Performance Analysis
Not every campaign should be measured by the same outcomes. A top-of-funnel awareness campaign should be judged on reach, CPM, and video views. A mid-funnel consideration campaign on CTR and landing page engagement. A bottom-funnel conversion campaign on cost per result and ROAS.
When you map each campaign to its funnel stage, you stop penalising awareness campaigns for not converting and stop crediting conversion campaigns for work the funnel did upstream.
To diagnose where the funnel leaks, follow the drop-off. If impressions are high but clicks are low, the creative or audience is the problem. If clicks are high but conversions are low, the issue is post-click. If conversions are happening but ROAS is weak, look at order value and offer structure.
4) Frequency and Ad Fatigue Analysis
Frequency data becomes actionable when you track it alongside CTR over time. When frequency rises, and CTR falls in the same period, your audience is fatigued by your creative. That is the signal to refresh, not to increase spending.
Audience overlap is an underrated contributor to fatigue. If multiple ad sets target similar audiences, they compete against each other in the auction, accelerating burnout for the same pool of people. Use Meta's Audience Overlap tool to identify and consolidate before fatigue sets in.
Native Tools for Facebook Ads Analytics
Meta gives you four built-in tools to track and manage your campaigns. Here is what each one does and when to use it.
- Meta Ads Manager is where your day-to-day analysis lives, structured across campaign, ad set, and ad levels. Customise your column view to surface the metrics that match your objective, use breakdowns by age, placement, device, and geography to diagnose underperformance, and keep an eye on the learning phase status before making any changes.
- Meta Business Suite sits above Ads Manager and gives you a unified view of paid and organic performance across Facebook and Instagram. Use it for strategic oversight and audience trend analysis. For granular campaign work, Ads Manager is the better tool.
- Events Manager is the backbone of your measurement setup, connecting the Meta Pixel and Conversions API (CAPI) to track what happens after someone clicks your ad. Monitor your event match quality score regularly. A low score means Meta is struggling to attribute conversions correctly, which quietly degrades campaign performance beyond just reporting accuracy.
- Facebook Ads Library is a public database of every active ad running across Meta's platforms. Use it for competitive research to understand what creatives are working in your market and where the gaps are.
Where Native Tools Fall Short
Meta's tools are a solid starting point, but they have real limitations worth understanding before you put too much trust in the numbers.
- Attribution is self-reported. Meta takes credit for conversions generously, often claiming the same sale that Google Analytics or your CRM attributes elsewhere. Without an external reference point, ROAS figures can look healthier than they actually are.
- Data lives in a silo. There is no view of how your Facebook campaigns interact with email, SEO, or paid search. You only see the Meta portion of the customer journey, never the full picture.
- Historical data retention is limited. Ads Manager does not store data indefinitely, making long-term trend analysis difficult without regular exports.
- Revenue correlation is manual. Connecting ad spend to actual revenue in your CRM or e-commerce platform requires either manual work or third-party tools. Native reporting tells you what happened inside Meta, not what those clicks were actually worth to your business.
This is exactly where third-party analytics tools earn their place, which we will cover next.
Third-Party Tools for Facebook Ads Analytics
Native tools show you what Meta wants you to see. Third-party tools show you what is actually happening.
The core problems they solve are attribution and data silos. When your Facebook data lives separately from your Google Ads, CRM, email platform, and website analytics, you are making decisions based on fragments. Third-party tools pull everything into one place, giving you a single, consistent view of performance across channels.
There are three broad categories worth understanding:
1) Reporting automation tools
They are built for marketers who need clean dashboards without involving an engineering team. They connect directly to your ad platforms and push data into Looker Studio, Google Sheets, or Power BI on a scheduled basis. Tools like Two Minute Reports is an affordable and feature-rich choice here. The tradeoff is less raw flexibility in exchange for faster setup and easier maintenance.

 Image source: Verified G2 review
Not sure which reporting tool fits your workflow? See how Two Minute Reports compares against other options in our reporting tools comparison guide.
2) ETL and data pipeline tools
They are built for teams that want raw data sent to a warehouse like BigQuery or Snowflake. They extract data from platforms like Meta, transform it into a usable format, and load it into your storage of choice for custom analysis. Tools like Fivetran, Airbyte, and Improvado sit in this category. They require some technical setup but give you the most flexibility for custom reporting and long-term data retention.
3) Multi-touch attribution tools
They are built specifically to solve the credit problem. They track the full customer journey across channels and assign conversion credit based on actual touchpoints rather than Meta's self-reported data. Tools like Triple Whale, Northbeam, and Rockerbox are popular in e-commerce for this reason. They give you a clearer picture of which channels are genuinely driving revenue versus which ones are claiming it.
When evaluating any third-party tool, focus on four things: 1) data freshness (how often it syncs), 2) channel breadth (how many platforms it connects), 3) attribution flexibility (whether you can switch models), and 4) ease of use relative to your team's technical capacity.
The right tool depends entirely on your setup. A lean marketing team running campaigns across two or three channels has different needs than a data team managing multi-market attribution across a full media mix. Start with the problem you are trying to solve, then find the tool that fits it, not the other way around.
How to Build a Facebook Ads Analytics Dashboard with Two Minute Reports
Checking Ads Manager daily is not a reporting strategy. A proper Facebook Ads analytics dashboard pulls your campaign data into one place, updates automatically, and gives you a clear view of performance without logging into Meta every time.
Here is how to build one using Two Minute Reports in four steps.
Step 1: Connect Your Facebook Ads Account


Install the Two Minute Reports add-on from the Google Workspace Marketplace and authenticate your Meta account with a one-click sign-in. If you are managing multiple ad accounts, whether for different clients or different business units, you can map each account separately and switch between them using a simple dropdown inside Google Sheets.
Step 2: Choose What to Track and Measure
Before pulling any data, make sure you're clear on the question your dashboard needs to answer. Structure your views around your objectives:
- Campaign view → Which campaigns are delivering the best return? (ROAS, cost per result, total spend)
- Audience view → Which segments are converting most efficiently? (CTR, CPC, conversion rate by audience)
- Creative view → Which ads are driving performance and which are fatiguing? (CTR, frequency, relevance diagnostics)
- Funnel view → Where are people dropping off? (impressions, link clicks, landing page conversions)
Organising your dashboard this way lets you spot problems at a glance rather than digging through campaign after campaign.
Step 3: Build and Customise Your Dashboard


Use Two Minute Reports' pre-built Facebook Ads dashboard templates as your starting point. From there, customise the layout to reflect the metrics that matter to your specific campaigns, whether that is a breakdown by placement, a spend pacing tracker, or a side-by-side creative comparison.
If you are reporting to clients, add your agency branding, adjust the layout for readability, and structure the narrative so performance is easy to communicate without requiring clients to interpret raw numbers.
Step 4: Set Your Reporting Schedule
Automate delivery based on the decision each report supports:
- Daily → Spend pacing and early performance flags
- Weekly → Creative fatigue, audience shifts, optimisation calls
- Monthly → Strategic review and budget reallocation
A dashboard you set up once and trust completely is worth far more than a manual report you rebuild every week.
Top Facebook Ads Analytics Templates as a Fast-Start Option
Here are the top three marketers’ favourite free pre-built templates to make your reporting easier and faster
1) Facebook Ads Analysis Report

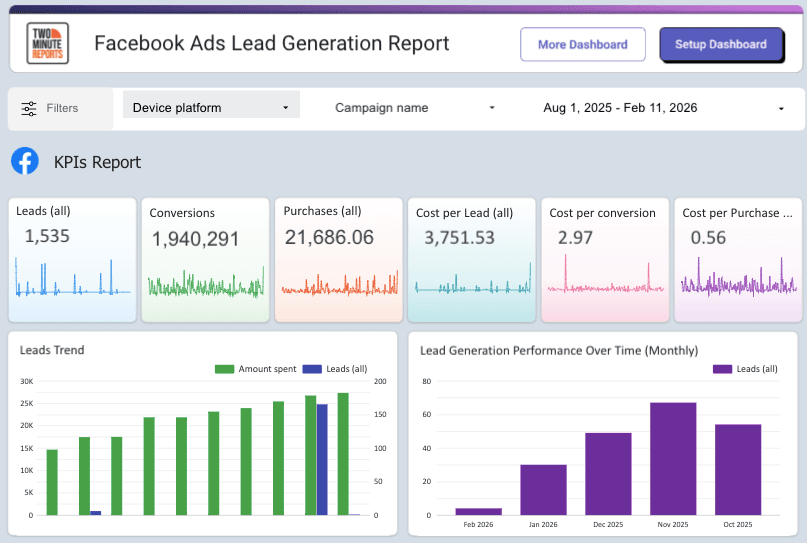
2) Facebook Ads Lead Generation Report
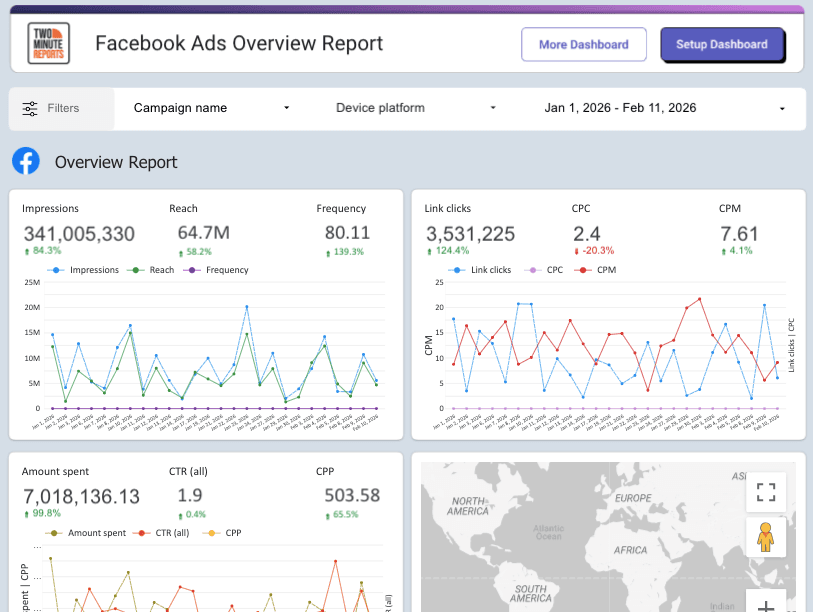
3) Facebook Ads Overview Report
Facebook Ads Analytics Best Practices
Getting the most out of your Facebook Ads data is less about the tools you use and more about the habits you build around them. These five practices make the difference between reactive reporting and actual optimisation.
1. Set Up Conversion Tracking Before You Launch
This sounds obvious, but it is one of the most skipped steps. Without proper tracking in place from day one, your early campaign data is incomplete, and you cannot get it back. Verify your Pixel, test your events, and confirm conversions are firing correctly before a single dollar is spent.
2. Define KPIs Based on Your Campaign Objective
A brand awareness campaign should never be judged by ROAS. A conversion campaign should not be celebrated for reach. Match your success metrics to your objective before the campaign goes live, and make sure everyone reviewing the data is aligned on what good looks like for that specific goal.
3. Check Data at the Right Cadence
Not all metrics need daily attention. A simple rhythm to follow: check spend pacing and delivery daily, review creative performance and audience efficiency weekly, and assess overall strategy and budget allocation monthly. Checking everything every day leads to over-optimisation and reactive decisions based on short-term noise.
4. Respect the Learning Phase
When an ad set enters the learning phase, Meta is still figuring out who to show your ad to. Making significant changes during this period resets the process and delays reliable data. Unless something is critically wrong, let it run.
5. Tie Performance Back to Business Outcomes
Platform metrics are a means to an end. A strong CTR means nothing if it is not generating revenue. Always connect your ad performance to what actually matters to the business, whether that is pipeline, revenue, or customer acquisition cost, not just what looks good inside Ads Manager.
Conclusion
Facebook Ads analytics is not a one-time audit. It is an ongoing practice built on a clear framework: track the metrics that actually matter, use native tools to monitor day-to-day performance, apply advanced analysis to understand the why behind the numbers, automate your reporting so you are not rebuilding it every week, and act on what the data is telling you.
Advertisers who do this consistently do not just have better dashboards. They make better decisions, optimize budgets, and scale with more confidence.
Frequently Asked Questions
Reach is the number of unique people who saw your ad. Impressions is the total number of times your ad was displayed, including multiple views by the same person. If your impressions are significantly higher than your reach, a small audience is seeing your ad repeatedly, which can be an early sign of ad fatigue.
There is no universal answer. A good ROAS depends entirely on your profit margins. Start by calculating your break-even ROAS based on your costs, and use that as your floor. For most e-commerce businesses, a ROAS of 3 or above is a common target, but what is profitable for one business can be a loss for another.
Meta's attribution is self-reported, meaning it takes credit for conversions based on its own attribution windows. A user might click your Facebook ad and later convert through a Google search, and both platforms will claim that conversion. Using a third-party attribution tool gives you a more accurate picture of which channels are genuinely driving revenue.
Match your check-in cadence to the decision it supports. Review spend pacing and delivery daily, assess creative performance and audience efficiency weekly, and evaluate overall strategy and budget allocation monthly. Checking everything every day often leads to over-optimisation based on short-term noise.
When you need to understand performance across multiple channels, connect ad spend to actual CRM or revenue data, or retain historical data beyond what Ads Manager stores, native tools will not be enough. That is the point where third-party reporting or attribution tools become worth the investment.
Related Blogs


Meet the Author
Shabika VenkidachalamShabika, at her core, is a storyteller who believes even data-heavy topics can be infused with heart. At Two Minute Reports, she blends creative writing with user intent to create clear, purposeful content that is deeply human. Away from her desk, she finds inspiration in nature, where creativity flourishes without distractions.
