
Summarize this blog post with:
Here’s the uncomfortable truth about Shopify analytics: having the data isn’t the hardest part. Understanding what it’s telling you and acting on it is where most store owners get stuck.
Shopify’s built-in dashboard works well if you’re getting started. But as your store grows, or as you onboard more clients for your agency, the complexity multiplies fast. Jumping between dashboards, reconciling numbers and trying to build a unified picture of performance becomes extremely time-consuming.
Sounds familiar? This guide is for you. Inside, you’ll get:
- A no-fluff breakdown of what you can track in Shopify analytics
- How store owners should interpret Shopify metrics
- Native vs third-party Shopify analytics tools – what’s worth paying for
- A step-by-step walkthrough of building a unified Shopify analytics dashboard across multiple stores
- Free Shopify analytics dashboard templates so you don’t start from scratch
- Shopify Analytics Insights framework checklist to audit any store in minutes.
What is Shopify Analytics?
Shopify Analytics is the built-in reporting system within the Shopify platform that collects, processes, and visualizes data from a merchant’s online store, including sales, orders, customers, products, inventory, and marketing. It lets store owners answer questions like:
- How much revenue did I make today/this month?
- Where are my customers coming from?
- Which products are selling best?
- What’s my store’s conversion rate?
- How is my market performing?
It also provides several built-in Shopify reports that highlight different aspects of your store's performance. Each report answers a specific business question to guide you with actionable next steps. Here’s how:
The real value of Shopify analytics comes from understanding how to interpret the metrics, what they reveal about your store’s growth, and revenue trends. In the next section, we’ll explore how you can track Shopify metrics strategically to identify performance gaps and make better business decisions.
How Store Owners Should Interpret Shopify Metrics?
Instead of asking, “What is my conversion rate?”, the better question is: “What changed, where did it break, and what should I do about it?”
To answer that question consistently, metrics need to be read in sequence – each step narrowing the diagnosis before moving to the next.
Step 1: Start with Revenue, Then Trace Backwards
Revenue is the only metric that directly reflects business impact. Every analysis should start here and not with traffic or ad spend.
Break revenue into its two core drivers:
- Orders – how many transactions occurred?
- Average Order Value – how much each transaction was worth?
If revenue changes, one of these has changed. That’s where the investigation begins.
This analysis prevents jumping straight into ad spend or traffic analysis before understanding whether the issue is demand, pricing, or product, all of which require completely different fixes.
Step 2: Diagnose Conversion Before Blaming Traffic
Once revenue drops are traced to orders, most store owners immediately assume the problem is traffic. It usually isn’t. Conversion inefficiencies are more common and fixable than traffic shortfalls. But you can only find them if you break the conversion funnel into stages rather than reading a single overall rate.
The three stages to track:
- Product page → Add to cart → Are visitors engaging with what they find?
- Add to cart → Checkout initiated → Is intent translating into action?
- Checkout initiated → Purchase → Is the process completing without friction?
Each stage points to a different problem:
- Drop at product page: Weak product positioning, unclear value, poor imagery or copy.
- Drop at add-to-cart: Price sensitivity, lack of urgency, missing social proof.
- Drop at checkout: Shipping costs, trust signals, UX friction, payment options.
A single conversion rate tells you that something is broken. A funnel breakdown tells you where.
Fix the stage before investing in more traffic. Sending more visitors into a leaking funnel scales only loss.
Step 3: Evaluate Traffic Quality, Not Just Volume
Once conversion issues are ruled out, traffic becomes the next diagnostic layer. But traffic analysis is useful if you’re measuring the right thing.
Instead of: “Which channel brings most users?” Ask: “Which channel generates the most revenue per visitor?”
The following metrics reveal traffic quality:
- Revenue per session: The clearest signal of channel value.
- Conversion rate by channel: Isolates where intent is highest.
- AOV by channel: Shows whether a channel attracts high-value buyers.
This matters especially when evaluating paid vs organic vs social traffic. High-volume channels can consistently underperform high-quality channels on revenue efficiency, and that gap only widens as ad spend scales.
Step 4: Separate Growth From Efficiency
Growing revenue can feel like a clear win. But growth alone doesn’t tell you whether your store is becoming more or less efficient over time. A pattern worth watching closely:
- Orders ↑
- Revenue ↑
- But AOV ↓
This means volume is increasing while value per customer is declining. The store is working harder – processing more orders, potentially spending more on acquisition, but extracting less from each transaction.
What to track together:
- AOV alongside revenue (not just revenue in isolation)
- Whether revenue growth is volume-driven or value-driven.
- Customer acquisition cost relative to AOV – if CAC rises while AOV falls, the unit economics are deteriorating.
Step 5. Watch Leading Signals, Not Just Lagging Ones
Instead of tracking lagging indicators, which confirm what has already happened, layer in leading indicators that signal shifts before they show up in revenue.
If you wait for revenue to drop to start investigating, you’re already late. Review leading signals weekly. They give you the reaction time that lagging metrics don’t.
Why Use a Dedicated Shopify Reporting Tool Instead of Native Analytics?
Shopify’s native analytics is built for store-level analysis. It works well within a single store, but breaks down when you need to interpret performance across multiple stores.
It’s worth noting that Shopify Plus subscribers get access to multi-store analytics, but even then, the limitations are hard to ignore. Users across Reddit have flagged issues like multi-store reporting locked behind higher paywalls, inconsistent lifetime value calculations, etc.


That’s where a dedicated Shopify reporting tool makes the difference. Here’s how Two Minute Reports compares:
Whether you’re a non-plus user trying to centralize your ecommerce reporting or an agency managing high-volume Shopify clients, Two Minute Reports lets you scale by giving cross-store visibility, flexible reporting, and faster data retrieval without the manual exports or the expensive paywalls standing between you and your data.
How to create a Shopify Analytics Dashboard Using Two Minute Reports?
In this section, let me walk you through the simple 4-step process to build and automate your Shopify analytics dashboard using Two Minute Reports.
Step 1: Connect Your Shopify Store Account
- Install the Two Minute Reports add-on from the Google Workspace Marketplace.
- Authenticate your store credentials via one-click sign-in.
- Once done, map multiple stores to your respective clients directly inside Google Sheets. Easily switch between store accounts using a simple dropdown.


Step 2: Choose Metrics To Measure Your Store Performance
Before pulling data, identify what aspects of your store you’re trying to monitor; then select the key Shopify metrics that directly answer that question. Here’s how:
- Sales view → Are we growing revenue efficiently? (Total sales, net sales, AOV, discounts).
- Product view → Which products are driving revenue? (top-selling products, product categories, and low-performing SKUs).
- Customer view → Are customers coming back? (new vs returning customers, repeat purchases)
- Order view → Are we fulfilling demand effectively? (total orders, returns, and ordered quantity)
Structuring your dashboard this way helps you quickly understand which part of your store needs attention without digging through multiple reports.
Step 3: Customize Your Shopify Store Dashboard
- With Two Minute Reports’ Shopify reporting templates, you can build auto-updating store analytics dashboards that reflect in-depth performance insights.
- Customize your Shopify analytics dashboard to visualize: store-level breakdown of sales, orders and product categories, customer purchasing behavior, traffic sources, etc.
- Analyze what’s working, what’s not and identify key trends to map your store ROI behavior.
- Present fully branded, professional reports by including your agency’s logo, interactive layouts, etc., to showcase your analytical expertise and credibility.
Pro Tip: Once you have created your Shopify dashboard, you can reuse it across multiple clients. This improves consistency, standardization and eliminates the need for building dashboards from scratch.
Step 4: Automate Your Dashboard
Schedule your Shopify analytics dashboard to be sent at custom intervals – daily, weekly, monthly, etc. Set cadence based on the following:
- Daily → Are we hitting revenue targets today?
- Weekly → Where are we losing conversions?
- Monthly → Is growth sustainable and profitable?
Top Shopify Analytics Dashboard Templates To Streamline Store Performance
In this section, let me highlight the ready-to-share templates to centralize and automate your store performance analysis.
1. Shopify Overview Dashboard
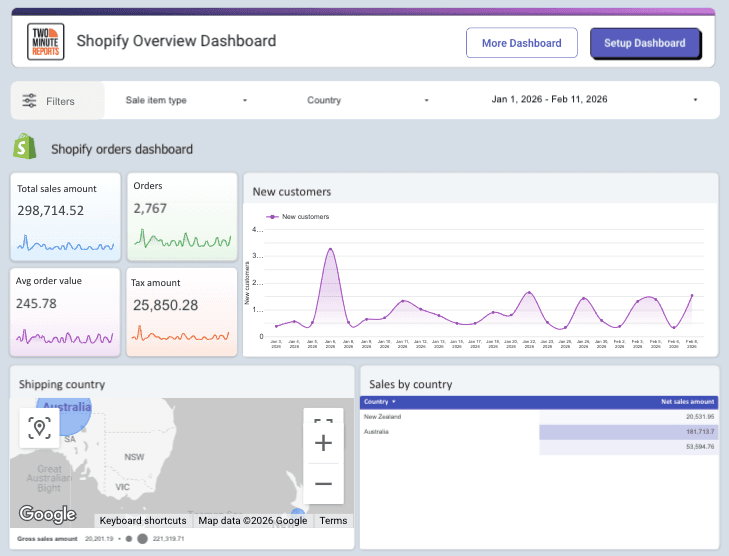
Get a clear overview of your Shopify store's performance with key KPIs like sales, orders, customer count, and average order value in one place. Track how sales are distributed across cities and countries, identify high-performing regions, analyze weekly trends, product-level performance and order details – so you can spot what’s driving revenue and where performance is dropping.
2. Shopify Ecommerce Report

Analyze your store sales performance by tracking total sales, total number of orders, net sales, discount amount, etc., and product performance from a single Looker Studio dashboard. Visualize order trends, inventory quantity, and top products sold to optimize your store’s marketing and sales strategy.
3. Shopify Overview Report

Gain clarity on how your store is performing with scorecards that track gross sales, orders, and customer trends (new vs returning customers), along with comparisons across time periods to quickly spot growth opportunities. Understand what’s driving revenue with top product insights and sales overviews, while country-level data helps you identify high-performing regions to expand ROI.
Pro tip: With Two Minute Reports’ exclusive Speedboost technology, your Shopify dashboards load faster with updated insights. Whether you handle 10 or 100+ stores, your reports will always be ready for action via smart caching. Works with Google Sheets and Looker Studio.
Shopify Analytics Insights Framework: A Quick Audit
Use this quick audit to pinpoint exactly what’s moving your revenue and why.
- Start with revenue → Are we up or down? → If revenue has changed, break it into orders vs AOV to identify whether the issue is volume or value.
- Track the orders → Are fewer people buying? → If orders are down, dig into which channel dropped – paid, organic, email or direct, because the fix is completely different depending on the source.
- Check product performance → What’s driving or losing sales? → Look at your top SKUs; if key products are declining, overall revenue will follow. Flag anything that’s slipped out of your top 10 since last period.
- Validate customer feedback → Is acquisition outpacing retention? → If new customers are high but repeat purchases are low, your growth isn’t stable; you’re filling a leaky bucket.
- Identify leakage → Where are we losing revenue? Rising return rates, cancelled orders, or heavy discount dependency can quietly erode real revenue even when gross sales look healthy.
Wrapping Up
Shopify analytics is indispensable for tracking, analyzing, and optimizing your store’s revenue. But pulling individual metrics in isolation only tells half the story. The real competitive advantage comes from visualizing them together, because every number is connected to another.
A dip in revenue traces back to orders. Orders trace back to traffic channels. Traffic traces back to your best-performing products and the customers who keep coming back. When you see all of this in one place, patterns become obvious, and decisions become faster.
That’s exactly what Two Minute Reports is built for. Instead of jumping between Shopify reports and manually exporting data, you get a single, auto-updating ecommerce dashboard that centralizes multi-store performance analysis to move forward with precision.
If you’re serious about growing your Shopify store, the data is already there. Two Minute Reports ensures you’re never too far from it.
Frequently Asked Questions
Shopify Analytics is the built-in reporting system on the Shopify platform that collects and visualizes data from your online store, including sales, orders, customers, and marketing. It helps store owners answer key questions about revenue, customer sources, and product performance.
To effectively interpret your Shopify metrics, start by focusing on your revenue and then break it down into orders and average order value. Instead of just checking your overall conversion rate, look closely at each step of the conversion funnel to pinpoint where things might be going wrong.
Native analytics is designed for single-store analysis and can be limiting when managing multiple stores. A dedicated ecommerce reporting software, such as Two Minute Reports offers unified dashboards, better customization, automated reporting, and scalability for agencies or users with multiple stores.
To create a dashboard, first connect your Shopify store account with Google Sheets or Looker Studio using Two Minute Reports. Then, choose the metrics you want to measure, customize your dashboard, and automate it to deliver updated store performance insights to your clients at your preferred intervals.
Related Blogs


Meet the Author
Shalini MuruganShalini is driven by ideas that create a tangible impact. At Two Minute Reports, she specializes in content that helps marketers optimize their reporting workflows. When she's not transforming complex data into meaningful insights, you might find her lost in a book, jotting down ideas in her notebook, or connecting the dots others overlook.
