
Summarize this blog post with:
Facebook Ads Manager allows you to track over 300 metrics, but which ones actually indicate whether your campaigns are effective?
For agencies and performance marketers managing multiple clients, this question comes up constantly. With several ad accounts, campaigns, and creatives running at the same time, reporting often turns into a manual, time-consuming process. As a result, many reports fail to explain what changed, why it changed or what action should follow.
This is where a high-performing Facebook Ads report sets a different standard. It prioritizes clarity over volume and decisions over raw metrics, so every report answers one critical question: “What should we do next?”
In this article, you’ll learn the 5-simple steps to structure your Facebook Ads client reports, which metrics to report, and how to automate campaign insights in real-time so that everything is streamlined for faster, data-driven insights.
Let’s get started.
What is a Facebook Ads report?
A Facebook Ads report is a structured summary of a campaign's performance that translates ad data into clear, actionable decisions. Instead of listing metrics, it explains performance changes across campaigns, ad sets and ads, so you can act confidently without manually re-analyzing your data every time.
In practice, an effective Facebook Ads report does four things:
- Reduce decision latency
- Explains changes, not just results
- Connects ad metrics to revenue, not vanity KPIs
- Enables executives, managers, and media buyers to act with precision.
Ultimately, a Facebook Ads report should justify marketing spend and validate strategy by clearly showing how investment translates into measurable business outcomes.

Track top-performing campaigns and key KPIs such as amount spent, CPM, Frequency, CPC, etc in a single Facebook Ads dashboard. Get clarity on what’s working and optimize performance for higher ROI.
What makes a winning Facebook Ads client report?
A winning Facebook Ads client report should answer the questions your clients actually care about. More precisely, it should:
- Be relevant: Tailor your report to align with your client’s campaign goals. Explain the progress towards the goals and whether everything is working as planned.
- Show what has changed: Compare results to the previous period so clients can see improvements, decline or stability at a glance.
- Explain performance shifts: Tie changes to real causes such as creatives, audiences, budget change or seasonality, not vague observations.
- Be transparent: Specify the best and least performing campaigns with a short description of what you’ll do to improve or change.
- End with clear next steps: List exactly what you’ll scale, pause or test next so your client knows what to expect and act upon clearly.
Important metrics to include in your Facebook Ads report
Not every metric in Facebook Ads Manager belongs in your client report. The goal is to include only the numbers that explain performance, justify spend, and guide the next decision. Here are some of the core Facebook Ads metrics categorized by their business function:
Pro tips:
- Don’t include every metric all the time; highlight the ones that changed or influenced campaign performance.
- Group metrics with objective (lead gen, awareness, sales) to keep reports focused.
- Pair metrics with a short explanation and clear next steps.
How to create a Facebook Ads report that your clients trust?
Creating a data-driven Facebook Ads report requires a clear structure and intent, ensuring the insights are actionable and easy for clients to act on. Here are the best practices to create such impactful Facebook Ads reports.
1. Understand your clients' goals and KPIs upfront
Clear reporting starts with clarity on what matters. Defining the right goals and KPIs upfront ensures your Facebook Ads report focuses on outcomes, not just activity. After all, what you track directly shapes what you optimize.
Ask the following questions to align your Facebook Ads reporting with your client’s goals:
- What is your primary campaign objective? (eg, driving traffic, generating leads, or sales)
- What defines success for this campaign? (eg, CPL, ROAS, or any other business metric)
- Over what time period should the results be evaluated? (eg: immediate, 30-day performance, long-term)
- Which stage of the funnel is currently your biggest bottleneck?
- Are there any secondary goals to consider? (eg: retargeting, email list building)
- What is your expected reporting frequency? (daily, weekly or monthly)
This approach ensures your Facebook Ads report stays focused, concise, and aligned with how your clients define success.
2. Map supporting metrics to your client’s primary campaign goal
Once the primary goal is clear, the next step is deciding which metrics support that goal and which ones don’t. Supporting metrics should explain why the performance is moving, and not distract from the main outcome.
Start with one core KPI directly connected to your client’s campaign objective, then layer in a small set of supporting metrics that help diagnose performance. For example, if the goal is lead generation, CPL is the headline metric, while CTR and CVR provide context and not conclusions.
This approach keeps your reports focused, ensuring every Facebook Ads metric included helps guide an optimization decision rather than just filling space.
Facebook Ads: Mapping Goals to the Right Metrics
3. Connect Your Facebook Ads Accounts
Once you’ve defined goals and mapped key KPIs, the next step is to track and report them with accuracy. While the Facebook Ads Account Centre has connected experiences, it is not the best option for agencies managing several Facebook Advertising campaigns across multiple clients.
This is because you must log into each client’s Facebook Ads account, manually track performance insights and then put together as a report. As a result, you’ll start drowning in spreadsheets and fail to justify your campaign ROI.
So what you need is a reliable Facebook Ads reporting tool such as Two Minute Reports. It helps you connect, visualize, and automate campaign reporting across multiple clients in a single Google Sheets or Looker Studio dashboard. Here’s how you can connect:
- Install the Two Minute Reports add-on from the Google Workspace Marketplace and launch it in your spreadsheet.
- Choose “Connections” from the dropdown menu and click “+Add”.
- Select the Facebook Ads connector from the list of options and authorize your Connection.
- Enable the list of necessary Facebook Ad accounts (as shown below) for which you want to measure campaign performance.

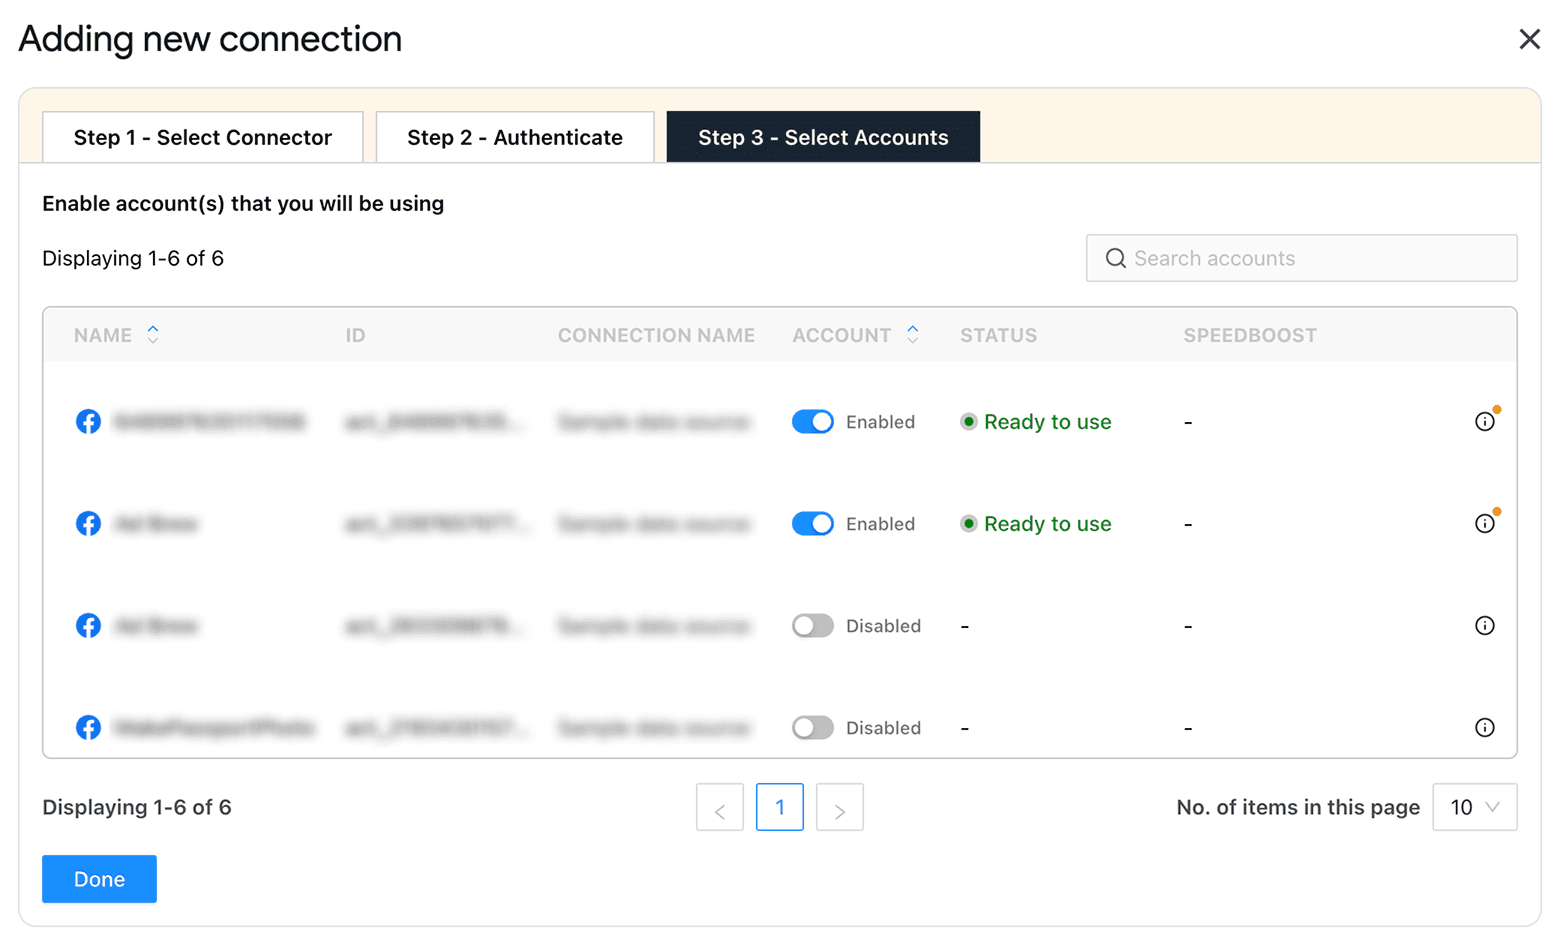
And that’s it. You’ve connected your Facebook Ads accounts to Two Minute Reports – no complex configuration or coding required.
4. Start With a Facebook Ads Reporting Template
Once you’ve connected your Facebook Ads accounts, you can select a pre-built Facebook Ads template and build data-driven reports within minutes.

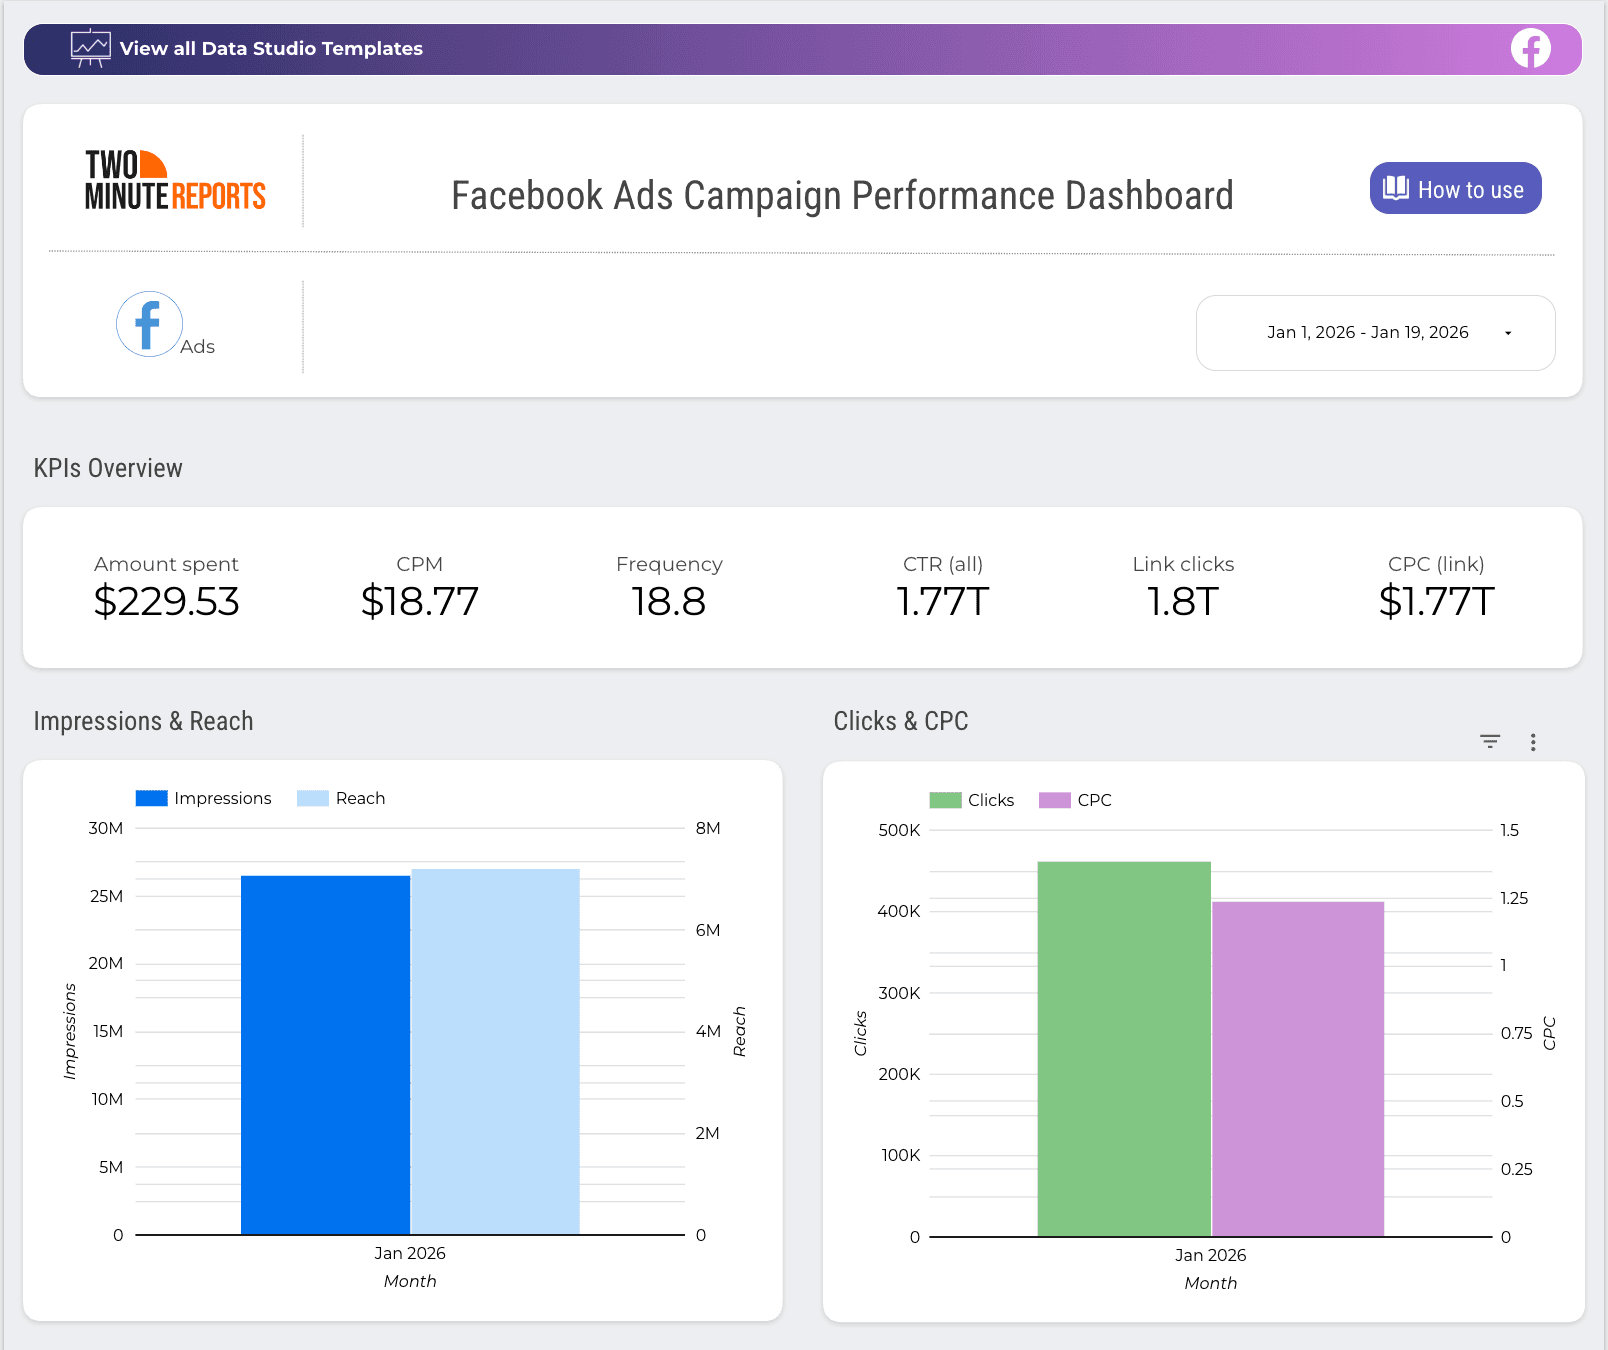
Using the above Facebook Ads reporting template, you can track the following:
- High-level performance overview: Highlight key metrics such as Amount Spent, CPM, Frequency, CTR, etc as scorecards to quickly assess campaign performance.
- Trend analysis with line charts: Visualize Impressions, Reach, Clicks, CPC over time and spot performance shifts and patterns.
- Campaign-level comparison: A comparison table showing Amount Spent, Impressions, Clicks, CPC, and CTR across campaigns for easy benchmarking.
- Date-range control: A date filter at the top lets you adjust the reporting period and analyze performance for any timeframe.
The best part? Add your own logos, layouts, and deliver fully branded Facebook Ads client reports. Take full advantage without needing a premium upgrade or additional tools.
Note: Tips to speed up Facebook Ads reporting with Two Minute Reports:
- Reuse reports across multiple clients: Apply the same Facebook Ads report to multiple clients, eliminating the need to build from scratch.
- Load Facebook Ads dashboards 5X faster: With our exclusive Speedboost technology, reports load faster – even for complex, high-volume ad accounts. No need to waste time on slow native API pulls.
- Scale reporting effortlessly: Handle large datasets in Google Sheets and Looker Studio, so your reporting stays agile and flexible as you onboard new clients.
5. Automate your Facebook Ads report
Setting up the right reporting frequency depends on your client’s preferences. Whether it is daily, weekly or monthly, ensure you track the right metrics and implement proactive steps to optimize your campaign performance.
Here’s how you can automate your Facebook Ads reporting with Two Minute Reports:
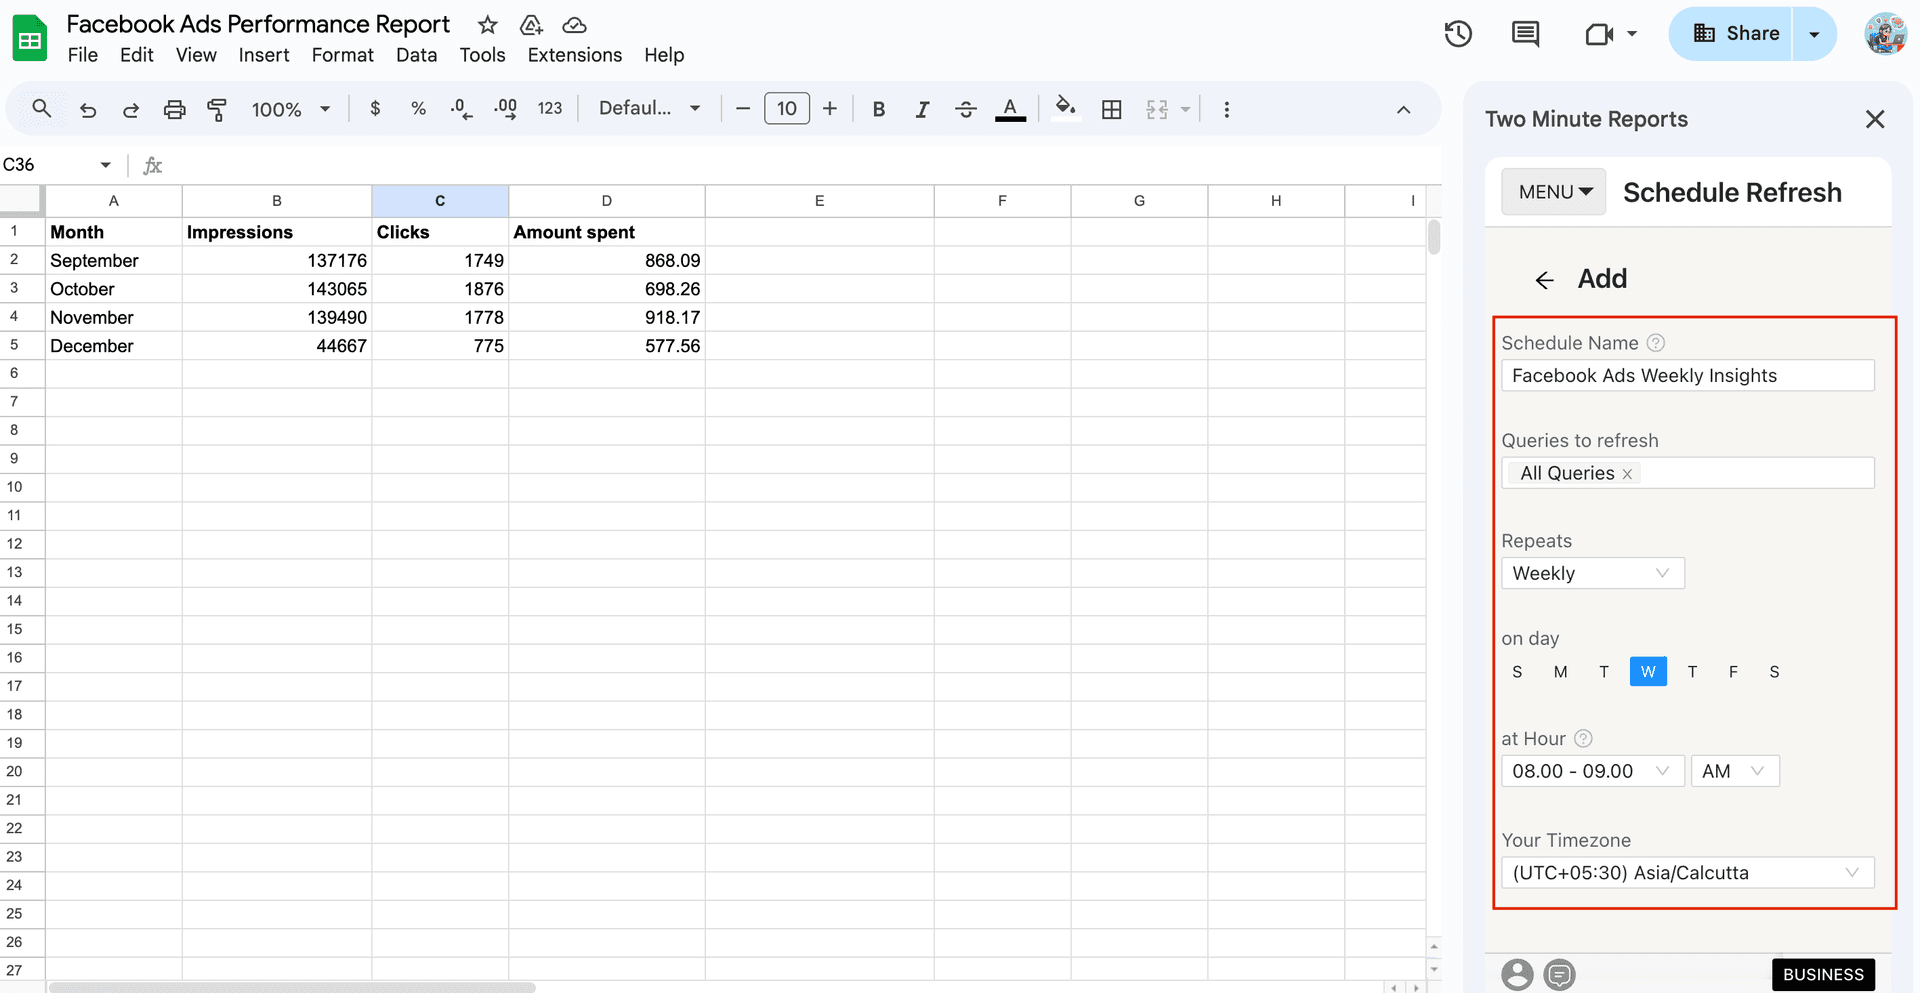
- Navigate to the dropdown menu and choose “Schedule Refresh”.
- Specify your schedule name, select the queries and select the frequency (hourly, daily, weekly or monthly).
- Next, select your preferred timezone based on your client’s primary location.

Finally, you can choose the report format (PDF, Excel, etc) and send emails across multiple clients within your Google Sheets dashboard.

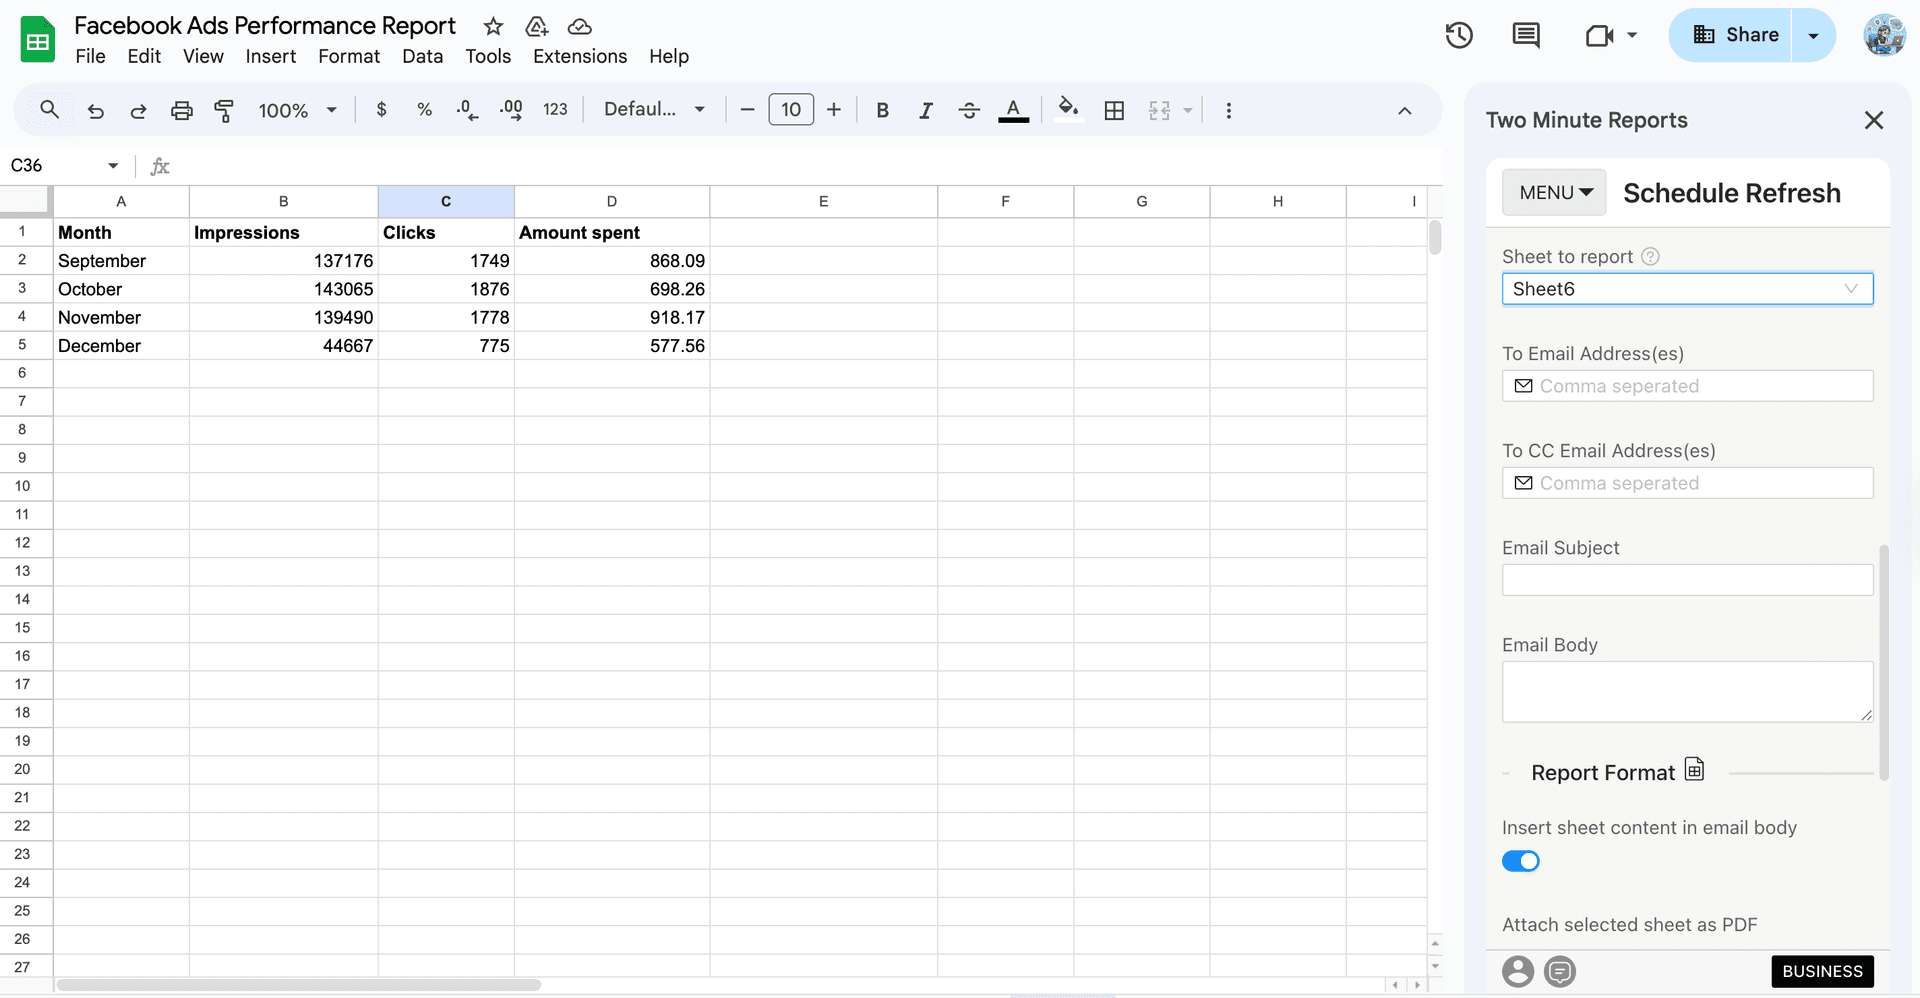
Once you’ve configured the above steps, your Facebook Ads report will be automatically delivered to your clients on the respective schedule.
Now that you’ve got an idea of building your Facebook Ads report, next, let me show you how to effectively present it to your clients.
How to present Facebook Ads reports to your clients?
Presenting a Facebook Ads report is about guiding your clients on justifying ad spend, what it delivered and what happens next. Here’s a simple 3-step process to make your Facebook Ads reports valuable and actionable.
1. Lead with the win
- Start with the ROI or the closest business outcome – revenue, qualified leads or cost efficiency.
- State clearly whether the performance improved, declined or stayed flat to give clarity.
- Address the underperforming campaigns with transparency to build trust.
Agency tip: Begin with context before visuals. Once clients see fluctuating metrics without context, you lose control of the narrative.
2. Use this month’s data to set the next strategy
- Explain what the data tells you about what to scale, pause or change.
- Correlate each recommendation to a clear trend or learning from the report.
- Set clear expectations on what success should look like in the next period.
Agency tip: Frame recommendations as decisions already made, not ideas up for debate. Clients trust agencies that act decisively based on data.
3. Translate ad metrics into business outcomes
- Convert platform metrics into outcomes your clients understand (eg: high frequency → audience fatigue risk)
- Explain how changes in performance affect revenue, lead quality, or acquisition cost.
- Keep technical details secondary unless they directly explain a business result.
When your Facebook Ads reports are presented this way, conversations shift from metric-by-metric reviews to aligned decision-making, reinforcing both performance outcomes and client relationships.
Streamline your Facebook Ads reporting to maximize ROI
Effective Facebook Ads reporting isn’t about showing more data; it’s about making better decisions. A strong report explains what changed, why it changed, and what happens next, so clients don’t need extra calls or follow-up questions to understand performance.
Before sending any Facebook Ads report, make sure it answers these four questions:
- Can my client understand the performance in 60 seconds?
- Does the report clearly show what changed since the last period?
- Are the metrics tied to business outcomes?
- Are the next steps clearly documented and easy to follow?
If the answer is yes to all these questions, your report is doing a great job.
However, as your reporting needs expand and client accounts scale, maintaining this clarity becomes difficult. This is where Two Minute Reports naturally fits into your workflow – create unlimited campaign reports, keep them consistent across clients, and optimize performance in real-time to improve ROI.
Try Two Minute Reports free for 14 days and see how faster Facebook Ads reporting can be.
Frequently Asked Questions
A Facebook Ads report provides a clear overview of how a campaign is performing. It summarizes ad data into actionable insights, helping you understand what changes occurred across campaigns and ads. This way, you can make informed decisions without having to dig through your spreadsheets.
A winning Facebook Ads client report should be relevant to the client's goals, show what has changed compared to the previous period, explain performance shifts, be transparent about campaign performance, and end with clear next steps for action.
You can automate your Facebook Ads reports by using an automated reporting tool such as Two Minute Reports. Simply set a schedule for how often you want the reports to update (daily, weekly, or monthly), and your reports will be automatically delivered to your clients.
The important Facebook Ads metrics to include are ROAS, CPA, and Revenue to assess bottom-line impact; Link CTR and Hook Rate to evaluate creative effectiveness; CVR and CPC to measure funnel efficiency; Frequency and Reach to monitor audience saturation and fatigue; post shares and comments to measure audience engagement.
Related Blogs


Meet the Author
Shalini MuruganShalini is driven by ideas that create a tangible impact. At Two Minute Reports, she specializes in content that helps marketers optimize their reporting workflows. When she's not transforming complex data into meaningful insights, you might find her lost in a book, jotting down ideas in her notebook, or connecting the dots others overlook.
