Summarize this blog post with:
A giant marketplace brimming with users and a strong advertising platform that enables multiple ad formats—this is the blockbuster proposition that Amazon Ads promises.
Like Amazon with consumers, Amazon Ads has become a staple for most consumer-facing brands. This advertising platform has proven effective because it brings value through detailed customer data and buying patterns.
Aside from its robust features, Amazon Ads is still an advertising platform; each part is data-driven and offers robust analytics. In this article, we will take you through various steps to bring all your Amazon Ad data to Google Sheets in under two minutes.
This two-minute process could potentially save you hours of manual work.
How to extract Amazon Ads data to Google Sheets?
Two Minute Reports is a Google Sheets add-on that helps you create Amazon Ads reports quickly. Follow this step-by-step tutorial to get started with this tool.
The first step (obviously) is to install the add-on to Google Sheets. Here's a step-by-step installation tutorial: How to install Two Minute Reports
Once installed, you can follow two methods to create your Amazon Ads reports:
- Method 1: Connecting Amazon Ads to Google Sheets using the sidebar
- Method 2: Connecting Amazon Ads to Google Sheets using in-built templates
Method 1: Create an Amazon Ads Report using the sidebar
Step 1: Adding the Data Source


- Open Google Sheets and launch Two Minute Reports from the extensions menu. The Two Minute Reports sidebar would open with all its available tools.


- Click on the "Menu" button to open the dropdown menu, and click on Data Sources to access the section.


- Click on the blue "Add" button to start configuring a new data source for extraction.


- First, name the data source appropriately to locate it for future use. Use the dropdown menu below to find all available data sources. From here, locate Amazon Ads— you can simply type in the text box in the Menu to search for it.

- You must log in to your Amazon Ads account to authorize Two Minute Reports to draw data from it.


- Once authorized, click "Save" from the pop-up window to save your new data source. TMR is now ready to export data from Amazon Ads.
Step 2: Creating a Query
- To proceed with Amazon Ads data, you must first create a query. Click the Menu button to the left and go to the Data Queries section.


- In this section, you'll find all data queries you create with Two Minute Reports. To create a new query, click on "Add +".

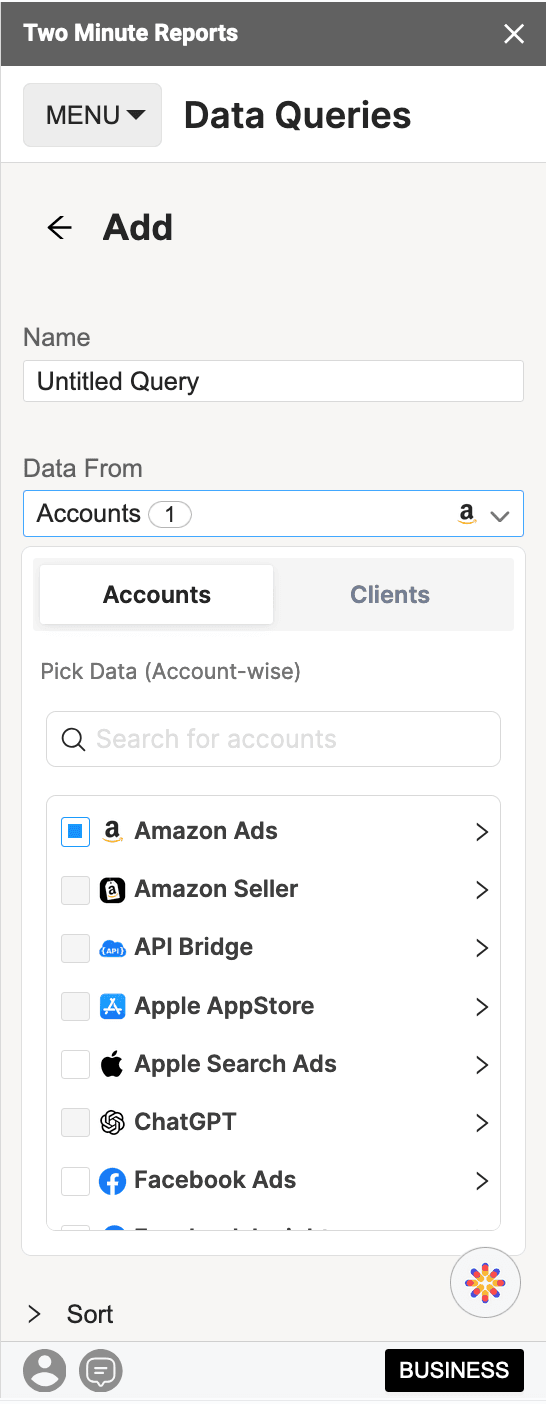
- Name the data query appropriately, and choose the accounts from which you need to extract data.
Note: For agencies, you can create data queries that combine multiple accounts and data sources with the Client option. This feature lets you combine a client's accounts to create a unified dashboard with multi-channel data. Read here for a detailed guide on creating a query using the Clients feature.


- Next, choose the metrics you'd like to see in your report. You can search for these metrics in the search bar at the top or use the dropdown menu to find the relevant metrics.
Note: Make sure to explore the various categories and metrics that are available. Each metric could add value to your report.

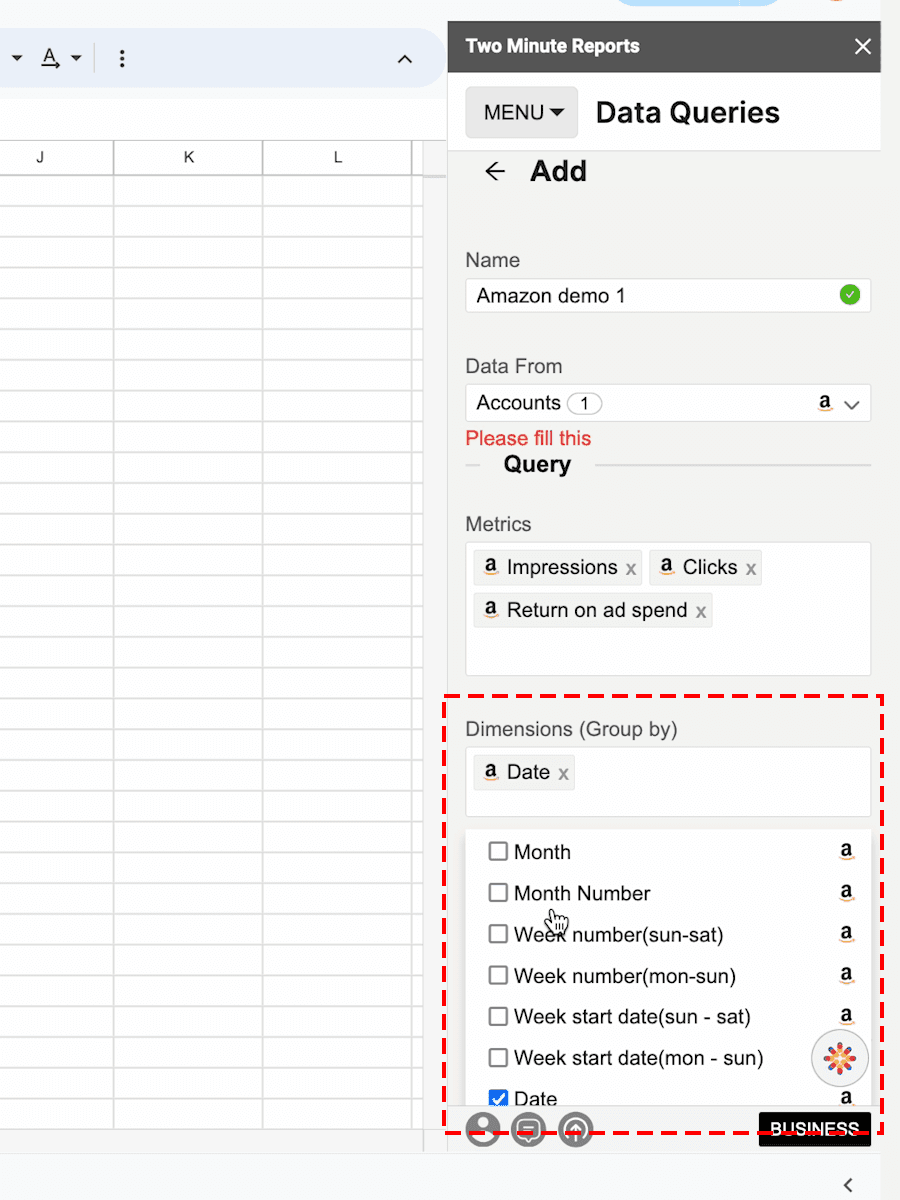
- Finally, set the dimensions of the report. As in the Metrics section, you can search for the dimensions using the search bar or explore the various categories in the "Dimensions" dropdown menu.


- After selecting your combination of metrics and dimensions, you can set the date range for the report. In Two Minute Reports, you can choose a predefined date range or create a custom range.


- You can also organize and filter your data from within the sidebar.
- To organize, click on the "Sort" dropdown section, select the relevant data fields, and choose whether to sort the data in ascending or descending order.
- You can do the same in the "Filter" dropdown section to add custom filters or currency conversions to your data.
- Once you've defined your query, you can run it to visualize the final output. This query fetches the data from the data source onto the sheet and cell of your choice.
Pro TMR Tip: Run all your queries directly from the Extensions menu on your Google Sheets. Go to Extensions > Two Minute Reports > choose your desired quick action.
Method 2: Create an Amazon Ads Report with templates
Two Minute Reports offers a wide range of templates that enable you to build reports with easy-to-interpret (and gorgeous) visualization. Each template has a specific combination of metrics and visualization that serves a particular purpose, be it an overall view of your advertisements or a specific user action.
To use Two Minute Reports templates, create a data source and authorize it from Step 1 in the previous method.
Once you add the data source(s), click Extensions > Two Minute Reports > Templates. You can also choose it from the Menu in the Two Minute Reports Sidebar.
- Once the Template Gallery opens, you can filter by Category, Data Source, or even search for specific templates.
Note: Two Minute Reports offers a vast range of templates. Explore all the templates to find one that fits your purpose.


- Once you find the suitable template, click on "Use."


- Then, choose the preferred data source and the relevant Account Views.


- Name your spreadsheet and click "Submit" to create the report. TMR will create your report in a new Google Spreadsheet.


- Click on "go to spreadsheet" to access the new report. Once the new report opens up, launch the "Two Minute Reports" sidebar.


- Open the Menu next to the "Add" button and click "Run All Queries" to update the template with your data within the date range.
- Once the queries are complete, the template will be updated with your data.
Scheduling Data Refresh and Emails
Here's what you've done so far:
- Installed TMR
- Created a Data Source (Amazon Ads) in TMR
- Created a Data Query that fetches your data
Now you have your data in your Google Spreadsheet. The next time you need fresh data, you can run the query again.
Or, you can automate your data queries.
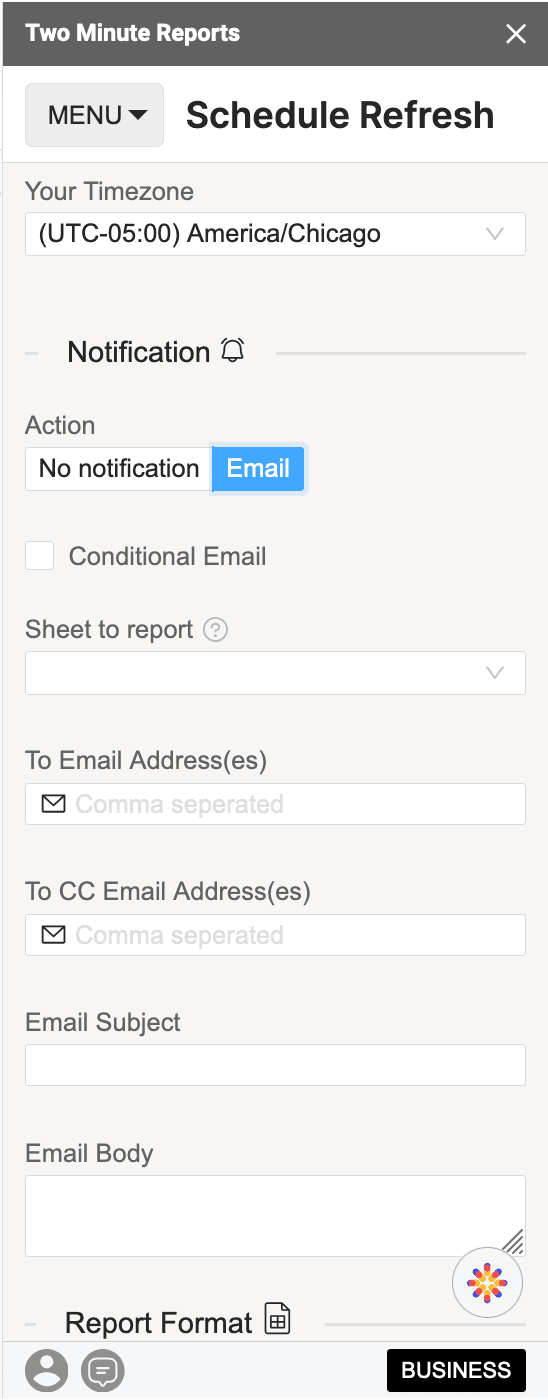
With the "Schedule Refresh" feature, TMR runs automatically, constantly refreshing your queries at your desired date, time, and duration. With this feature, you can also receive your updates via email. Here's how you set this feature up.
- Click the Menu and then on Schedule Reports to open the section.


- Click "New" to add a new "Schedule," instructing Two Minute Reports to run the query automatically.


- Name the Schedule and choose the query to automate.


- Now, choose the frequency and timing to automate your data query
- Choose the frequency: Hourly, Daily, Monthly
- The designated day for the refresh
- The time for the refresh
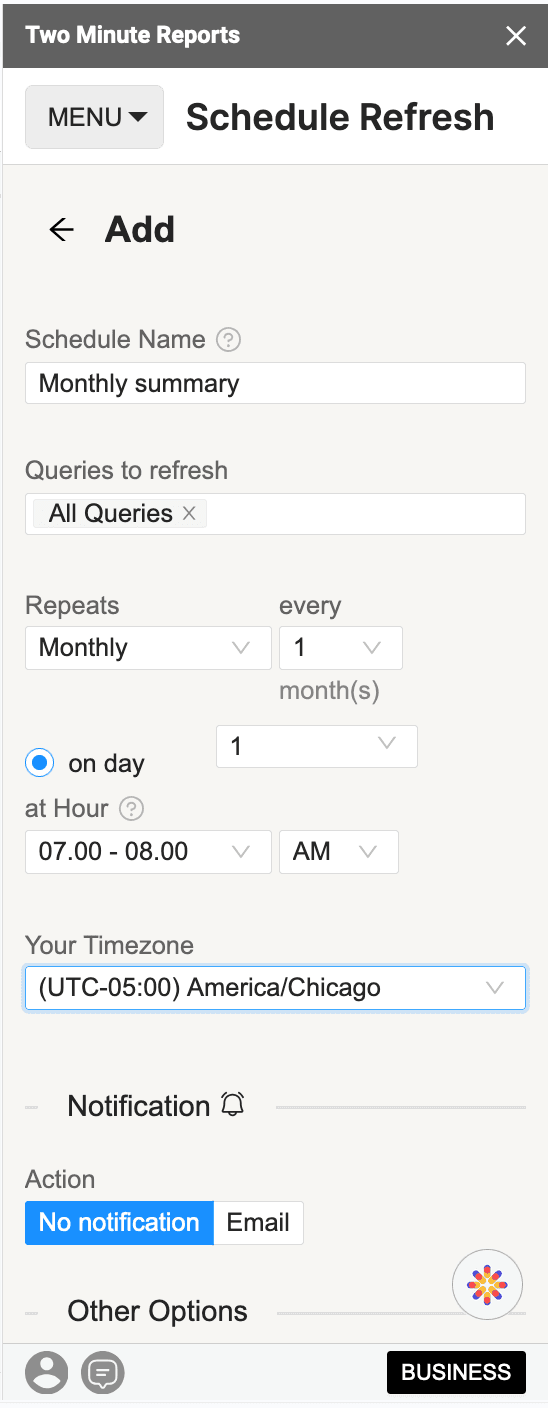

- Under the actions section, you can opt to receive an email notification every time the Schedule runs your query.
- Next, configure your notification email:
- Choose the sheet to report
- Add the email IDs
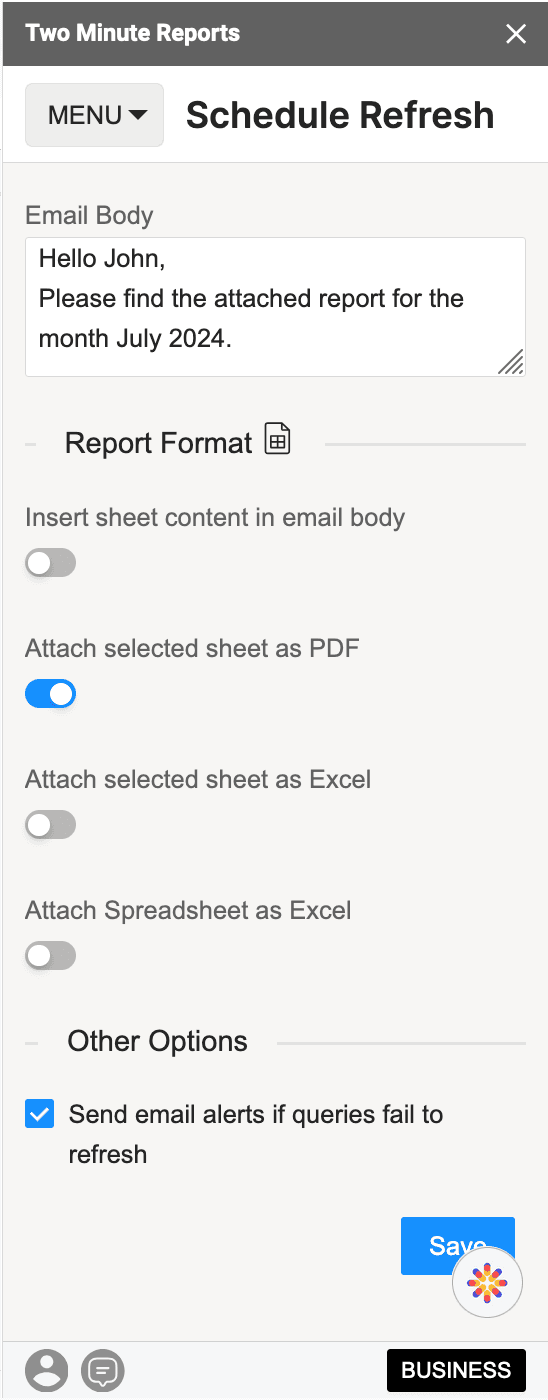
- Add the subject line and the body of your notification email

- You can also choose if you want to send the report as:
- Part of the body
- As a PDF attachment
- Attach the selected sheet as an Excel spreadsheet
- Attach the entire spreadsheet as an Excel spreadsheet


- Save the refresh, and rest assured – TMR will refresh your data at the desired intervals.

Why Two Minute Reports?
- Centralized data integration: TMR is a Google Sheets add-on that consolidates your metrics from various platforms, including top advertising sources and analytics tools. It eliminates the need for manual CSV imports, creating a seamless data flow from Amazon Ads to Google Sheets.
- Extensive integrations and upcoming features: TMR's Google Sheets add-on currently supports integrations with various platforms across advertising, analytics, SEO, social media, e-commerce, email, mobile, CRM, and databases, and more exciting integrations are underway to enhance its capability.
- Intuitive reporting: The TMR add-on helps create professional, mobile-friendly reports. The intuitive interface enables you to craft and customize reports and share them with unlimited users.
- Cost-effective and user-friendly: TMR is a user-friendly add-on with a low learning curve and is affordable without sacrificing functionality.
- Native connectors and API Bridge: Native connectors simplify pulling data from various sources. The API Bridge feature allows connection to any data source that returns JSON, making data accessibility limitless in Google Sheets.
- Efficiency and customization: TMR's add-on helps you quickly set up dashboards with pre-built templates that can be customized and duplicated. Templates can also streamline report generation and client setup.
- Automatic data refreshes and reports: TMR enables you to schedule data to refresh automatically in Google Sheets and send beautifully formatted reports via email, saving time and keeping clients informed with the latest data.
Two Minute Reports is not just about data consolidation but also about empowering businesses. With TMR's AI-powered report creation and configuration tools, your business can now automate and streamline reporting processes, making data-driven decisions quicker and more efficient.
Why import Amazon Ads Data in Google Sheets?
For the best reasons, Google Sheets has been a popular option for creating all reports creation, including those for Amazon Ads, Google Ads, and Facebook (Meta) Ads.
Add-ons and extensions
Google Sheets can integrate several key functions through add-ons. For example, with an add-on like Two Minute Reports, you can extract data, manage data, create reports, and even schedule reports.
Optimized data management
Integrating your Amazon Ads data into Google Sheets allows you to access data from all your campaigns without downloading CSVs or manually checking them. With actionable real-time data, you can always work with the most current information.
Collaborative access
Google Sheets allows you to share files with stakeholders, set permissions, and even drop comments. These collaboration features ensure that all important stakeholders can simultaneously access and work on fresh data.
Customization and flexibility
Google Sheets offers flexibility through formatting and charting options. With the available tools and visual aids, you can tailor customized reports to your specific needs. You can also build dashboards that display only the KPIs relevant to your business without going through other irrelevant data.
Workflow efficiency
Setting up automated workflows to channel data from Amazon Ads to Google Sheets effectively streamlines the data journey from source to analysis. This process ensures seamless synchronization, enabling consistent workflow management by synchronizing and keeping your datasets always synchronized.
Data centralization
With Google Sheets, you can compare campaigns from all advertising platforms, including Amazon, Google, or Snapchat Ads. By unifying your data to a single spreadsheet, you can conduct multi-channel analyses to simultaneously evaluate performance across multiple channels. This approach enables you to make data-driven decisions that enhance the effectiveness of your marketing strategy.
How to build the perfect Amazon Ads Report
With TMR, you can draw deep and detailed analytics from Amazon Ads in under two minutes. Here's a sneak peek into everything the metrics that you can track using Amazon Ads:
- Clicks
- Impressions
- View impressions
- Amount spent
- Cost Per Click (CPC)
- Return on ad spend (ROAS)
- CTR
- Conversion rate (CVR)
- ACOS
- Total orders (7, 14, and 30-day periods)
- Total ad sales (1, 7, 14, and 30-day periods)
You can also add dimensions to these metrics to make your data more accurate. View all the metrics and dimensions you can track here: Metrics and Dimensions - Amazon Ads to Google Sheets.
To create an effective Amazon Ads data report, understand the key performance indicators (KPIs) you can track. Once you have this knowledge, you can develop a robust analytical process to make the most of your data.
Understand what your report needs
Explore the various types of KPIs and their relationships with each other to choose the most relevant KPIs to your needs.
Pick the relevant metrics
With Amazon Ads, almost every activity (qualitative or quantitative) is a metric that can be tracked. Choose the right metrics (and dimensions) that align with your KPIs.
Choose the key metrics for your campaign and business
Choose metrics that match your goals— Do you want more orders/sales? Or do you want your brand to have more reach for your brand to build a loyal customer base? These decisions could give better direction to your analytics.
Track and optimize
Your campaigns can constantly evolve. Diligently track these changes and make consistent changes to your campaigns. Never underestimate the insights that your reports can give you.
Save over 3 hours per report and create data reports in under 2 minutes! Try our 14-day free trial.
Get Amazon Ads data in Looker Studio
Two Minute Reports can be installed to integrate Amazon Ads data with Looker Studio (formerly Google Data Studio), enabling advanced data analysis and visualization.
This Amazon Ads add-on allows the creation of detailed reports and dashboards using insights from Amazon Ads insights without the complexity of manual data entry. Looker Studio's customization capabilities also let users craft custom formulae in a user-friendly interface.
With seamless integration, comprehensive analytical capabilities, and automated workflows, strategic business intelligence from Amazon Ads has just become quicker and more accessible.
Connect other Platform Data Sources with Google Sheets
With this add-on, you can connect 30+ Data Sources to Google Sheets, create additional reports, create visualizations, and build a comprehensive report.
Facebook Ads
Social media ad platform for targeted audience reach.
Google Ads
Advertising platform for displaying ads on Google's search results pages.
Linkedin Ads
Professional social media platform's advertising data source.
Snapchat Ads
Social media advertising platform for Snapchat users.
Frequently Asked Questions
A report's Data Source is where you grab data for analysis, comparison, and decision-making. Determining and adding a data source is the first step in creating a report.
Dimensions are additional attributes of your website which provide information about it. For example, the "Date" dimension tells the date a visitor visited your website.
Several add-ons, like the Amazon Ads Spreadsheet add-on or Two Minute Reports, connect your Amazon Ads account(s) to Google Sheets and automate data extraction. Similar to Two Minute Reports, there are several extensions/tools that you can use.
To understand which data to extract from your ad campaigns, you must first understand what the KPIs indicate and which are relevant to your business needs.
With our "Schedule Refresh" feature, you can automate your reports and templates to refresh automatically at your desired date, time, and duration with a copy sent to your mail.
It is an Amazon Ads add-on that helps you integrate data from Amazon Ads to Google Sheets, create reports, and analyze data effectively and seamlessly. It supports over 30 data sources such as Shopify, Google Trends, and more.