
Summarize this blog post with:
Analyzing campaign performance is an integral part of a marketer’s daily routine. Sifting through vast amounts of data and gaining actionable insights from monitoring metrics and KPIs makes small-scale and large-scale businesses rely on marketers to drive the desired ROI. Google offers the best solution, the GA4 tool, which enhances the analytics experience and results with comprehensive GA4 reports.
What is Google Analytics 4?
Google Analytics 4 (GA4) is the latest version of Google Analytics, a leading web analytics platform. GA4 distinguishes itself from prior versions because it focuses on event-driven data collection and analysis rather than the traditional session-based model. Through GA4 reports, this model provides a comprehensive understanding of user interactions across websites and mobile applications, allowing businesses to seamlessly track and analyze customer journeys across devices.
GA4 utilizes advanced machine learning capabilities to offer businesses deeper insights into user behavior, engagement patterns, and conversion metrics. This version is designed with privacy in mind, aligning with modern data protection regulations by offering features such as enhanced data control and the ability to manage user consent effectively. Overall, GA4 equips marketers with the tools to understand their audience better and make informed decisions that enhance marketing strategies and drive ROI.
Currently, 14.2 million websites rely on GA4 to make data-backed decisions based on customer behavior. By 2028, experts estimate that the global Analytics-as-a-Service (AaaS) market will reach $69 billion. This growth highlights how essential GA4 Analytics is today.
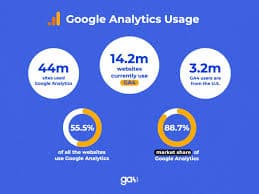
 Image Source: GA4
Glossary
How can GA4 enhance your analytics?
GA4 helps you gain insights into what is going on with your website. With this understanding, you can optimize functionality, improve user experience, and fine-tune strategic actions. It enables you to find answers to key questions like:
- How many visitors does your website receive daily, hourly, monthly, or yearly?
- Where are your visitors located geographically?
- How much traffic each marketing campaign generates?
- What is the average time users spend on each page?
- Which pages attract more visitors?
- How do users find your website?
- The number of visitors converting into leads?
- Which pages drive the highest conversions?
Beyond insights, GA4 prioritizes security and privacy, as the tool no longer stores IP addresses. Your data resides on EU or US servers, depending on its origin. This provides privacy-first event tracking and gives you regional control over Google signal data collection. These features help businesses protect their data and manage information sharing more effectively.
Difference between GA4 and Universal Analytics: The shift to event-based GA4 reporting
As mentioned, GA4 unifies app and web analytics, providing a complete view of the customer journey across multiple platforms. GA4 is the newer generation of Google Analytics that helps you navigate and better understand user behavior with deeper insights and a more holistic approach.
GA4 has several key features that are different from Universal Analytics (UA). It offers greater flexibility, an event-driven data model, and a privacy-first approach, making it a future-ready analytics tool. While there are many technical infrastructure changes under the hood, here’s a simplified breakdown of what’s changing:
GA4 reporting: What’s in it for marketers?
Marketers don’t settle for minimal results, and neither does their targeted audience. A visually appealing website alone isn’t enough to compel a specific action—you need data-driven insights to know how well your website is performing, how well it engages its users’ interest, and where the users drop off.
That’s where Google Analytics 4 comes in. It fetches data from your websites and apps, generating reports that provide insights and summaries of how people discover your website, navigate, and interact with the available features and content. These visualized data help you track traffic, identify user behavior patterns, and optimize your marketing efforts and overall user experience.
The GA4 reporting interface is completely different from Universal Analytics. While there are many promising features and updates to those found in UA, the reporting dashboards and reports are fundamentally different here. Though GA4 offers fewer predefined reports, it provides a greater opportunity to customize reports aligning with your needs.
Importance of GA4 reports
GA4 reporting provides marketers with powerful insights to enhance decision-making and optimize performance. These data-driven decisions help maximize engagement and conversions and win the ultimate goal of ROI. With GA4, you can:
- Gain real-time insights into user behavior, actions, and engagement.
- Track overall website performance to identify trends and areas for improvement.
- Communicate key GA4 insights to clients, letting them know how your marketing strategies add value to their investments and bring desired results.
- Identify top-performing content and keywords to refine SEO strategies.
- Analyze Google Ads performance, recognizing which campaigns drive the most clicks.
- Optimize budgets by focusing on high-performing channels and strategies.
- Store and refer to historical data to measure progress and forecast trends.
- Unlock deeper audience insights for better personalization and targeting.
What are the types of GA4 reports?
GA4 introduces several new reports that enable marketers to monitor website activity more precisely. It provides simple reporting powered by machine learning to track and analyze data. With these insights, you can predict your campaign success and determine whether you have met or exceeded your desired goal. Also, GA4 reports allow you to utilize a remarkable dashboard, pre-built reports, and custom reporting capabilities to monitor personalized data.
Standard GA4 report types
The Standard reports are located in the left navigation, providing a variety of easy-to-digest summary cards that allow you to quickly access key insights. These GA4 Standard reports, preconfigured and designed for effortlessly understanding your site efficiency and user journey, come in three main sections and respective subsections:
- Realtime reports
- Realtime overview reports
- Realtime pages reports
- Lifecycle reports
- Acquisition reports
- Engagement reports
- Monetization reports
- Retention reports
- User reports
- User attributes reports
- Tech reports
This section of reports can expand if you use Google Analytics for games or app reporting or if you’ve integrated GA4 with Google Search Console. In such cases, additional sections like Games reporting, App developer, and Search Console will appear in the Reports tab.

Let's dive deep into these basic GA4 reports that you’ll use for your website analytics:
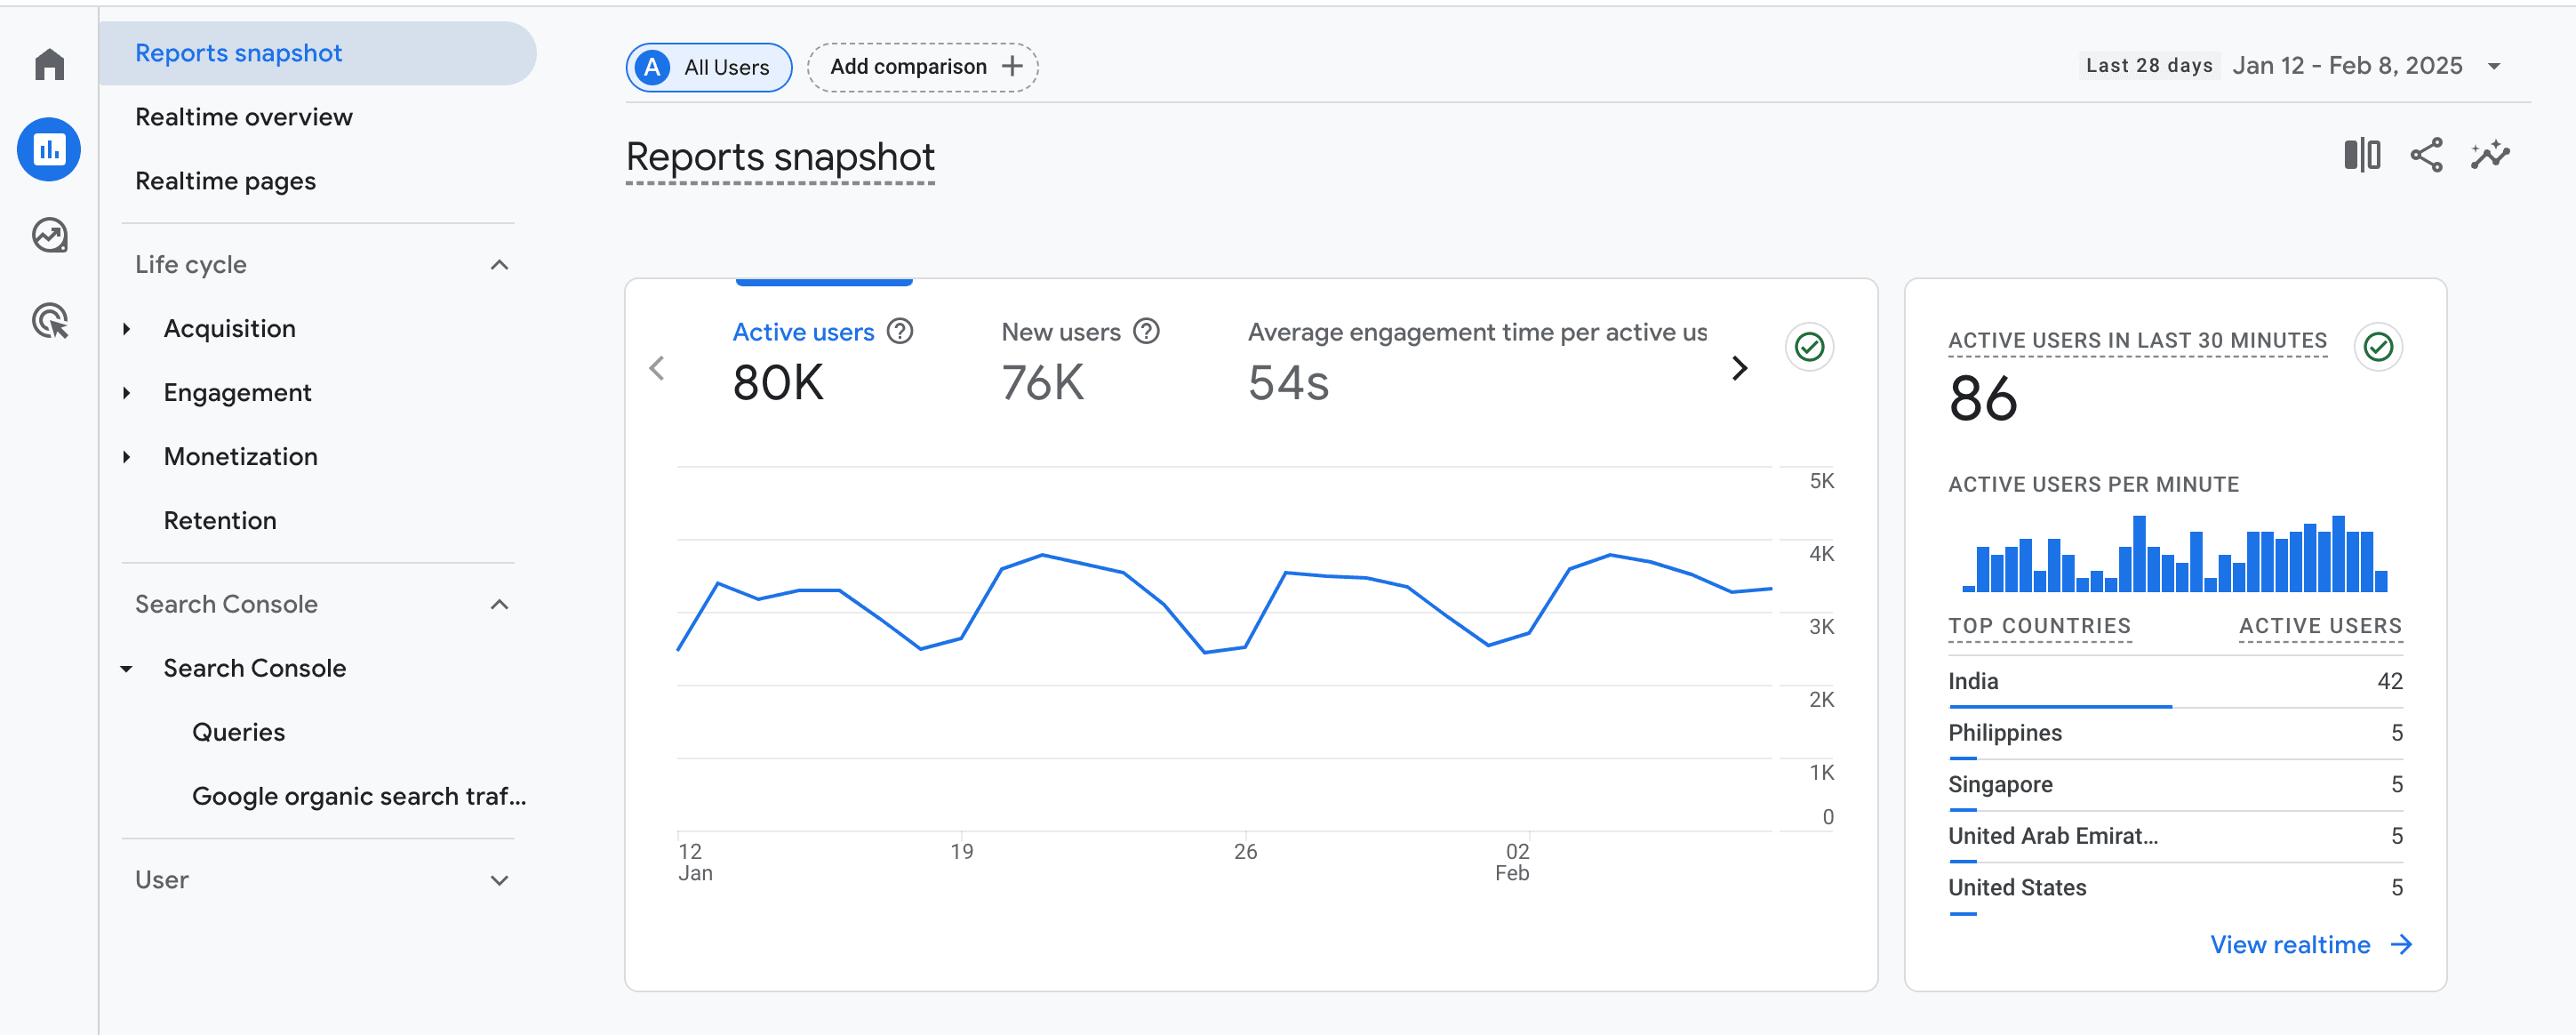
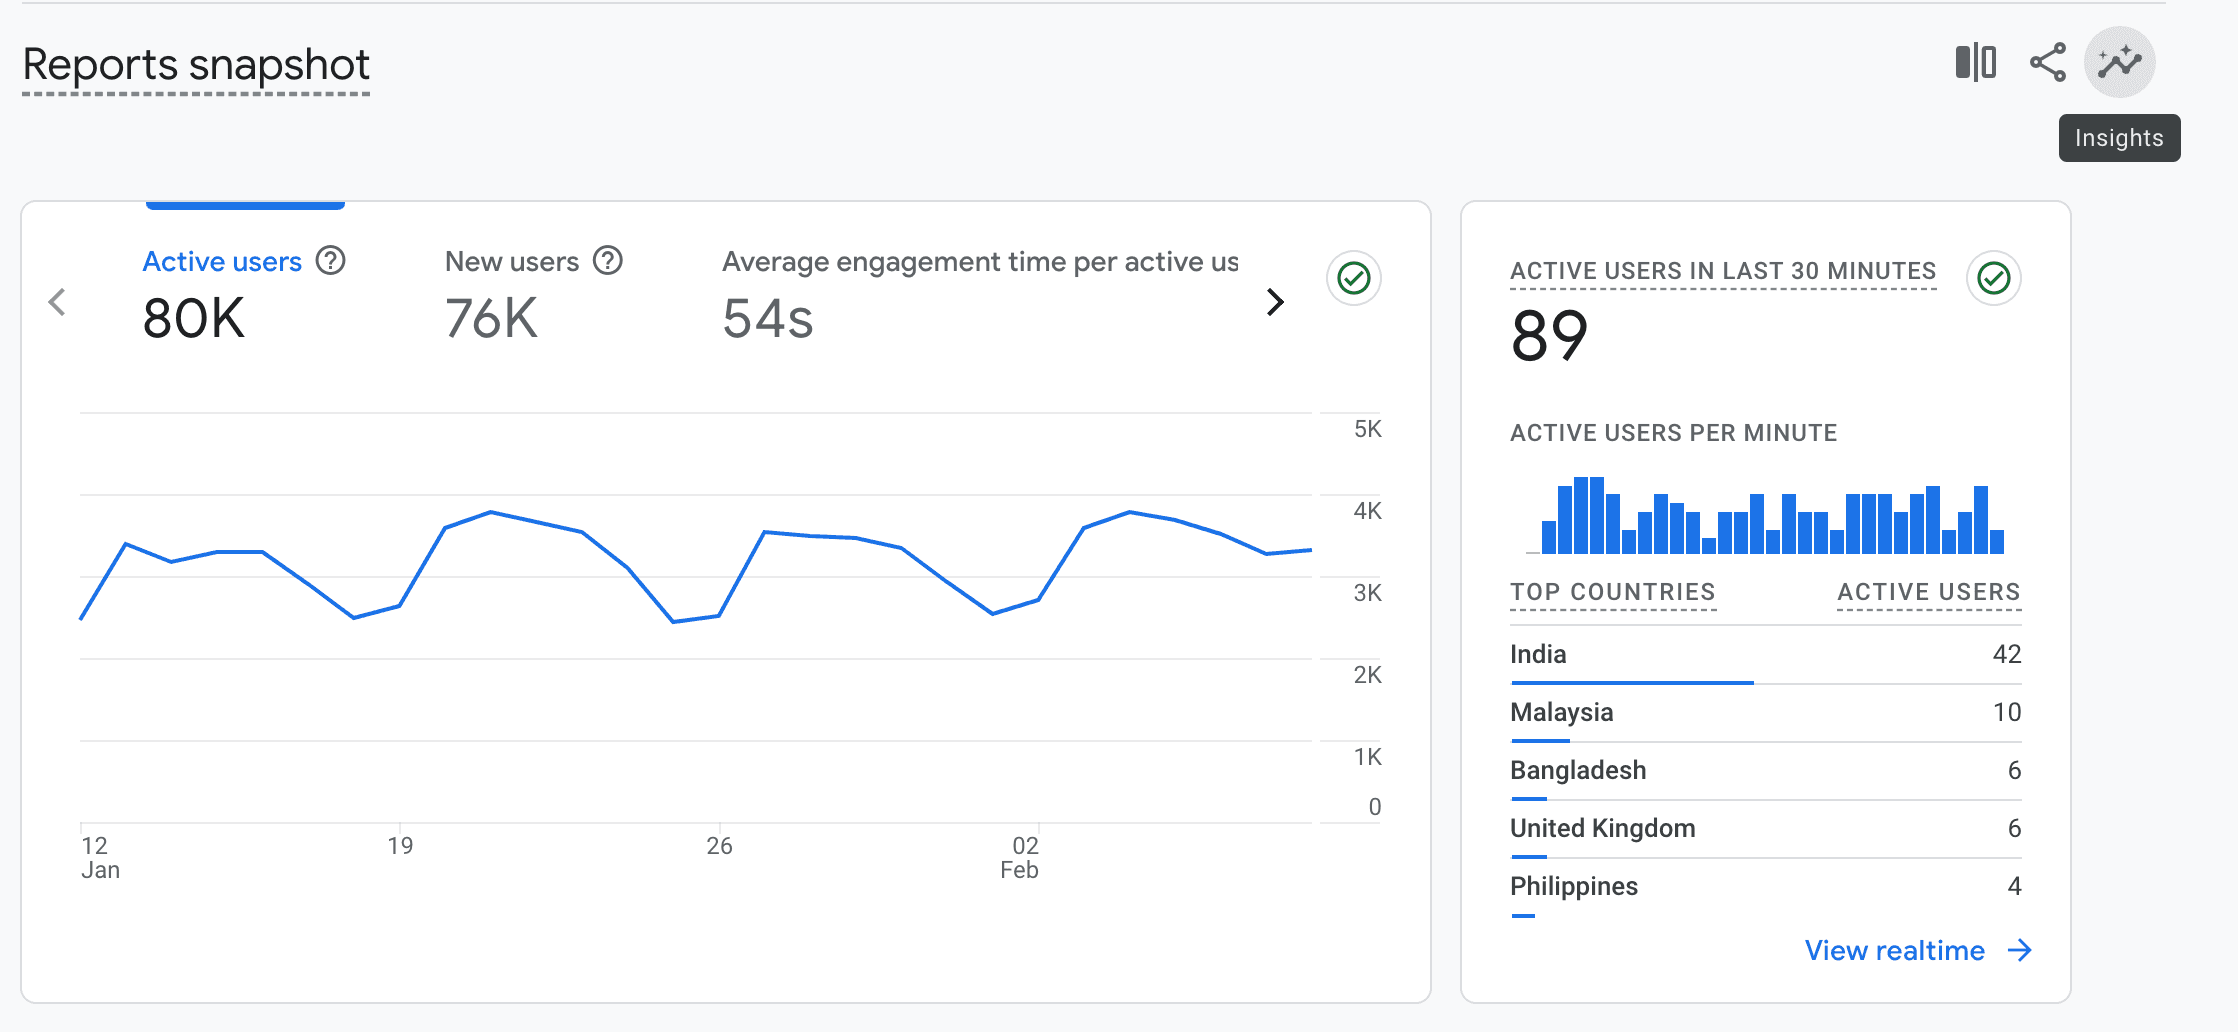
Reports snapshot
The Reports snapshot is the first section on your screen when you click on Reports. It is an overview report presenting summary cards providing an egalitarian view of key metrics across your website or app.
This report lets you gain quick insights into user activity, engagement, evolving trends, etc. You can customize your report snapshots by choosing the segments you want to view for a more personalized glimpse of your GA4 data.

Realtime
In Realtime reports, you gain access to real-time interactive visualizations with insights into:
- The number of visitors on your website in the last 30 minutes
- Where your traffic is from (source, medium, or campaign)
- Who your users and audience are (demographic and geographic details)
- The type of content your users actively engage with
- Which conversions do your users complete, and what type of events do they trigger
There are two sections in the GA4 Realtime reports:
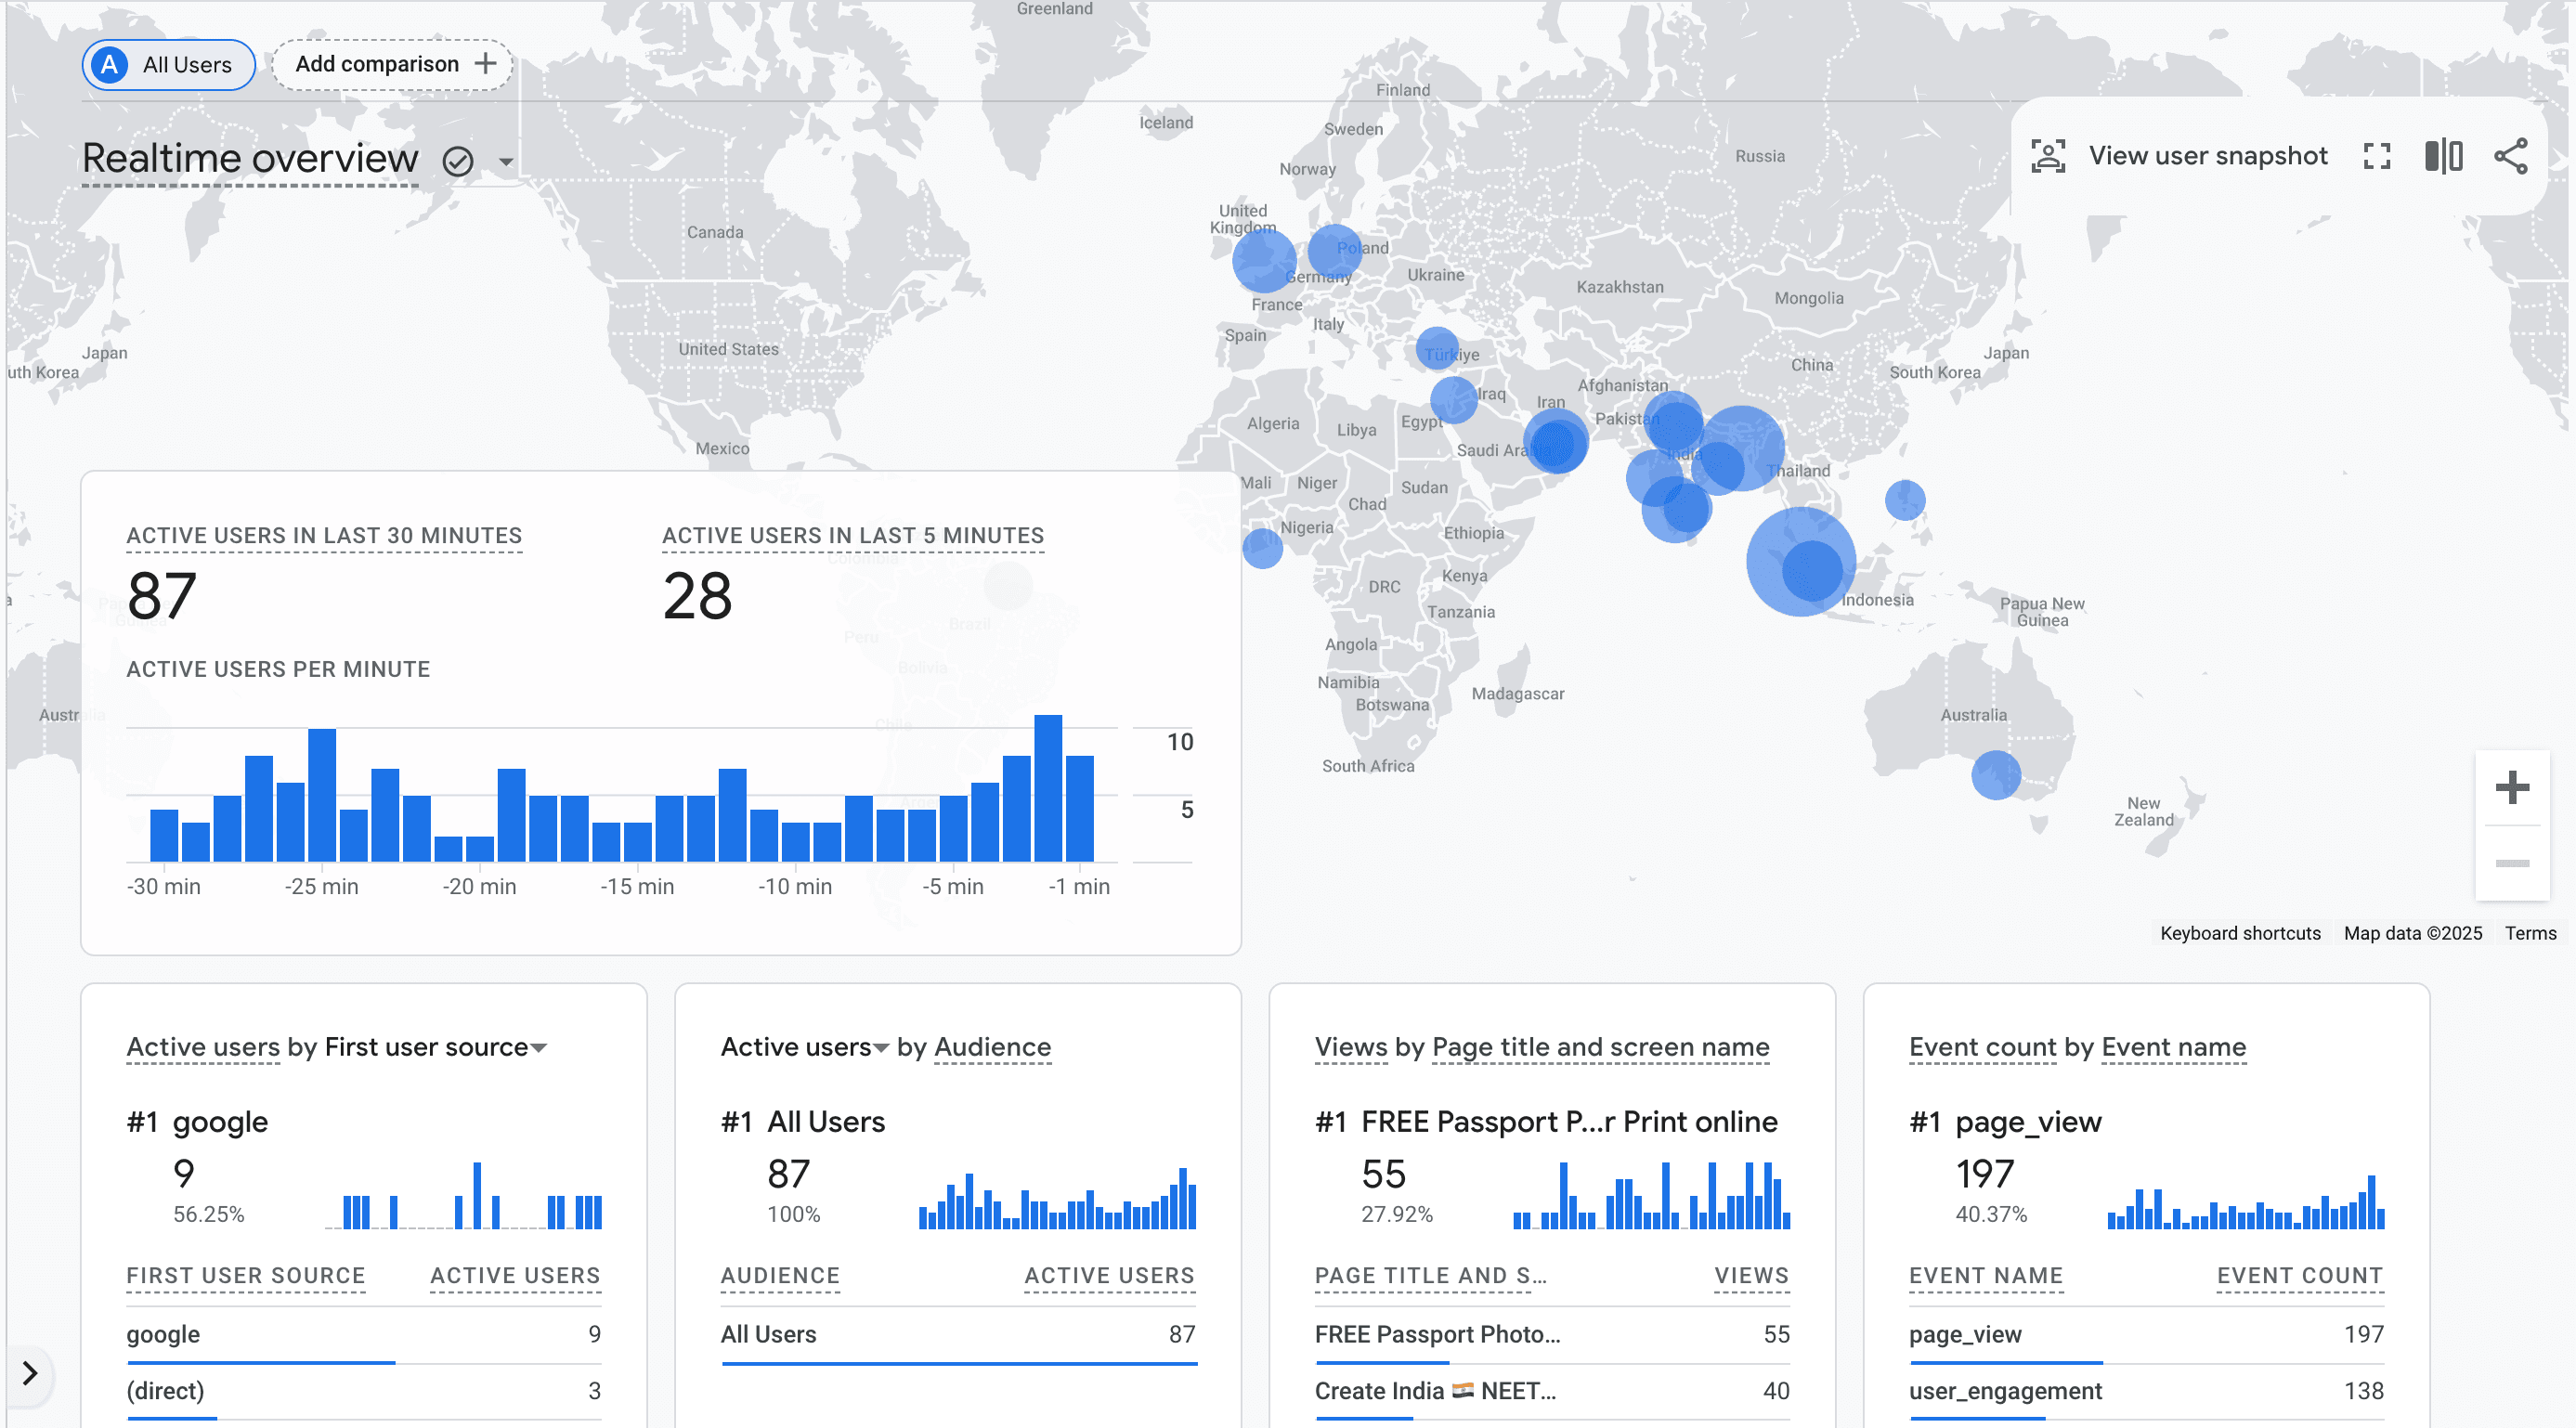
1) Realtime overview
The GA4 Realtime overview report provides a live snapshot of user activity on your website or app, displaying key metrics such as the number of active users, demographics, geographic locations, traffic sources, and recent events or conversions. This report helps you monitor live website performance, track campaign results, and respond to user behavior in real-time.

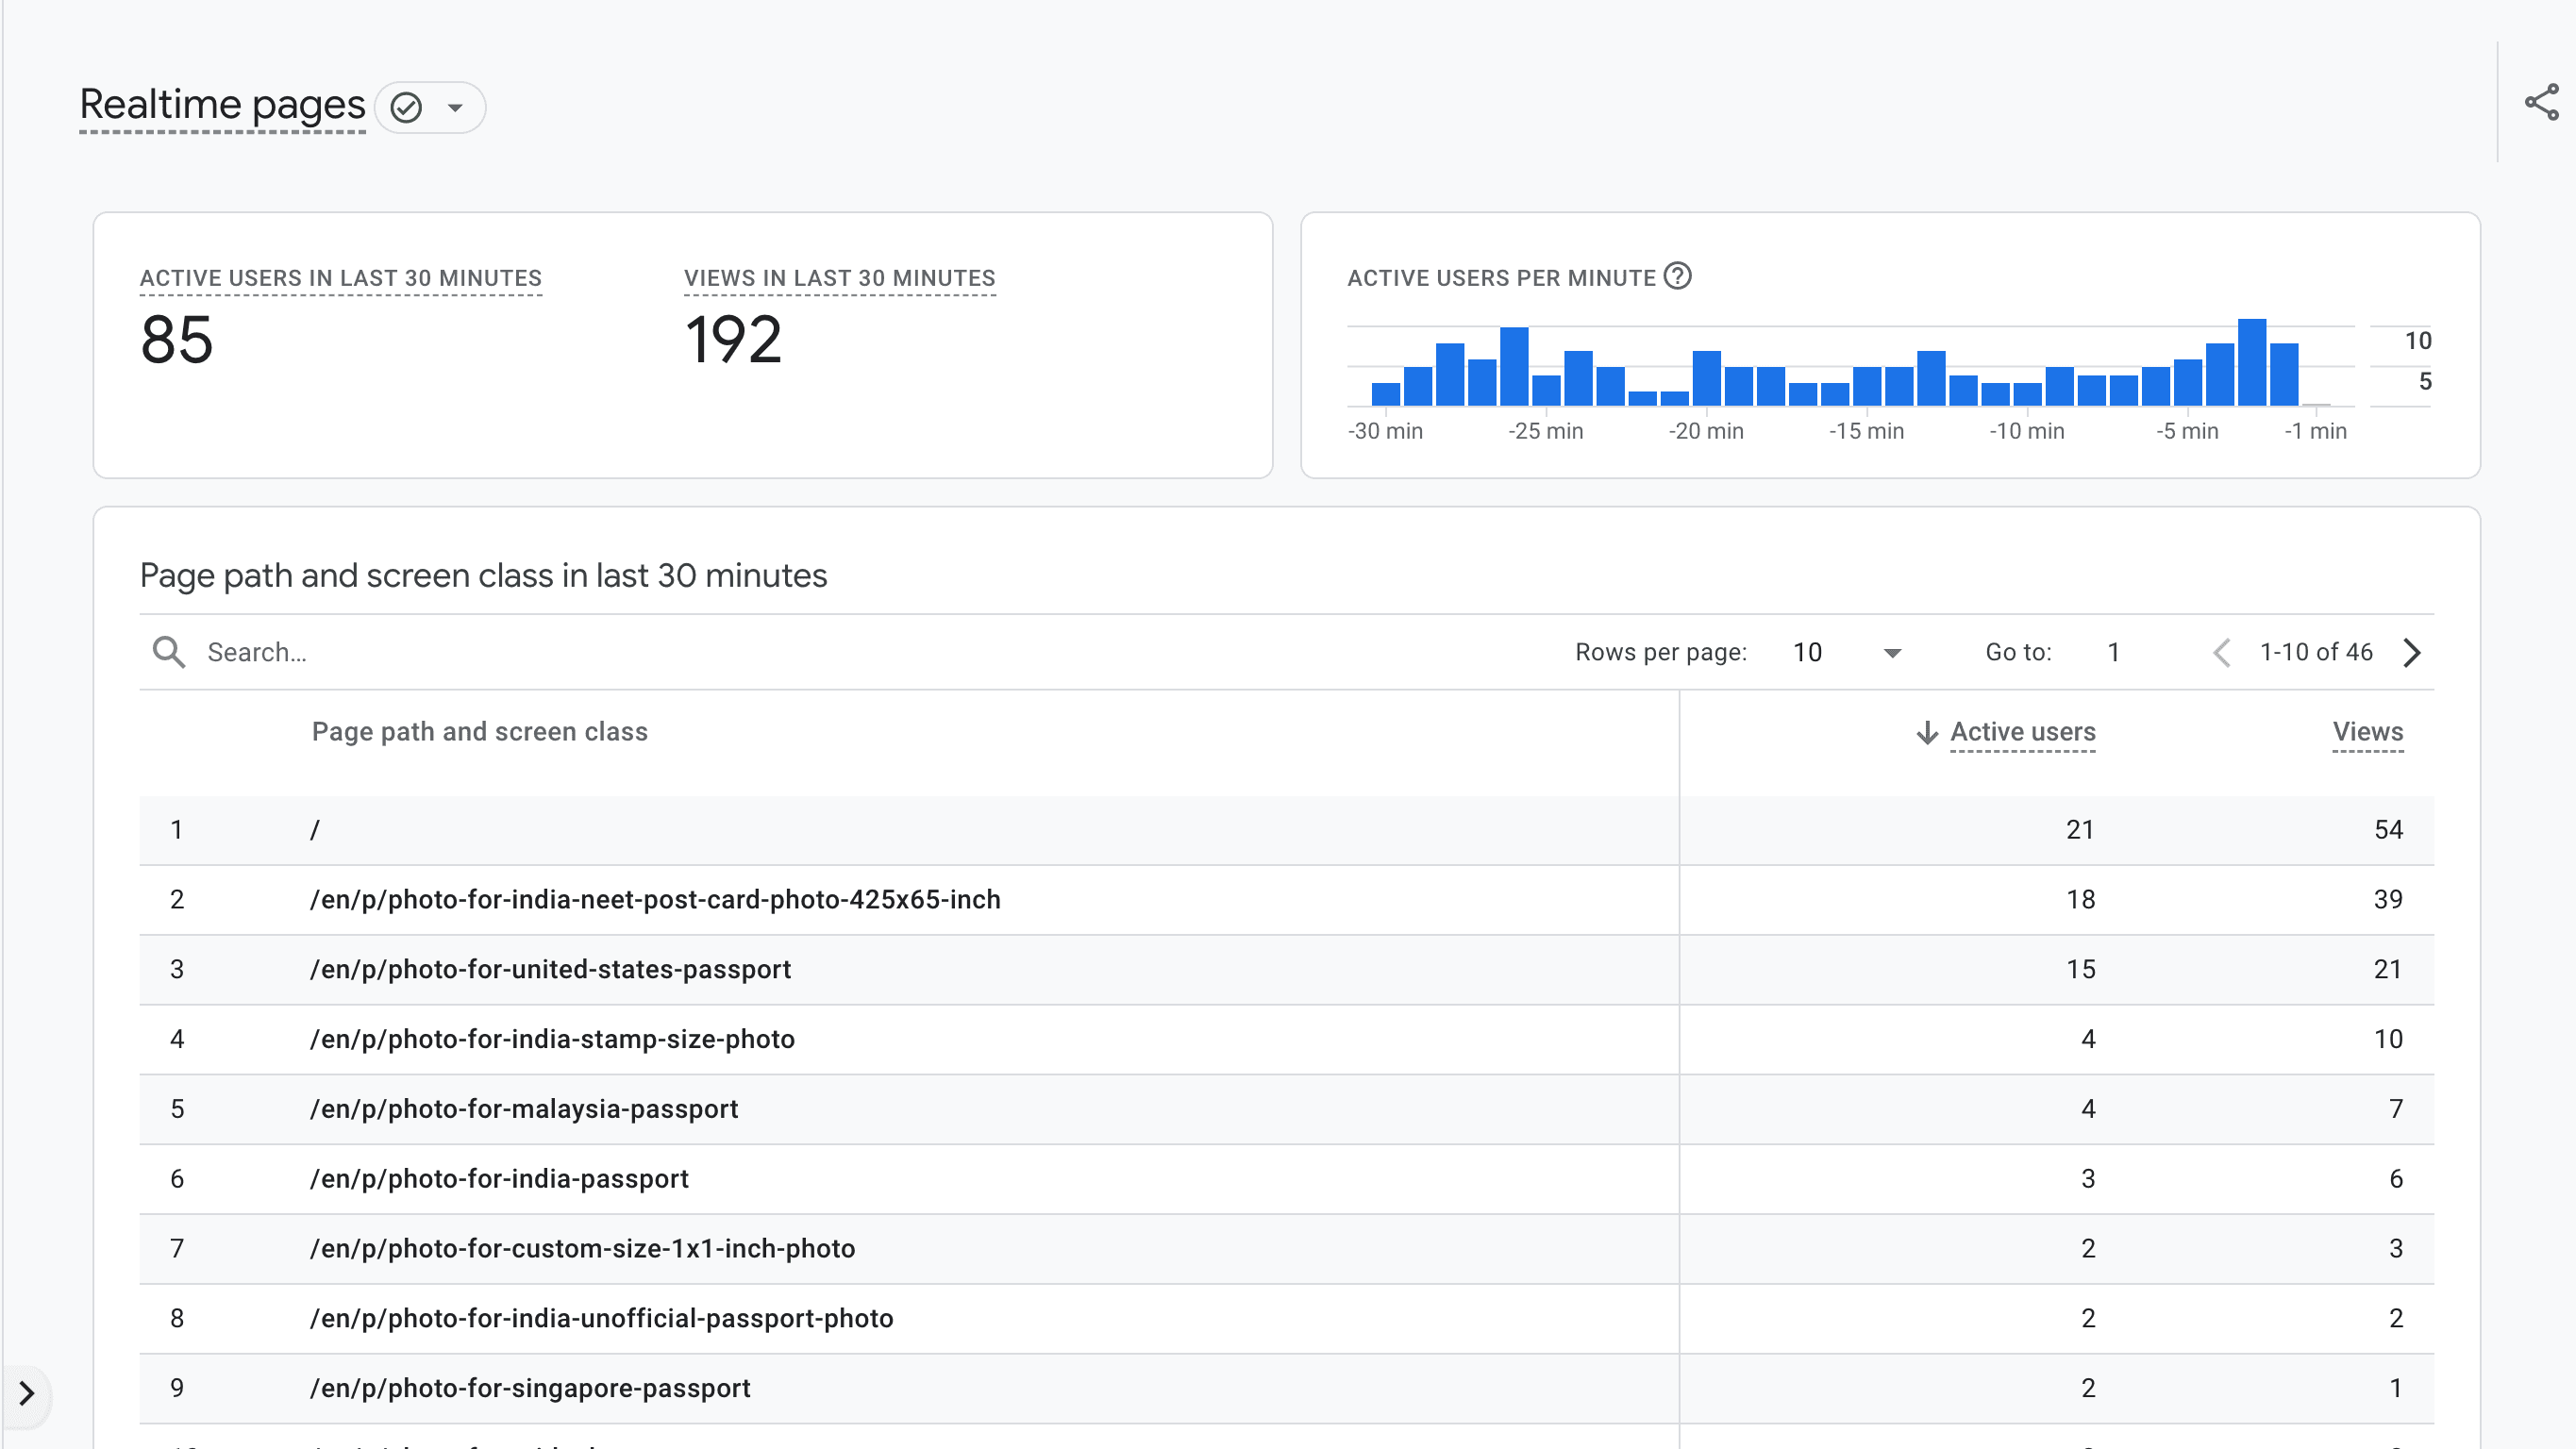
2) Realtime pages
The GA4 Realtime pages report shows the specific pages on your website with which users are currently engaging. It helps you identify high-traffic pages, track engagement trends, and analyze how users interact with your content. You can use this GA4 report to monitor new campaigns, promotions, or content updates.

Lifecycle
The GA4 Lifecycle report section provides a closer look at user activity by covering their entire journey through four stages: Acquisition, Engagement, Monetization, and Retention. These generated reports help you find answers to questions like:
- How does a user enter the conversion funnel?
- What actions do they take once inside the funnel?
- How do they interact with your site before converting?
Acquisition
Reports and visuals under this section highlight your traffic sources. Under this section, you get to know where your traffic originates from, the channels and methods through which users arrive at your website, and determine which of your marketing efforts are paying off. These insights allow you to optimize strategies and allocate resources more effectively for higher engagement and conversions.


It’s further divided into four sub-sections:
1) Overview: With these platform-specific acquisition data cards, you can identify and track the most effective traffic sources and measure the performance of your marketing campaigns, influencing strategies for better results.
2) User acquisition: This section allows you to analyze where your new users come from using the “first user” attribution model. You can learn how first-time visitors land on your website or app, providing insights into the effectiveness of awareness-stage marketing efforts.
3) Traffic acquisition: It presents insights into sources of new sessions, working on a session basis. It gives a detailed overview of how all users (including new and returning visitors) find your website or app, offering a deeper understanding of overall traffic patterns and user engagement.
4) User acquisition cohorts: This groups users based on the time they were acquired and tracks their behaviors over time, helping you:
- Identify long-term engagement and retention trends.
- Compare cohort performance to measure loyalty and churn.
- Understand how different acquisition strategies impact user behavior over weeks or months.
- Optimize marketing efforts for sustained user retention.
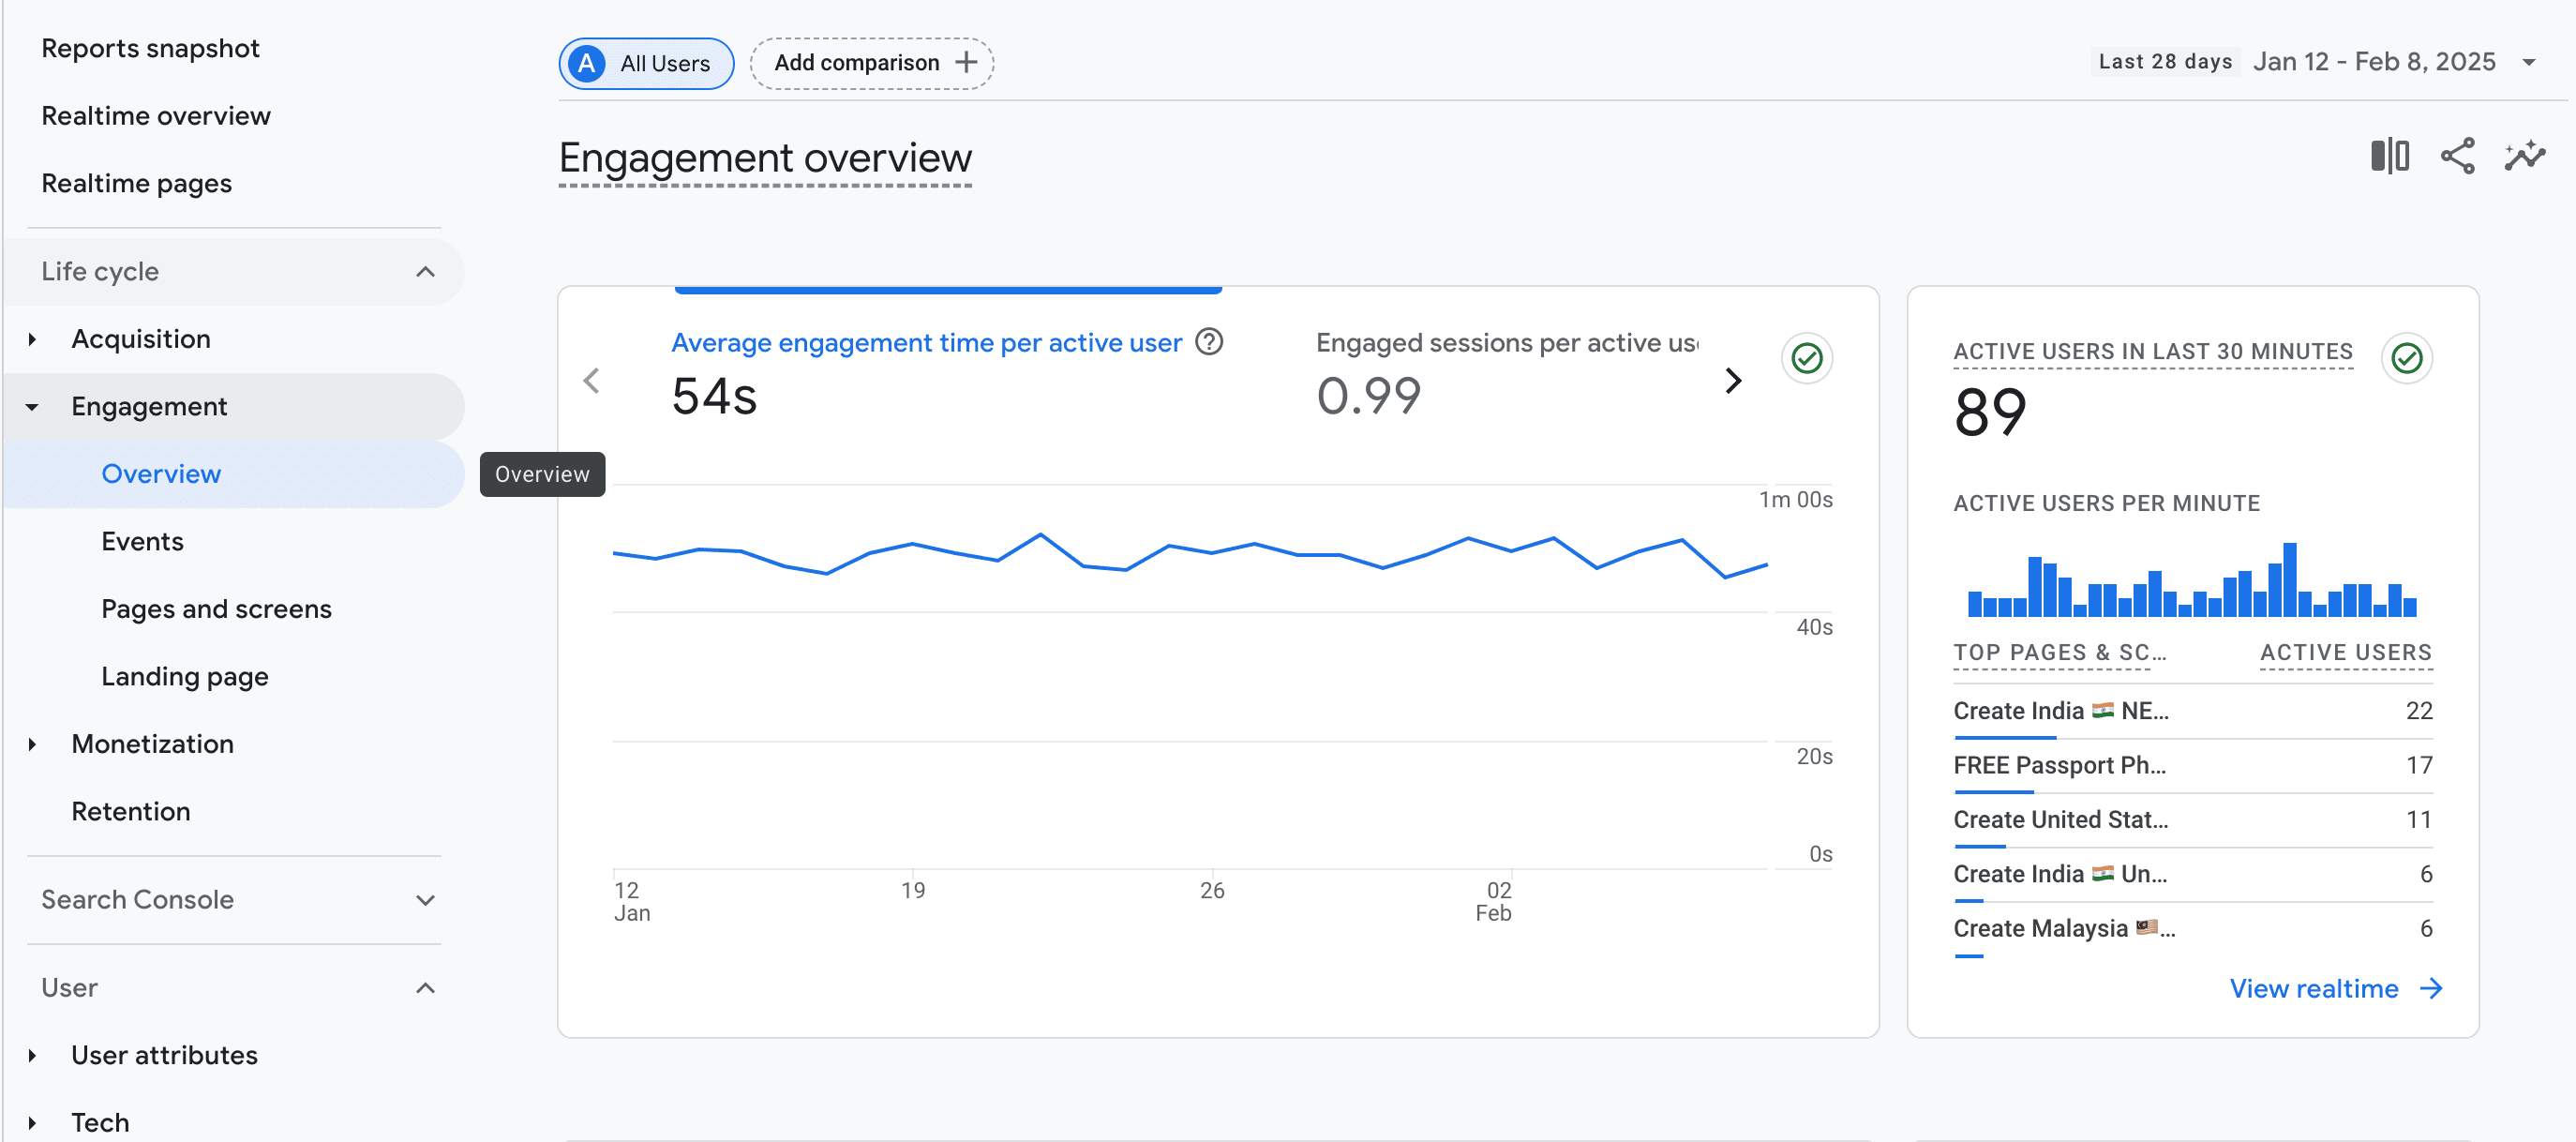
Engagement
GA4 Engagement reports help you analyze how users interact with your website or app by tracking events and conversion events. By leveraging this report, you can monitor which pages and screens drive the most engagement, optimize user experience, refine content strategy, and drive more meaningful interactions.
1) Overview Report: This report provides a snapshot of key user engagement metrics, including session duration, Interactions, and average engagement time per session.
2) Events Report: The GA4 event report tracks user interactions, such as clicks, downloads, video views, and custom-defined events. It helps measure user behavior and assess engagement beyond just page views.
3) Pages and Screens Report: This report analyzes the performance of individual pages or app screens, offering insights into user preferences, high-performing pages, optimization requirements, and pages that may need improvements.
4) Landing Page Report: This report highlights the performance of the first page users land on when visiting your website. It helps you identify high-converting landing pages, spot underperforming pages that require optimization, and improve user retention by enhancing first impressions.

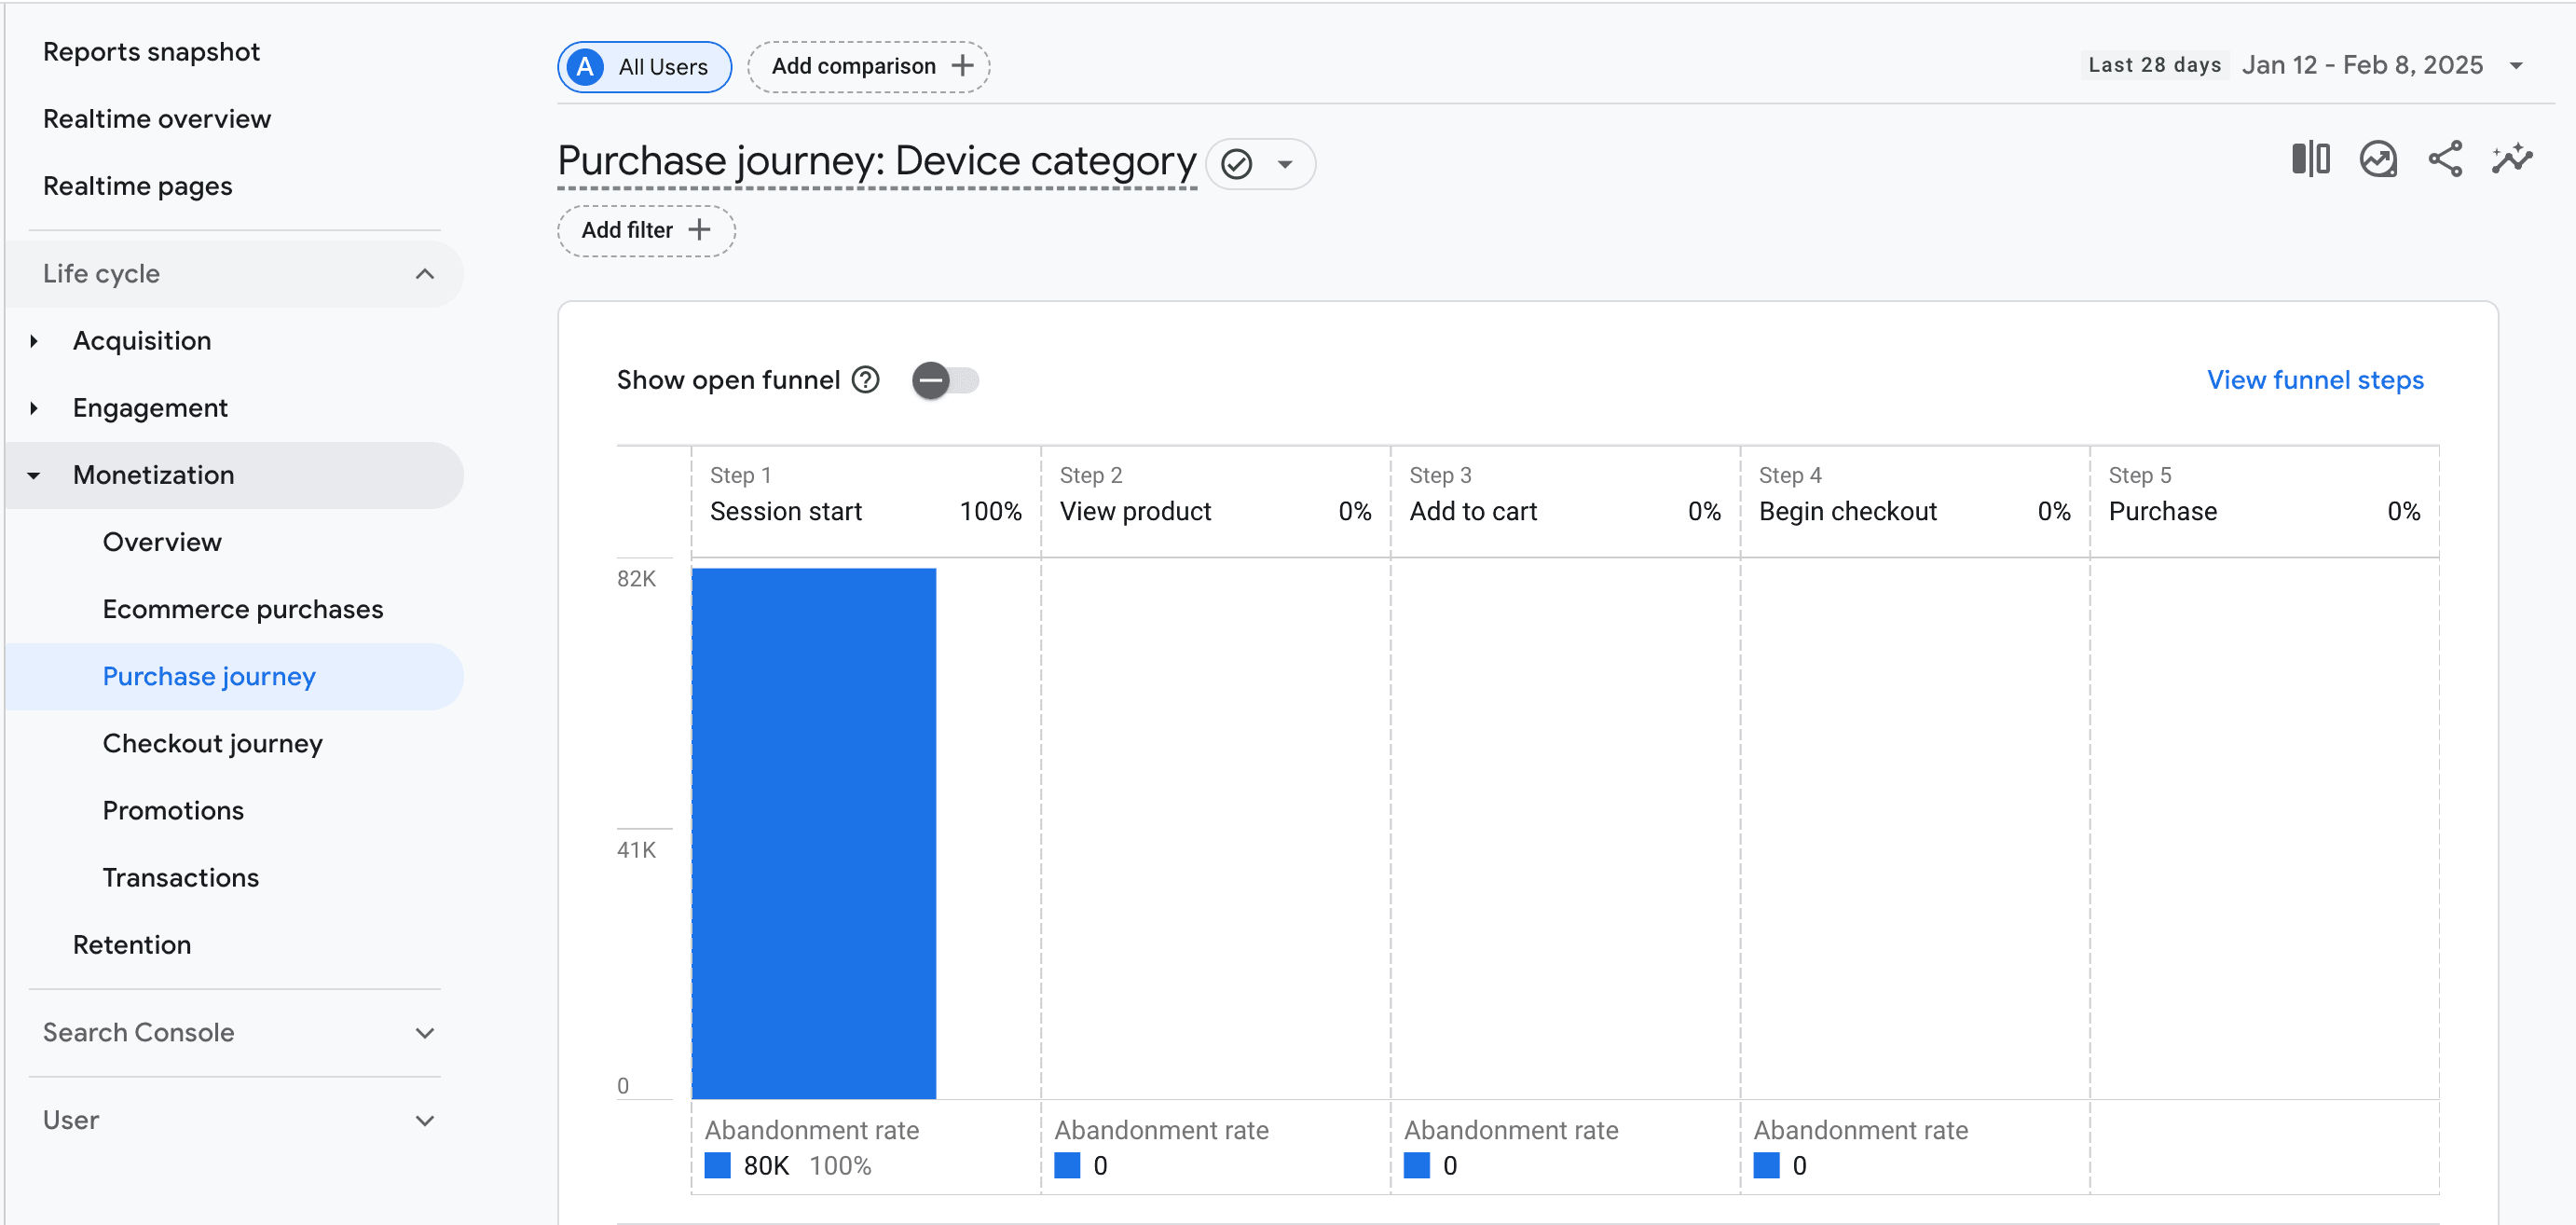
Monetization
GA4 Monetization reports help you track revenue-related metrics and understand how users' actions generate value or revenue for your business. Whether you're running an ecommerce store or a mobile app, these reports break down financial performance across different monetization methods, helping you understand your revenue streams and optimize your monetization strategy for high returns.
Breaking down the sub-sections:
1) Overview report: This report clearly shows your revenue by tracking key financial metrics across all monetization sources. It also helps you measure overall performance and spot trends in user spending.
2) Ecommerce purchases report: This is important for running an online store. It lets you analyze transactions, revenue, and product performance. As a result, you can see what’s selling and what’s not and decide where to optimize your offerings.
3) Purchase journey report: This report maps the entire user journey from discovering your site to purchasing your product. By analyzing where users drop off, you can pinpoint inefficient areas and make strategic adjustments to boost conversions.

4) In-app purchases report: This report tracks revenue from in-app purchases for mobile apps. It helps you understand what users buy and whether your monetization strategy works.
5) Checkout journey report: This report focuses on the checkout process. It highlights user’s actions of where they abandon their purchases. Identifying friction points here can help create a smoother, more effective checkout experience.
6) Transactions report: This is a straightforward summary of your ecommerce performance, including completed purchases, total revenue, transaction counts, and more. If you want to see your sales performance, this is where you look.
Retention
GA4 Retention reports help you track how well your website or app engages users' interests over time. The retention overview report represents this section and provides insights into user retention trends and long-term loyalty.
With this report, you can:
- Monitor returning visitors along with their behavior.
- Understand how frequently users come back after their first visit.
- Analyze how long users continue interacting with your website or app and the specific area where they drop off.
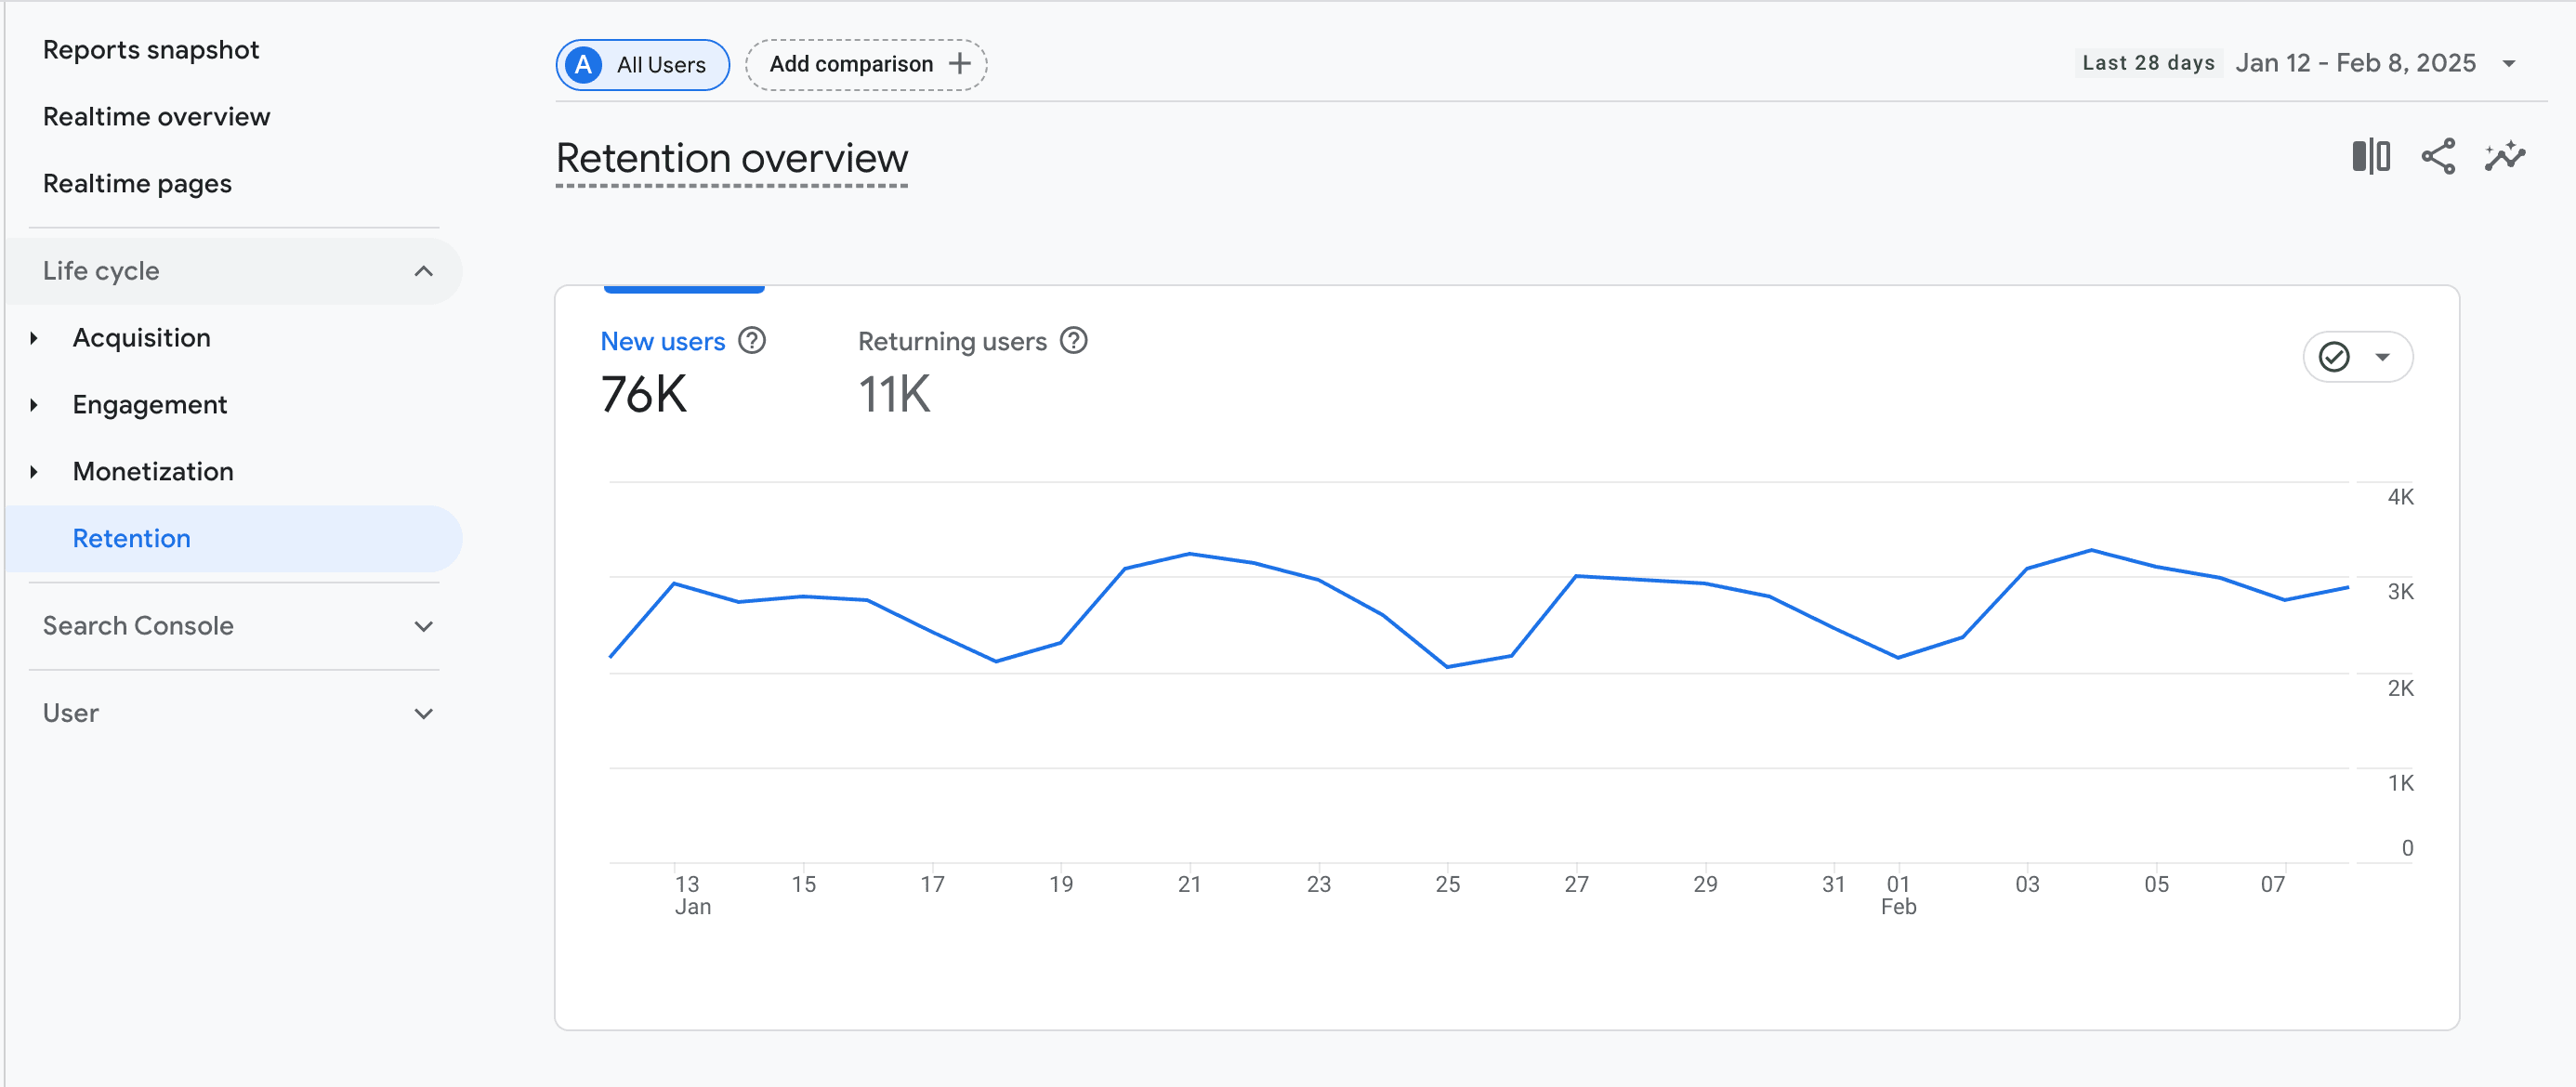

One key feature of this report is the ability to track user re-engagement within the first 42 days after the initial visit. You can see the percentage of users who return daily, helping you evaluate how well your content, user experience, and marketing strategies bring visitors back to your site.
User
The User collection in GA4 consists of two key sections: Demographics and Tech. These reports help you better understand your audience by providing insights into who they are and what technology they use to access your site or app.
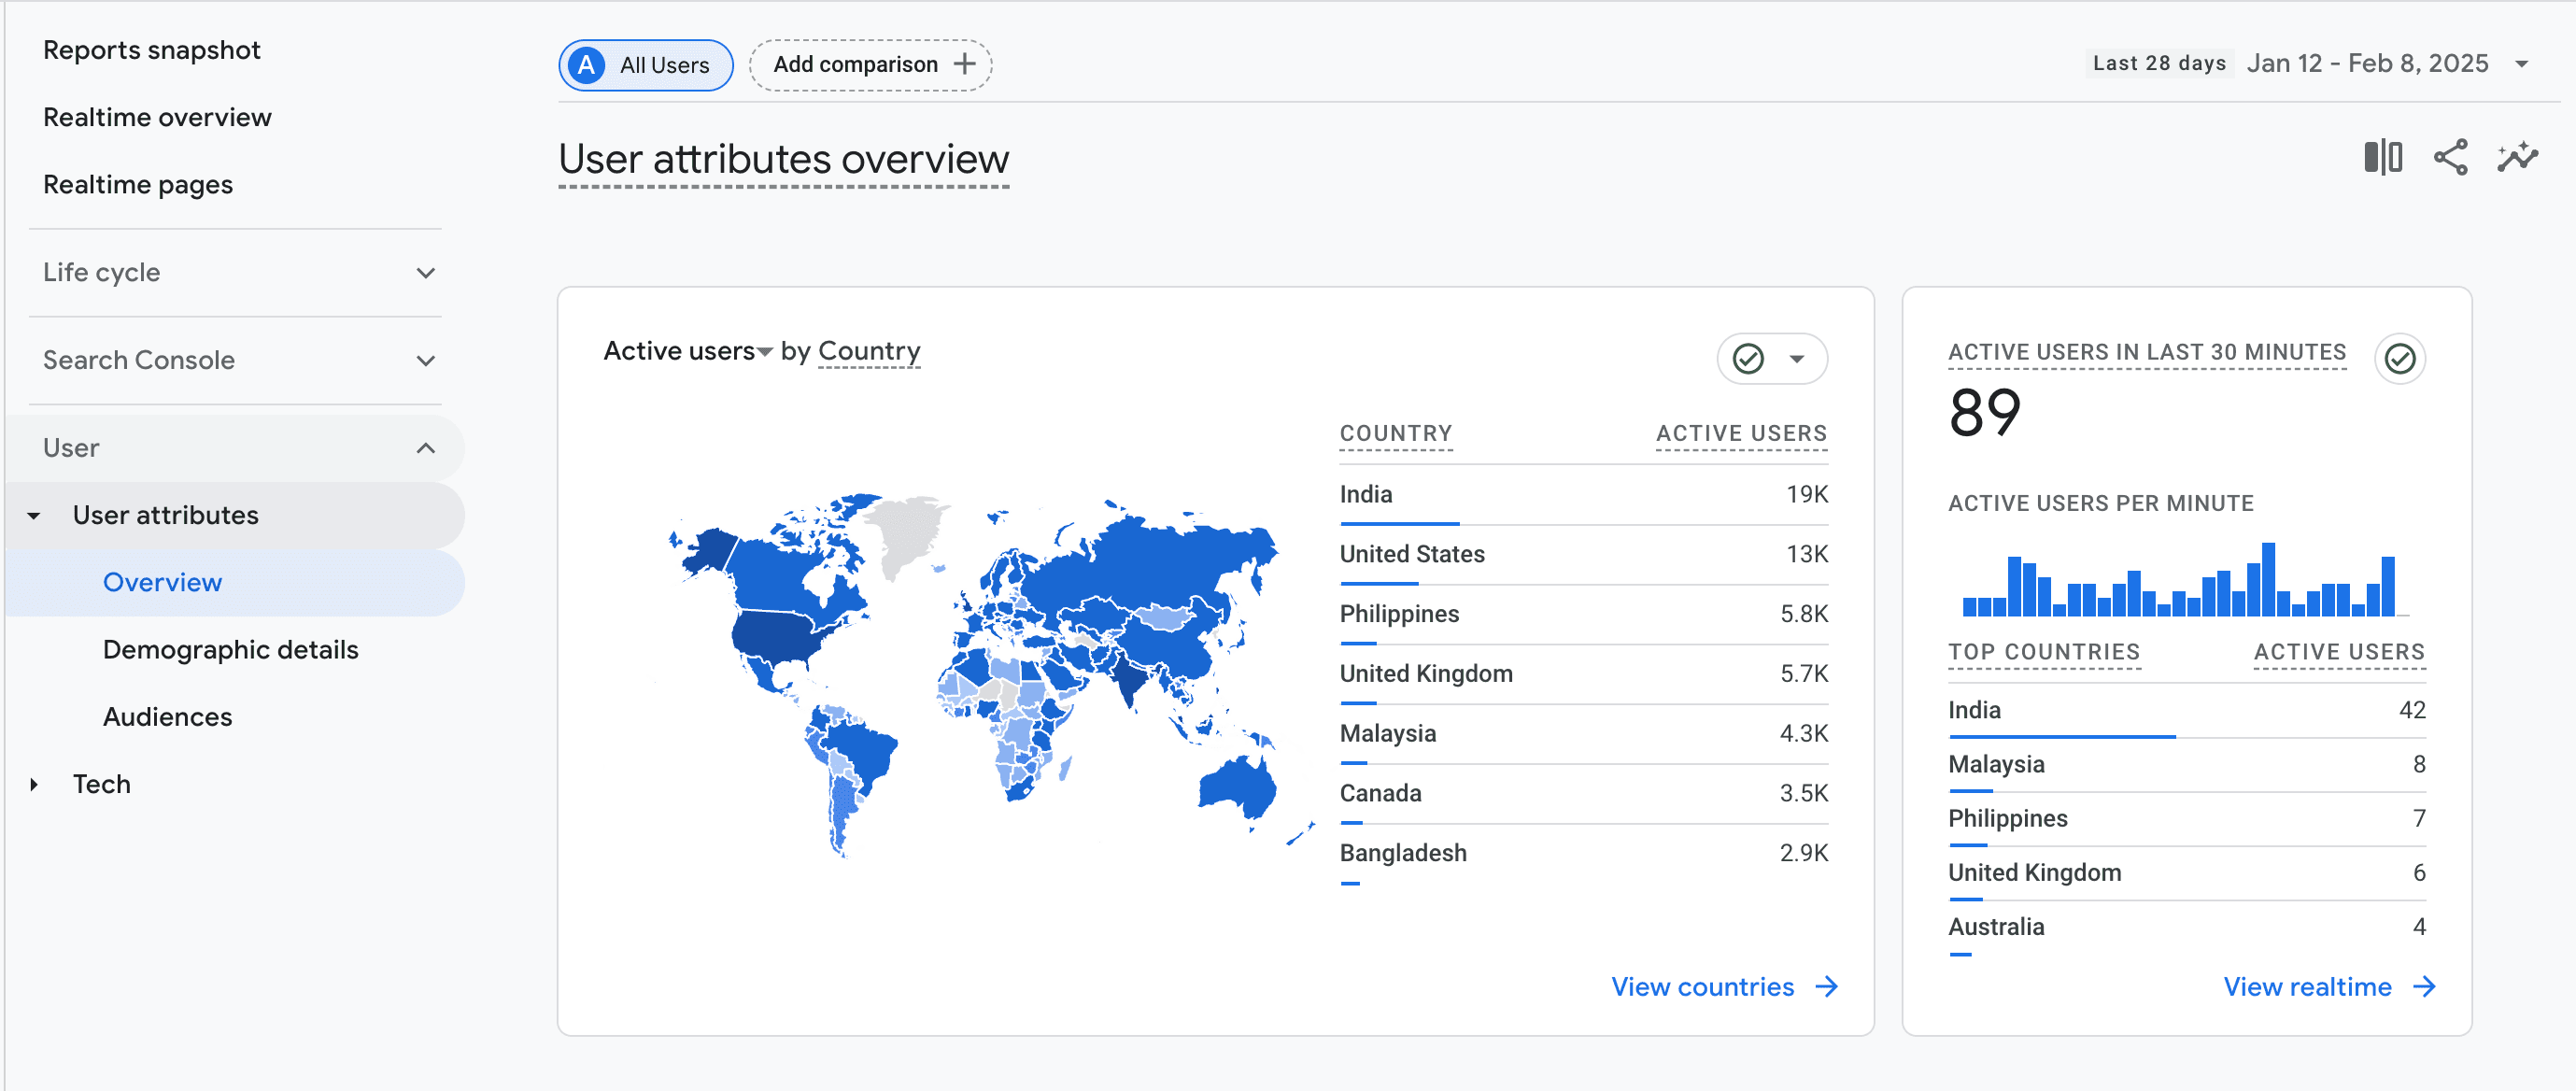
User attributes reports
- Overview report: This report offers a high-level overview of user demographics, allowing you to segment audiences by age, gender, interests, and other attributes.
- Demographic details report: This breaks down users by location, language, and other demographic factors, giving you a bigger picture of your audience composition.

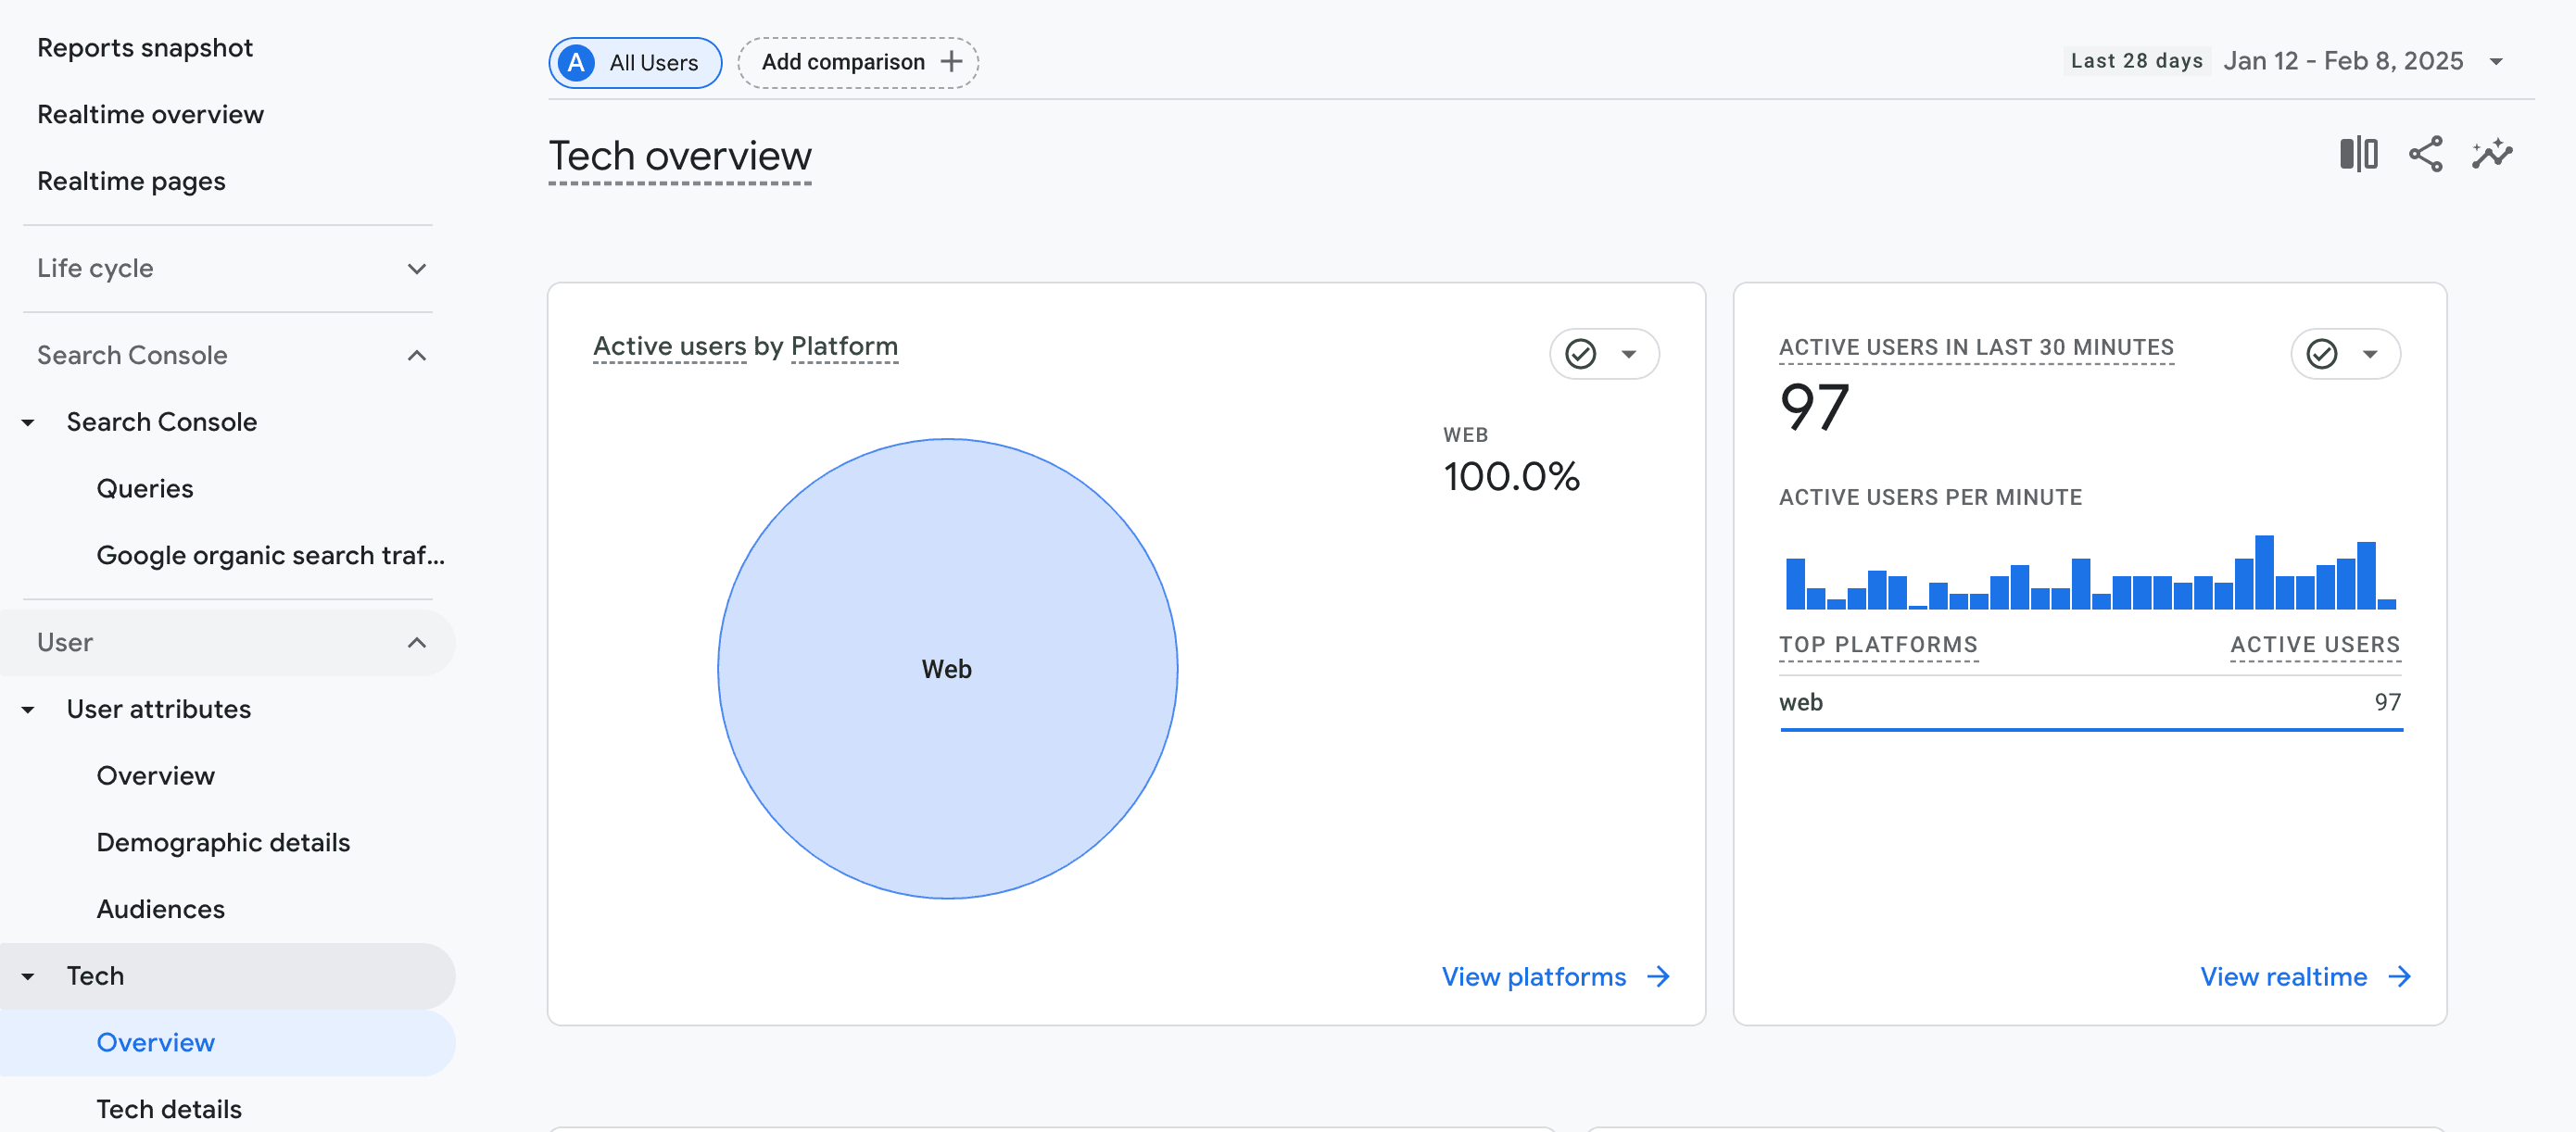
Tech reports
- Overview report: This report summarizes the technology your users rely on, including device type, operating system, and browser.
- Tech details report: This report provides a deeper dive into user technology preferences, helping you optimize your site or app for different platforms and devices.

Additional reporting sections
GA4 also includes specialized reports based on integrations or specific use cases, such as:
1) Search Console reports: when integrated with Google Search Console, it provides insights into organic search performance, including queries, impressions, and clicks.
2) App developer reports track app engagement, crashes, and performance metrics.
3) Games reporting includes tailored reports for game developers, such as:
- Acquisition report: Tracks how players discover your game and which channels drive the most traffic.
- Retention report: Measures how well you retain players over time.
- Engagement report: Analyzes gameplay behaviors, session durations, and interactions.
- Monetization report: Tracks in-game purchases, ad revenue, and other monetization strategies.
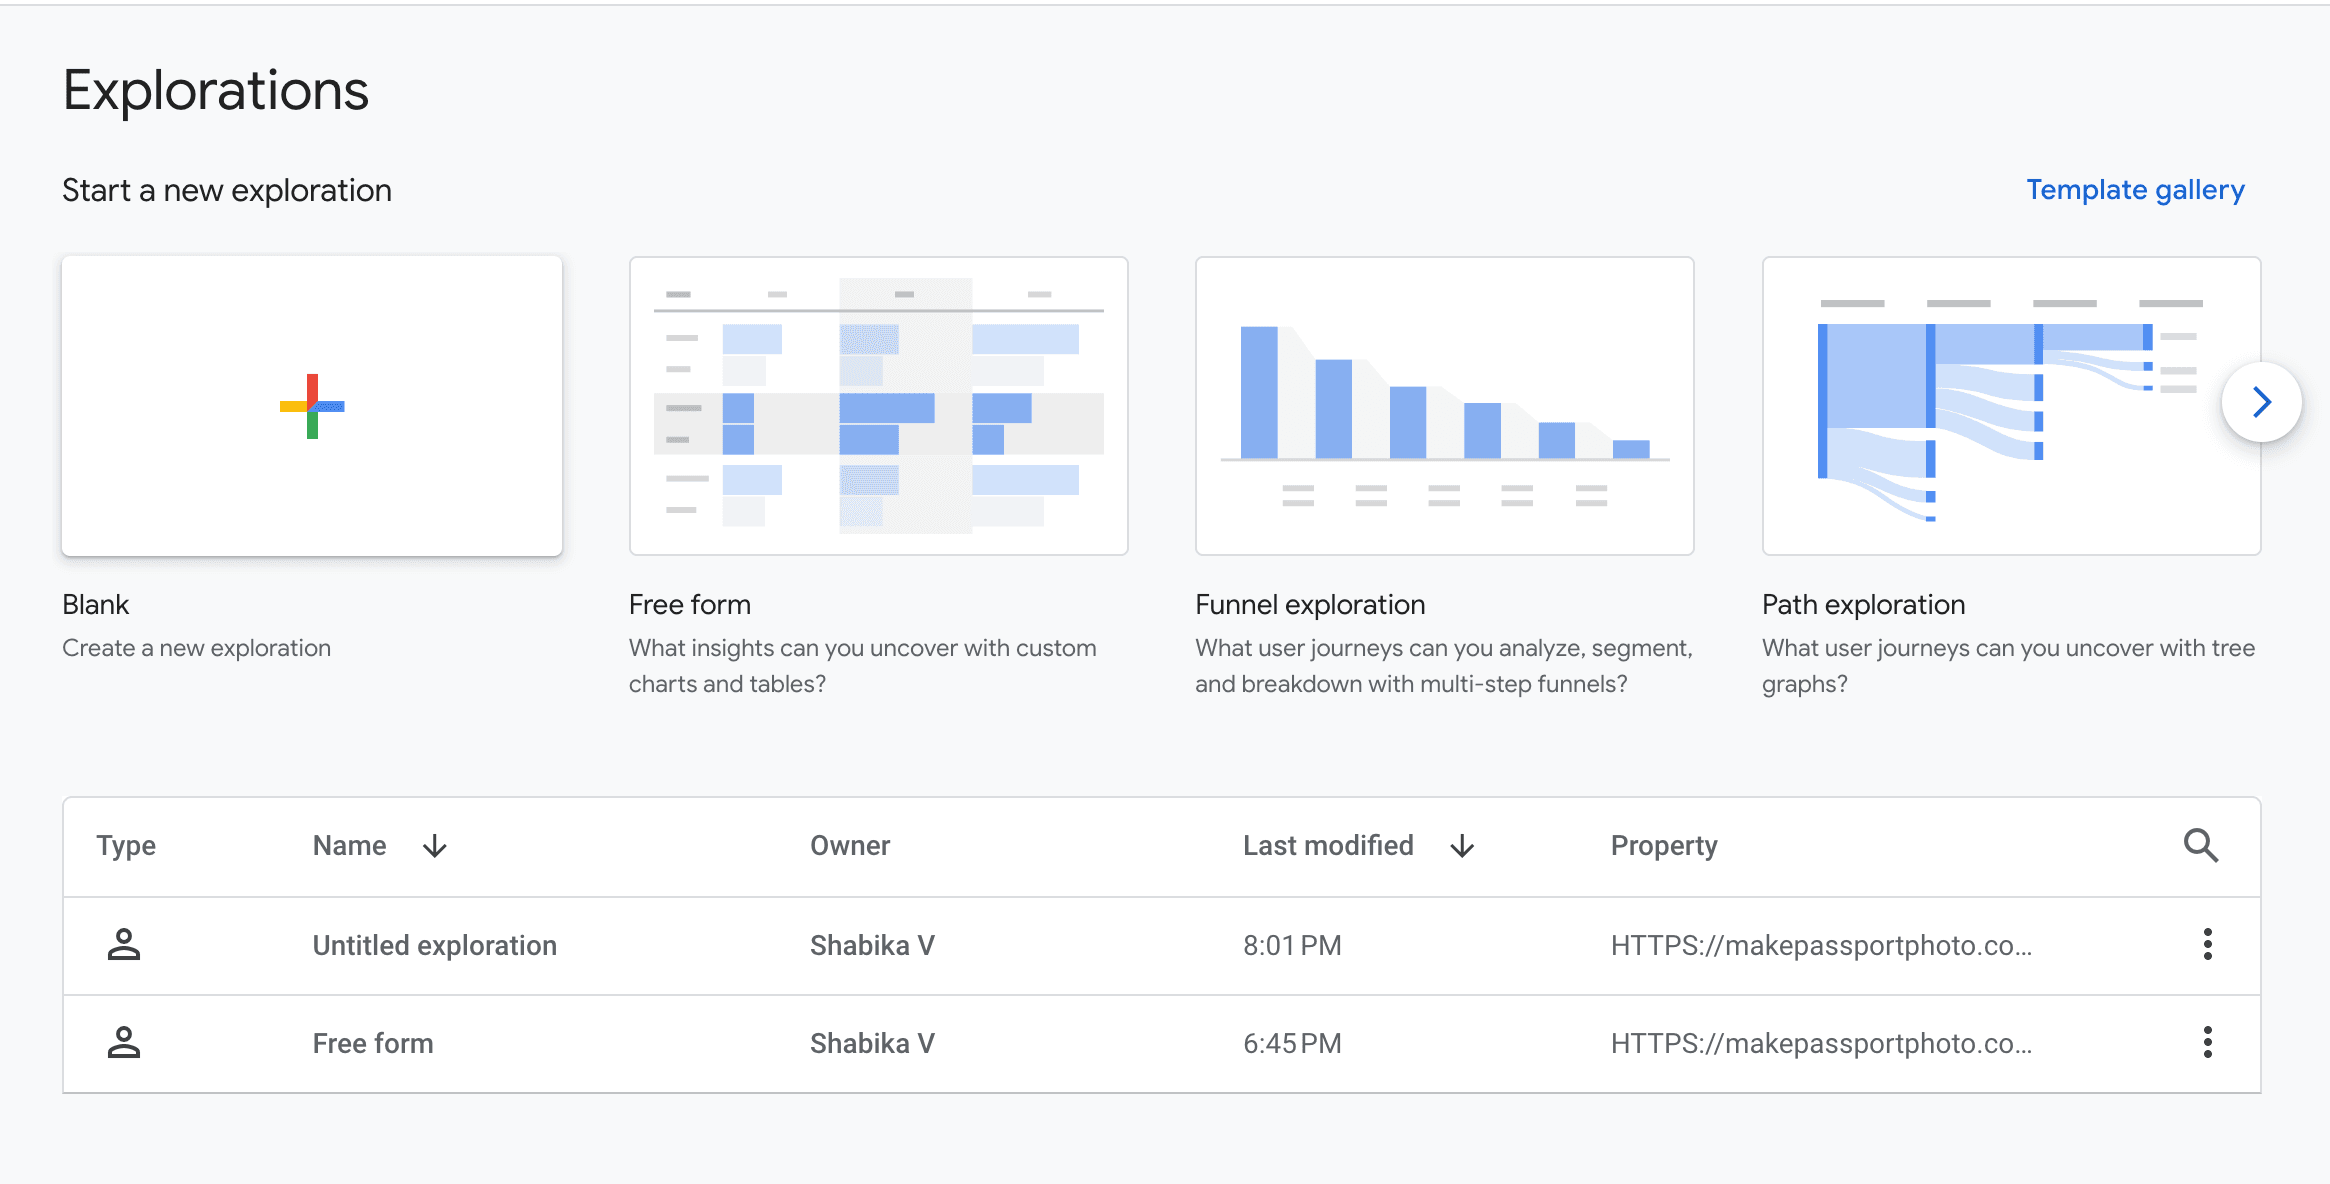
Exploration
GA4 allows you to customize data analysis through Exploration Reports—a feature that provides deeper numerical and visual actionable insights. Let’s explore how GA4’s Exploration Reports can take your analytics to the next level.
Unlike pre-built reports, Explorations allows you to personalize, tweak, and visualize data to fit your business needs. Whether you want to track user journeys, segment audiences, or analyze conversions, GA4 Exploration reports allow you to uncover complex patterns and opportunities.
Here, you can:
- Dive deeper into your data for detailed GA4 analytics
- Use GA4 data filters and segments to refine and find the most relevant data
- Build custom audiences for targeted analysis
- Track email campaigns and monitor traffic sources
- Share insights and reports with other GA4 users
With drag-and-drop functionality, pre-built templates, and advanced filters, GA4 Explorations allows marketers to dig deeper into what drives traffic, engagement, and revenue. It gives you the power to monitor and analyze data your way, making it easier to tweak and implement marketing campaign strategies for better performance and outcomes.

Explorations come with the following limits:
1) Each user can create up to 200 individual explorations per property
2) A maximum of 500 shared explorations can be created per property
3) You can apply up to 10 segments per exploration
4) Each tab allows up to 10 filters for refined data analysis
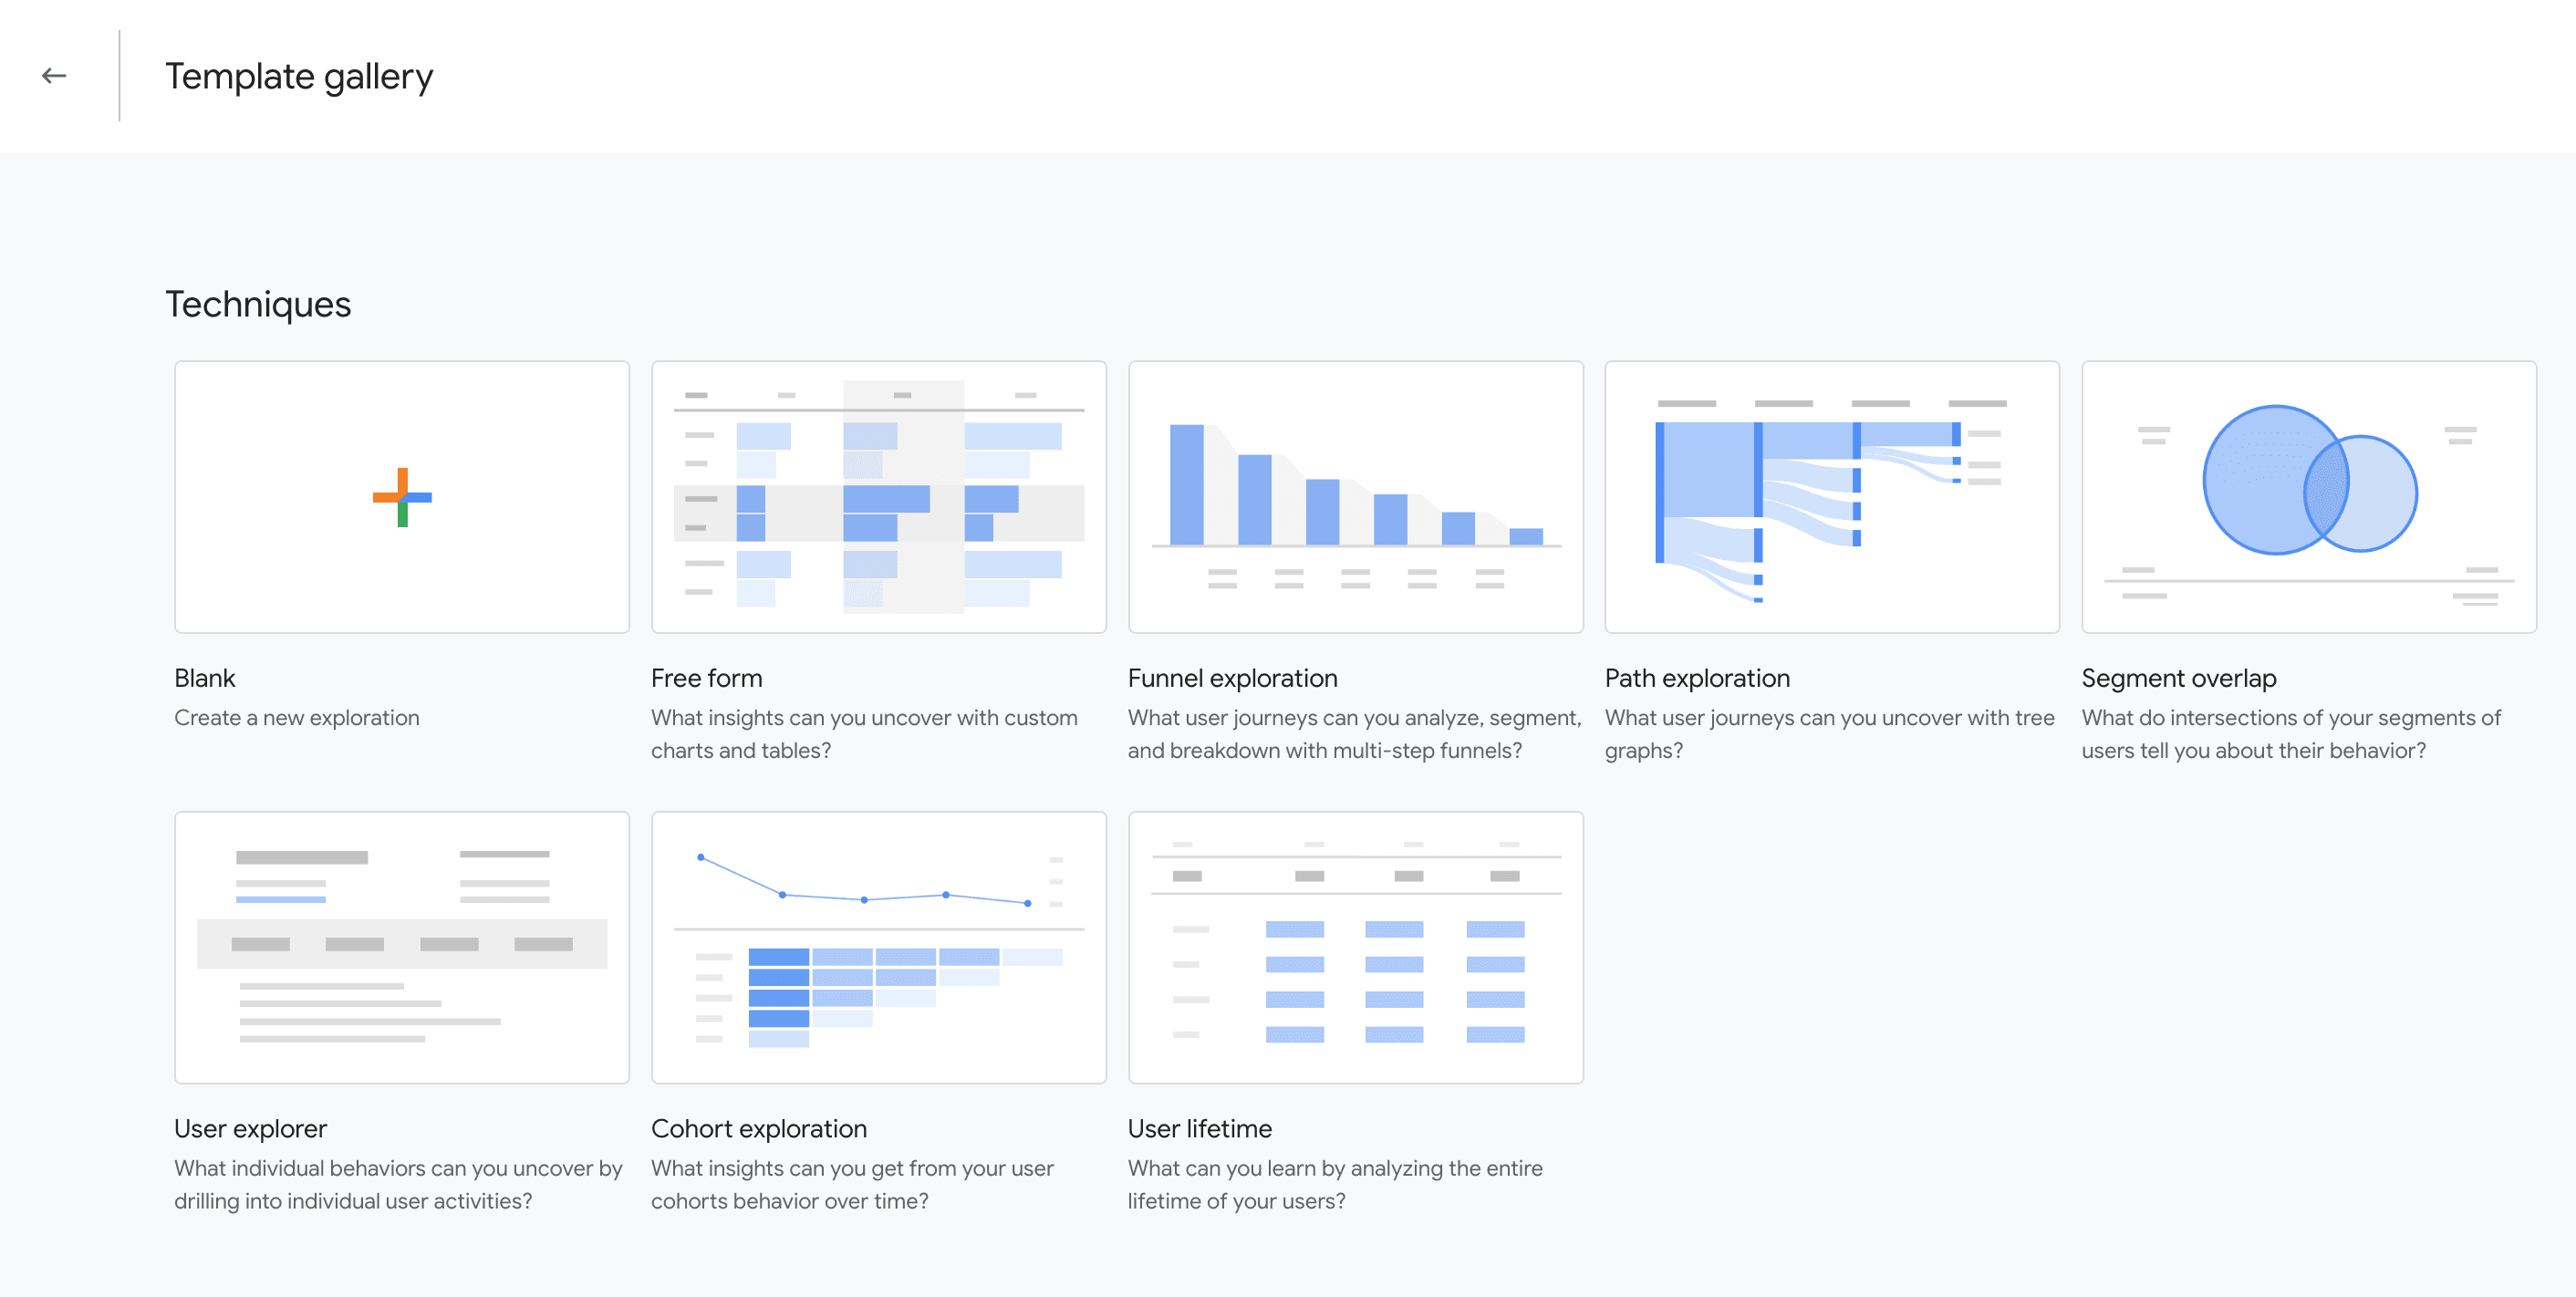
Template gallery in GA4 Explorations
The Template Gallery in GA4 Explorations makes advanced data analysis easier by offering pre-built templates tailored for three different types of reporting insights: Techniques, Use cases, and Industries reports. Instead of starting from scratch, you can select a template that aligns with your reporting needs and customize it to fit your goals.
What’s inside the Template gallery?
GA4 provides several ready-to-use templates, each designed for specific analysis:
- Funnel exploration: Understand how users navigate your website or app and where they lose interest.
- Path exploration: Visualize user journeys and see users’ steps before converting or exiting.
- Segment overlap: Compare multiple user segments to identify shared behaviors and unique characteristics.
- Cohort exploration: Track user retention and engagement trends over time.
- User explorer: Analyze individual user interactions for a detailed understanding of behavior.
- Free-form exploration: Build a fully custom personalized report using a drag-and-drop interface for broad analysis.

Why use the Template gallery?
1) Saves you a lot of time: Get started with structured reports by taking out the hassle of building one from scratch and making more time for data-driven business decisions.
2) Guides your analysis: Each template is built for a specific use case, helping you focus on key insights.
3) Customizable: You can modify filters, dimensions, and metrics per your business requirements.
You can also explore Two Minute Reports’ GA4 templates for more comprehensive analytics. These pre-built, ready-to-use templates help you manage multiple client reports in a single dashboard, get a visualized overview of all campaign insights at a glance, and seamlessly narrate the story of your never-ending successful marketing efforts.
What are the essential metrics and KPIs to track in GA4?
GA4 introduces a dynamic, event-driven approach to tracking, allowing you to capture granular insights into user behavior and website performance. Understanding these metrics will help you fine-tune your strategic framework and optimize UI for better conversions.
The GA4 metrics and KPIs you track and analyze depend on your organizational needs and business aspects. Although each campaign may set different marketing goals and objectives, some universally relevant metrics provide valuable insights to every marketer.
Here are the common key KPIs and metrics you should consider when tracking your campaigns in GA4:
1. User engagement metrics
- Engagement rate – The percentage of engaged sessions where users interact meaningfully (e.g., scrolling, clicking, or spending over 10 seconds).
- Average engagement time per session – Measures how long users stay engaged with your content.
- Bounce rate – The percentage of sessions where users leave without engaging or exploring your website further.
- Event count – The number of specific actions users take, such as clicks, downloads, or video plays.
- Pageviews per session – Shows how many pages a user visits per session, indicating content depth.
2. Acquisition & traffic metrics
- Sessions by Channel – Breaks down organic, paid, social, and direct traffic sources.
- New vs. returning users – Helps analyze customer retention and acquisition trends.
- Traffic source – Shows where your visitors originate (Google Search, Facebook Ads, referral links, etc.).
- User acquisition report – Identifies which sources bring in first-time visitors.
- Traffic acquisition report – Tracks how users continue engaging with your site over time.
3. Conversion & goal metrics
- Conversion rate – The percentage of sessions that complete a predefined goal, such as sign-ups or purchases.
- Event-based conversions – GA4 uses events instead of goals to track actions like purchases, downloads, and form submissions.
- Revenue (Ecommerce or Ads) – Total revenue generated from online purchases or ad conversions.
- Average Order Value (AOV) – Helps understand customer spending behavior by offering insights into customer purchase patterns.
- Checkout Funnel analysis – Identifies drop-off points in the purchase process.
4. User behavior & content performance
- Most engaged pages – Highlights high-performing content based on user interactions.
- Scroll depth tracking – Measures how far users scroll down a page.
- Exit rate – Shows which pages users leave from the most, helping identify content gaps.
- User retention rate – Tracks how many users return to your site over time.
5. Monetization metrics (For Ecommerce & apps)
- Ecommerce purchases – Tracks transaction details like product sales and revenue.
- Purchase journey analysis – Identifies where users drop off before buying.
- In-App purchase revenue – Monitors purchases made within mobile apps.
- Subscription revenue – Tracks recurring revenue from subscriptions.
You can view the complete list of metrics supported by Two Minute Reports here.
Limitations of native GA4 reporting
Setting up a Google Analytics account is entirely free and highly recommended for tracking and refining your strategic initiatives. Its comprehensive platform supports website and app analytics, helping you enhance a customer’s journey by optimizing user experience.
However, many marketers overlook its potential as a reporting solution because of its built-in limitations. These native limitations make it challenging to navigate, narrate your business development strategies, or visualize your report the way you want. In brief:
- Limited customization – With few customization options, GA4 lacks flexibility in modifying reports to align with your business needs.
- Lack of pre-built templates – Although GA4 offers seven exploration report templates, it provides confined information and is time-consuming to create a preferable report template.
- Cumbersome manual report builder – Building new reports from scratch can be tedious and requires a deeper understanding of GA4’s unique structure.
- Basic visualizations – The native reporting interface offers minimal visual techniques, making blending data from multiple sources harder, adding new metrics, and presenting data more engagingly.
- Manual data sharing – GA4 doesn’t provide seamless, automated report distribution. Here, you need to share the interactive dashboard through links with your clients and manage to view and gain insights themselves.
- Data overload and complexity – While GA4 is data-rich, extracting relevant metrics from vast datasets can be overwhelming, making it harder to derive actionable insights.
- Steep learning curve – The event-based tracking model is complex, making it difficult for non-technical marketers to analyze user behavior effectively.
- Lack of historical continuity – Since GA4 does not natively integrate with Universal Analytics, comparing past data and identifying trends requires additional manual adjustments.
- Limited automation – Without third-party tools, automating report generation and delivery can be inefficient and prone to inaccuracies.
- Fewer pre-built reports – Agreed that GA4 offers a handful of default reports, but they aren’t enough, forcing marketers to rely on external solutions for advanced reporting and analysis.
7 Common GA4 reporting mistakes
Avoid these common mistakes to unlock GA4’s full potential and gain more accurate, actionable insights from your analytics data.
1. Not defining key events and conversions
A major mistake GA4 users make is failing to configure key events and conversions. Since GA4 uses an event-based model, tracking meaningful interactions like form submissions, purchases, and sign-ups is crucial. Without defining these properly, you might miss out on actionable insights about user behavior.
2. Relying solely on default reports
Many marketers fail to leverage Explorations, which offer deeper insights into user journeys, path analysis, and segment overlaps. Their dependence on Standard reports limits their ability to analyze user behavior comprehensively.
3. Missing out on the Data Retention Settings
By default, GA4 has a limited data retention period of two months unless changed. To back up your valuable historical data, you must extend it to 14 months in the setting. Losing historical data can impact long-term analysis by failing to identify trends, make year-over-year comparisons, and build audiences.
4. Overlooking traffic source accuracy
Of course, GA4 automatically assigns traffic sources, but if your campaign URLs aren’t tagged correctly, visits might be miscalculated and misclassified under "Direct" or "Unassigned".
Pro tip: Always use consistent and accurate UTM tracking code for your marketing campaigns to avoid inaccurate traffic sources reporting.
5. Failing to link GA4 with various other Google Tools
If you’re running paid campaigns, integrating GA4 with Google Ads, Google Search Console, Google Ad Manager, or Google Merchant Centre is essential for tracking conversions, audience performance, and ad attribution. Skipping this step leads to fragmented data.
6. Neglecting cross-domain tracking
Cross-domain tracking helps you generate a detailed collective report if your business has multiple domains or subdomains. This setup prevents users from being counted as new visitors when navigating between domains.
7. Forgetting to regularly audit the GA4 setup
GA4 is constantly evolving, and so is your business. When failing to conduct periodic audits of your event tracking, conversions, or data settings, you are prone to generate inaccurate GA4 reports. So mark it in your calendars to regularly review and update your GA4 setup to collect and analyze the relevant metrics and KPIs.
Conclusion
Now that you have grasped the basics of GA4, it’s time to unlock its full potential. As a marketer, GA4 is an essential resource for marketers to track user behavior, monitor website performance, and measure traffic and engagement across the website and mobile apps—-all for free.
However, mastering GA4 takes a lot of time, especially when you decide to extract and share reports manually. It’s hardly suitable for client reporting. It’s a nightmare to deal with clients reporting at the last minute. You'll never manage it efficiently and productively without a third-party tool.
Why settle for less when you can make the most out of the generous GA4 tool?
Simplify GA4 reporting using Two Minute Reports (TMR), a user-friendly interface that speeds up your reporting process. Communicate key insights and revised strategic approaches, demonstrate your marketing efforts, streamline your report delivery, and build trust and relationships while overcoming GA4’s reporting limitations.
Frequently Asked Questions
GA4 categorizes events into four types: automatically collected events, enhanced measurement events, recommended events, and custom events.
The "Acquisition" and "Events" reports in GA4 are the most valuable. The Acquisition report reveals how users discover your website through various marketing channels, while the Events report offers detailed insights into user behavior.
In GA4, the Reports section offers a structured overview with pre-defined metrics and dimensions, while the Explore section allows for more customized analysis, providing deeper insights into user behavior. For instance, some dimensions and metrics present in reports may not be available in explorations.
Yes, GA4 is a free tool.
GA4 may initially seem complex, but with practice and familiarity, users can quickly learn its features and implement effective event-based strategies.
To create a detailed report in GA4:
- Go to Reports > Library > Create a new report.
- Select ‘Create a detailed report.’
- Choose Blank for a custom report, or select a template.
- Customize the report using the Customize report panel
- Save the report and access it anytime from your Library.
While GA4 lacks built-in automation for generating reports, its flexible export options and integrations can provide real-time insights. Consider using third-party tools like Two Minute Reports to connect GA4 with Google Sheets and Looker Studio for automated data extraction, ensuring you have the latest and most accurate real-time insights.
Each Google Analytics property, a grouping of data from a website or app, can have up to 150 custom reports. As an editor or administrator, you can customize detailed reports to show the data that matters most. If you want to customize an overview report, see "Customize overview reports" and "Reports snapshot."
Related Blogs


Meet the Author
Shabika VenkidachalamShabika, at her core, is a storyteller who believes even data-heavy topics can be infused with heart. At Two Minute Reports, she blends creative writing with user intent to create clear, purposeful content that is deeply human. Away from her desk, she finds inspiration in nature, where creativity flourishes without distractions.
