
Summarize this blog post with:
LinkedIn is the most trusted professional network, with over 1 billion active users globally. It is one of the best social media platforms for B2B marketers to prospect high-quality leads.
By targeting decision-makers and stakeholders, and key executives, you can connect with the right people, build a loyal community, and maximize your online impact.
So, if you’re considering LinkedIn as one of the advertising channels, you’ve made the right decision.
However, to gauge meaningful campaign insights, you must track the right LinkedIn Ads metrics. This will give you a clear idea of the nuances, the insights, and the next opportunities to maximize your advertising efficiency.
How do you get started? That’s precisely what this blog aims to answer. We’ll explore the 20 crucial LinkedIn Ads metrics that you should focus on while running your LinkedIn ad campaigns. We’ve also shared actionable tips and insights on optimizing your (client’s) LinkedIn Ads reporting.
Let’s get started.
What are LinkedIn Ads Metrics?
LinkedIn Ads metrics are data points that track the performance of your advertising campaigns. They enable you to measure everything from how many people see your ad to how effectively those impressions turn into valuable actions, such as leads or sales.
For marketers and agency leaders, these metrics aren’t just numbers. They are real-time insights that show whether the LinkedIn advertising strategy is working or if adjustments are needed.
The key is to focus on metrics that:
- Directly relate to your business goals.
- Offer actionable insights for real-time optimization.
- Provide valuable context over time.
For example, CTR shows how many people engage with your ad. However, to understand your ad’s effectiveness, you might consider pairing it with the conversion rate, which indicates how many clicks actually result in sales. Remember that the best metrics work together to tell the full story of your campaign success.
Why is Measuring LinkedIn Ads Metrics Important?
LinkedIn Ads are essential for reaching key decision makers, but to truly maximize your campaigns, measuring the right LinkedIn Ads metrics is crucial. Here’s why:
1. Understand what’s working
Track campaign performance to ensure you’re on the right path.
- CTR: How engaging is your LinkedIn ad?
- CPC: Are you using your ad budget efficiently?
- Conversion rate: Are you turning clicks into business outcomes?
Use Case: A high CTR but low conversions? Your landing page or CTA might need refinement to drive more qualified leads.
2. Optimize campaigns in real-time
Adjust bids, targeting, and ad creatives in real-time for better ROI.
- Bid adjustments: Fine-tune your budget allocation based on campaign performance.
- Audience segmentation: Focus on the most responsive audiences for higher conversion rates.
Use Case: If certain job titles are performing better, refine your targeting to reach those segments more effectively.
3. Align ad spend with goals
Ensure your ad budget supports your business objectives.
- CPL: Optimize for a lower cost per lead to increase efficiency
- ROAS: Measure revenue generated for every dollar spent.
Use Case: If your ROAS is low, reallocate budget or refine your targeting to focus on high-performing segments.
4. Improve ad creative and messaging
Tailor your creatives and messaging based on data to resonate with your audience’s needs.
- Engagement rate: Are your ads sparking interaction and engagement?
- Video views: Are your video ads capturing attention effectively?
Use Case: If video ads outperform static images for brand awareness, invest more in video to increase visibility and audience engagement.
5. Insights for long-term strategy
Track metrics to shape your long-term strategy and ensure sustained growth.
- LTV: Measure customer lifetime value to determine the worth of your leads over time.
- Brand Awareness: Track how well your ads are increasing brand recognition.
Use Case: Use brand recognition metrics to justify ad spend, even if direct conversions are slow.
Key Takeaways:
- Track metrics to make data-driven improvements.
- Make real-time updates to enhance campaign performance.
- Focus on ROI to maximize your ad spend.
Top 20 LinkedIn Ads Metrics to Track
In this section, let’s explore the different LinkedIn Ads metrics based on the following metric categories available in the campaign manager dashboard:
- Performance metrics
- Engagement metrics
- Delivery metrics
- Sponsored messaging metrics
Now, let’s explore the most significant LinkedIn ads metrics under each category and their importance in optimizing your LinkedIn ad performance.
Performance Metrics
Performance metrics indicate how well your campaigns are performing and the effectiveness in accomplishing the desired goal.
1. Amount Spent
What it is: The total amount you’ve spent on your LinkedIn ad campaign. This is the key LinkedIn ad metric for calculating other cost-based metrics like CPC, CPM, and cost per conversion.
Why it matters: Knowing how much you’ve spent helps you assess your budget efficiency and guides optimization decisions. Instead of blindly increasing spend, you can strategically allocate resources to maximize campaign results.
The bidding strategy you select will decide your cost for each result. Here’s how:
- Maximum delivery bidding is an automated bidding strategy designed to enhance your campaign results by utilizing the full budget.
- Manual bidding gives you complete control over setting bids for your campaign.
- Cost cap bidding lets you set the maximum cost per action you’re willing to pay, preventing you from overspending.
Note: LinkedIn recommends a $25 budget for new advertisers and $50-100 for existing ones.
2. Total Conversion Value
What it is: Refers to the total value generated by your conversions. In simple terms, this metric tells you the revenue generated from your ads based on people’s actions.
How is it calculated: Value per conversion x number of conversions.
If your product is worth $50 and 10 people purchase it, then the total conversion value will be $500 ($50 x 10).
Why it matters: When your client asks, “What is the average value you assign for each conversion generated by your ad campaign?” total conversion value will be your go-to metric. You can garner insights into whether you get the expected profits, have set the right pricing targets, and identify which strategies deliver the most value, enabling you to focus on what works best.
Pro Tip: Set realistic financial goals by analyzing your past conversion value to optimize profits for your future campaigns.
3. Cost Per Lead
What it is: The total cost incurred to generate one lead from your campaign. Around 89% of marketers use LinkedIn for effective lead generation.
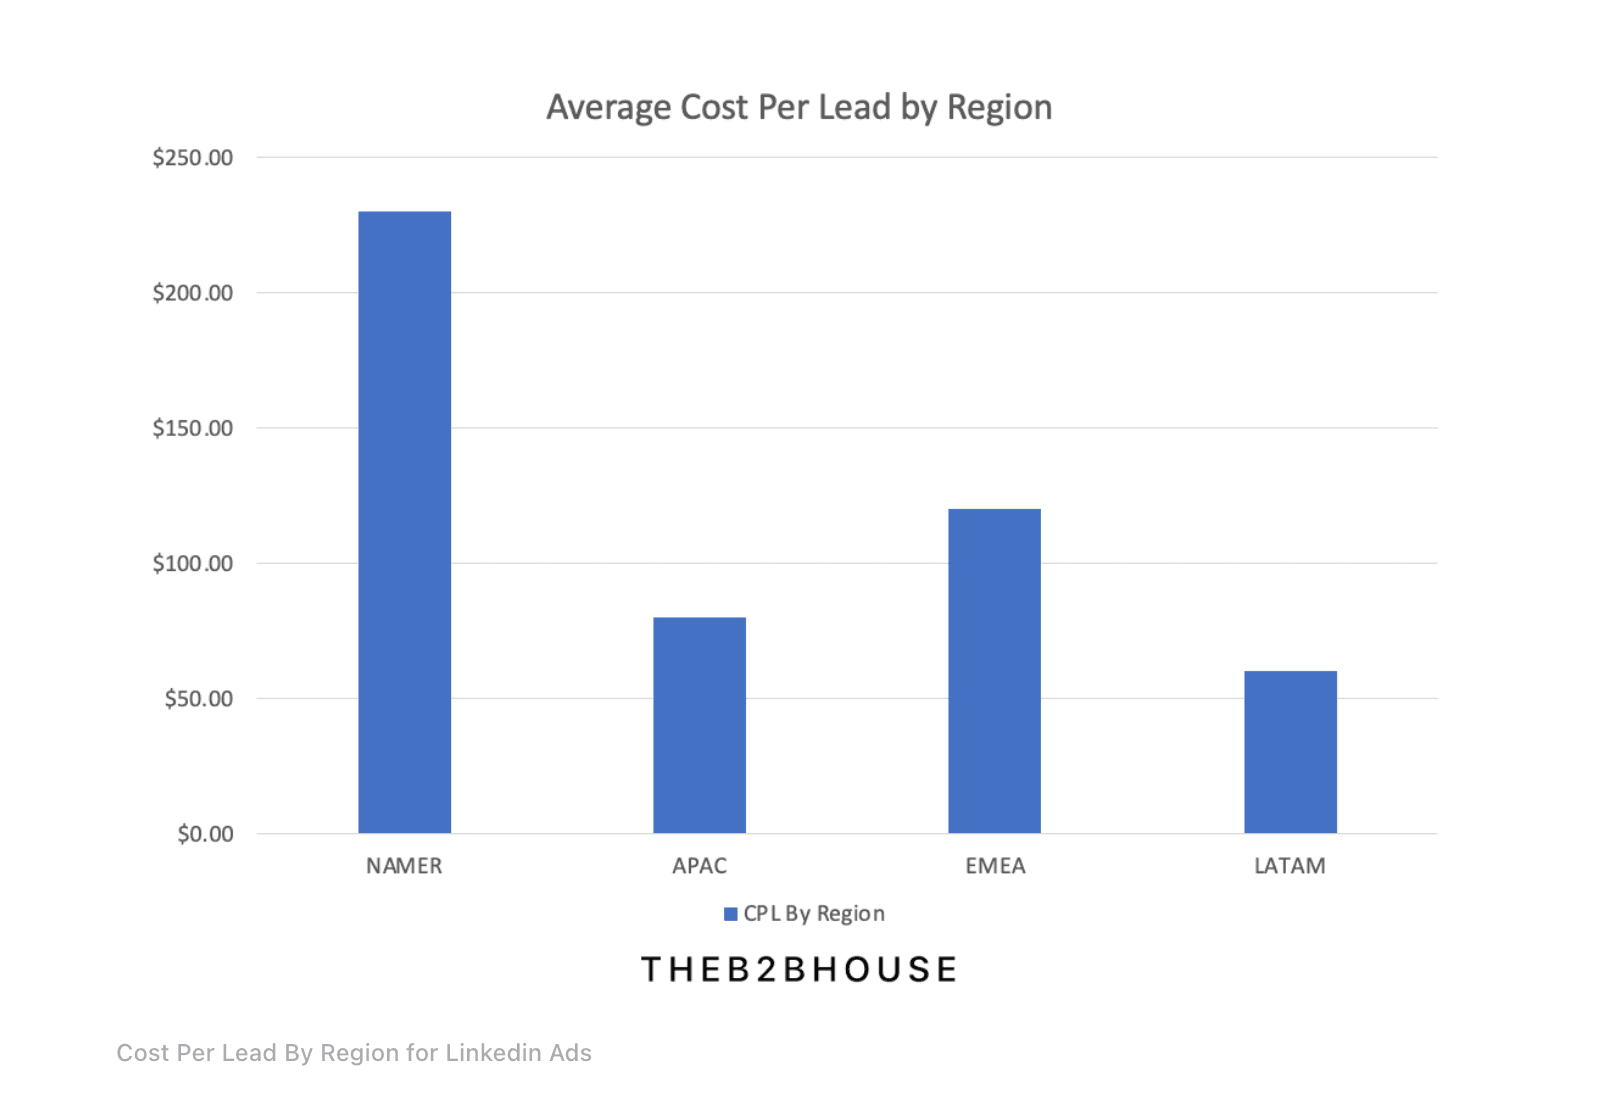
 Image Source: TheB2BHOUSE
How is it calculated: CPL = Total amount spent/Number of leads generated
Consider that your campaign has generated 50 leads by spending $500. Then your CPL will be $10, i.e., you’ve spent $10 for each lead collected.
Why it matters: A higher CPL indicates that you need to optimize your lead targeting strategy, whereas a lower CPL garners interested prospects who are eligible to become paid customers. By analyzing CPL closely, you can identify the number of leads required to achieve sales targets, manage pipelines, and allocate the best resources that yield better outcomes.
4. Event Registrations
What it is: Total number of member accounts that successfully registered for your LinkedIn event after viewing or clicking your ad.
Why it matters: By tracking the registration count, you’ll understand how your ad copy, visuals, and targeting strategy have convinced your prospects to sign up for the event. Besides, knowing who registered for your event gives deeper insights into the audience demographics and behavioral insights used to improve your future campaigns.
Pro Tip: Gather data on link clicks, monitor the number of completed registrations, and calculate the conversion rate to evaluate the effectiveness of your LinkedIn Event Registrations.
5. Cost Per Conversion
What it is: Refers to the average amount you spend on each conversion.
How is it calculated: Cost Per Conversion = Total ad spent/Number of conversions
Why it matters: Cost Per Conversion impacts your campaign’s financial goals. A higher cost per conversion also contributes to a higher CAC (customer acquisition costs), increasing the total cost associated with acquiring customers. In contrast, a lower cost per conversion signals that your campaigns accomplish the desired goals.
The costs associated with acquiring conversions are directly proportional to your campaign’s ROI. Ensure that the costs are minimal (within the given budget) to deliver profits to your clients and stakeholders.
6. ROAS
What it is: The revenue generated based on the ad spending efficiency. Simply put, the revenue generated for every dollar spent on your campaign.
How is it calculated: ROAS = Revenue generated/Cost of advertising
Why it matters: ROAS signals whether your campaign efficiency, budget allocation, and targeting efforts generate the desired profits. However, a good ROAS depends on several factors: industry, specific business model, ad strategy, and margins. So, it's worthwhile to consider unique circumstances before setting ROAS targets.
Overall, measuring ROAS is equally important for your campaign analysis, as it will show clients that your strategies effectively delivered the expected results.
Pro Tip: Track everything that matters – from clicks and leads to CPL, CTR, and conversions with our LinkedIn Ads reporting template. Easily monitor campaign performance and optimize in real-time to drive better outcomes.
Here's a brief overview:
Engagement Metrics
Engagement metrics tell you how effectively your ad campaigns capture the audience’s interest. Here are the engagement rate benchmarks for LinkedIn:
- Non-video sponsored content – 0.5%
- Video sponsored content – 1.6%
7. Average Dwell Time
What it is: Refers to the duration your audience spends interacting with your ad campaign. According to LinkedIn, it is the time spent viewing the ad when at least 50% of your pixels are on the screen. This metric also includes duplicate views.
Why it matters: Longer dwell times indicate that your audiences find your ad content interesting and relevant, whereas a lower dwell time suggests improvement. With this metric, you can strategically analyze the optimal ad placements, creatives, headlines, call-to-actions, etc, that drive maximum engagement and refine the content ideation accordingly.
Note: For the LinkedIn Audience Network, the average dwell time is measured on a sample of impressions where viewability signals are available. There may be certain circumstances where it doesn’t represent your campaign’s entire delivery.
8. Average CTR
What it is: The number of visitors who clicked your ad after viewing it.
How is it calculated: CTR = (Number of clicks/Impressions) x 100
Why it matters: Average CTR is a key LinkedIn ads metric that measures how effectively your ad persuades prospects to move to the next stage of the funnel. A higher CTR signals that your audience is interested in your offer and wants to explore more about it. Conversely, a poor CTR results from your audience’s disengagement, which might be due to irrelevant targeting, weak ad copy, unattractive visuals, high competition, etc.
Identifying and addressing these factors can help improve your ad engagement and enhance the overall campaign experience.
9. Total Social Actions
What it is: Refers to the cumulative social engagement your LinkedIn ad received - reactions, comments, shares, follow clicks, reaction clicks, and other engagements.
Why it matters: In a feed where many businesses compete for attention, your LinkedIn ad stands out if it gains the highest engagement. It reflects how every element in your ad has played a major role in capturing your audience’s never-ending scrolling behavior. Higher engagement signals lower the cost per impression and provide better reach. You can use this behavioral data to analyze the content (and content format) that resonates the most and adjust your future campaigns.
So, pay attention to optimizing your ad copy, design, and targeting capabilities to boost your ad engagement levels.
10. Total Video Engagement
What it is: The sum of all full-screen plays, social actions, clicks to the landing page, and clicks to the LinkedIn page, both paid and organic.
Why it matters: If you run a video ad on LinkedIn, tracking this metric is crucial as it gives valuable insights into how people interact with your video content. A highly engaging video ad fosters interaction, captures attention, and directs users to the required destination, improving traffic and conversion rates. The best part is that it tracks organic and paid engagements, giving holistic insights into how people react to your video.
Pro Tip: Conduct A/B tests with different video formats, thumbnails, messaging, and CTAs to analyze which variation drives the maximum engagement rate. Log all the key changes and choose the winning variant to optimize your video ad performance on LinkedIn.
Here's a brief overview:
Delivery Metrics
Delivery metrics indicate your ad's efficiency in reaching the desired audience on LinkedIn. Let’s have a look at the four key delivery metrics:
| Metric | Description | Usage |
| Reach | The number of unique users who interact with your LinkedIn ad. | Higher reach boosts brand exposure and engagement. |
| Average frequency | The average number of times the same user saw your LinkedIn ad. | |
| Cost per Mile | The cost per 1000 impressions. | Optimize audience targeting for lower CPM costs and better reach. |
| Audience Penetration | The percentage of audiences you reached with a single campaign is divided by the target audience size. | A higher percentage means your ad is effectively reaching the right people. |
Sponsored Messaging Metrics
LinkedIn’s sponsored messaging lets you send targeted ad messages directly to the recipient’s inbox. This is an effective way to get a step closer to building relationships with your interested prospects.
Below is the table containing the important sponsored messaging metrics, which can help you gauge insights about your message and conversational ads.
| Metric | Description | Usage |
| Sends | The number of times LinkedIn delivered your Sponsored Messaging. | Indicates the targeting effectiveness and the delivery rate of your messaging ad. |
| Sponsored Messaging Clicks | The clicks on a CTA button, hyperlinks, and banner. | Illustrates the engagement and the audience’s interest in knowing more about your offer. |
| Click to Open Rate | The percentage of people who click after opening your Sponsored Messaging ad. | Reveals how compellingly your content resonated with the target recipients’s intent. |
| Cost per Send | The amount you pay for each message delivery. i.e., (total spend/total sends) | Minimizing cost per send ensures you achieve maximum visibility and engagement with your recipients. |
| Button Clicks | The number of clicks on your CTA button. | The higher the button clicks, the more the engagement. |
| Cost per Open | The costs incurred each time your recipient opens your ad message. i.e., (total spend/total opens) | A lower cost per open means you're spending less to get recipients to engage, making your ad budget more efficient. |
How Often Should I Track the LinkedIn Ads Metrics?
Quick Insight: Track metrics consistently to identify issues early, without overreacting to minor fluctuations.
For most LinkedIn Ads campaigns, the following approach works:
- Daily: Metrics tied to active campaigns such as CTR, CPL, conversion rate and ad spend.
- Weekly: Focus on audience reach, frequency, engagement rate, and cost per impression. Weekly tracking helps you spot trends early and make adjustments to improve performance.
- Monthly: Total Conversion Value, ROAS, Audience Penetration, and Cost Per Conversion. These provide insights into your overall campaign effectiveness and help guide future budget allocation and strategy decisions.
- Quarterly: Year-over-Year Growth, Channel Profitability, and Customer Acquisition Cost (if applicable). These are crucial for understanding the broader impact of your LinkedIn Ads on business goals.
With the right LinkedIn Ads dashboard, monitor trends in real time without getting bogged down in campaign data.
LinkedIn Ads Analytics: Interpreting Data for Better Campaign Decisions
Now that you know which metrics to track, it’s time to dig into the analytics and understand what those numbers mean for your campaign’s performance. Here’s how you can use LinkedIn Ads analytics to unlock valuable insights and optimize your campaigns:
- Choose the right attribution model based on your campaign goal for accurate insights.
- Analyze CTR and engagement rate to understand what’s working and what’s not with your ads.
- Track conversion metrics such as CPL and ROAS to measure your campaign effectiveness.
- Refine audience targeting based on performance data to ensure you’re reaching the right people.
- Monitor ad frequency to prevent ad fatigue and keep your audience engaged.
- Track weekly or monthly to identify trends, drop-offs and make adjustments accordingly.
- Blend data from multiple PPC platforms to visualize cross-channel view of your campaign’s performance.
By applying these strategies, you can use LinkedIn Ads analytics to make smarter, more impactful decisions that drive real results. The better you understand your data, the more effectively you can optimize your campaigns for success.
Now that you’ve a clear idea, next, let’s explore how Two Minute Reports can streamline and customize your LinkedIn Ads reporting for actionable insights.
How to Customize your LinkedIn Ads Report using Two Minute Reports?
Tracking LinkedIn Ads KPIs in Campaign Manager can be cumbersome. Manually exporting CSV files, organizing the data, and generating reports can take up valuable time, especially when you need to frequently update reports for multiple clients.
This traditional approach often leads to errors, inconsistent data, and delays in getting actionable insights. Here’s how Two Minute Reports simplifies and streamlines LinkedIn Ads reporting.
- Connect your LinkedIn Ads account directly to your Google Sheets and Looker Studio. No manual copy-pasting required.
- Select from ready-made LinkedIn Ads templates to tailor your campaign dashboards according to your client’s requirements.
- Build custom campaign dashboards to focus on the metrics that matter most.
- Share your branded LinkedIn Ads reports via email, PDF across multiple clients seamlessly.
- Keep your reports up-to-date without manual intervention, ensuring accurate and timely insights.
By using Two Minute Reports, you can streamline your LinkedIn Ads reporting, reduce errors, and customize reports based on your unique needs, leading to more efficient campaign optimization and better results.
Pro Tip: Select from 50+ data points and set how often you want them to refresh – daily, weekly, or monthly.
Top 4 LinkedIn Ads Reporting Templates to Streamline Tracking
In this section, let us explore the top 4 LinkedIn Ads reporting templates that help you centralize and automate campaign performance insights:
1. LinkedIn Ads Comprehensive Insights for different ad types
Track key LinkedIn Ads KPIs, such as impressions, reach, frequency, etc across different stages of your conversion funnel.

2. LinkedIn Ads Overview Report
Showcase top-performing campaigns with a detailed breakdown of ad spend, reach, leads, and conversion outcomes.

3. LinkedIn Ads Account-Based Marketing Report
Track and analyze LinkedIn Ads metrics such as leads, engagement rate, etc for account-based marketing campaigns.

4. LinkedIn Ads Performance Overview Report
Monitor impressions, average CPC, CTR, and campaign performance with detailed date-wise insights for better clarity.

How To Analyze LinkedIn Ads Performance Using Claude?
With Two Minute Reports MCP for Claude, you can connect your LinkedIn Ads data, ask questions in plain English and get answers within seconds. Use simple prompts like:
- Why did my CPL spike last week?
- Which job titles drove the most conversions this month?
- Which campaigns generated the highest and lowest CTR, and why?
Claude pulls the data, runs the analysis, and explains the shift in seconds.
Here’s how to connect (under a minute):
- In Claude, go to Settings → Connectors → Add Custom Connector.
- Paste the TMR MCP URL: https://mcp.twominutereports.com/mcp
- Sign in with your Google Account linked to Two Minute Reports.
That’s it. Query your LinkedIn Ads campaign data and know what’s working and what’s not.
Note: Prefer ChatGPT? Two Minute Reports MCP works there too. Just one quick setup. Connect TMR to ChatGPT.
Track LinkedIn Ads Metrics with Zero Hassle
LinkedIn ads metrics and KPIs reflect your campaign success. By knowing which key LinkedIn ad metrics drive the change, you can identify the intricacies of your best and least-performing campaigns and make proper adjustments to optimize the performance.
What’s the bottom line? Plan your strategy, choose your campaign objective, track key LinkedIn ads metrics, gain practical insights, and optimize your ad performance to deliver the best outcome. Rinse, repeat and evolve.
Ready to take your campaign reporting to the next level? Try Two Minute Reports free for 14 days and create your first LinkedIn Ads report within minutes.
Frequently Asked Questions
LinkedIn ads KPIs are quantitative metrics that measure the performance of your campaigns, providing insights into how effectively you are achieving your marketing goals. By regularly tracking performance, you can identify areas for improvement, optimize strategies, and make informed decisions to enhance engagement and drive growth.
Define the right target audience, organize your ad account structure, develop engaging content, and allocate the best resources by choosing the optimal bidding strategy. Analyze how your campaigns are performing and make strategic adjustments.
Tracking LinkedIn Ads metrics allows you to measure campaign performance, identify areas for improvement, and make data-driven decisions to optimize ad spend and increase ROI.
Install the Two Minute Reports add-on, connect your LinkedIn Ads account to Google Sheets or Looker Studio, and streamline your KPIs in a single dashboard. This gives you full control over analyzing what’s working, what’s not, so that you can make improvements in real-time to optimize campaign performance.
Monitor key metrics, such as ROAS, CTR, and conversion rates. Consistent performance in these areas indicates your ads are meeting their objectives. A decline in any of these metrics signals the need for immediate optimization.
Absolutely. By blending data from LinkedIn Ads, Google Ads, Meta, etc, you can visualize cross-channel performance and assess the overall ROI in a unified dashboard.
Related Blogs


Meet the Author
Shalini MuruganShalini is driven by ideas that create a tangible impact. At Two Minute Reports, she specializes in content that helps marketers optimize their reporting workflows. When she's not transforming complex data into meaningful insights, you might find her lost in a book, jotting down ideas in her notebook, or connecting the dots others overlook.
