
Summarize this blog post with:
The measure of your marketing efforts is the measure of your business’s success. As marketers, we know that launching a campaign is just the beginning—you need to track its performance, measure progress against goals, and analyze what’s working and what isn’t. But spending 16 hours per week compiling reports only to showcase 20% of your marketing impact isn’t the best use of your time. The problem isn’t your effort; it’s the scattered data stealing your focus from actionable insights.
Why juggle with irrelevant data sets, trapping yourself and your clients in the metrics, KPIs, and stats maze?
Effectively communicate your marketing efforts with the help of a marketing KPI dashboard. Simplify the reporting and analytics process, offering high-level insights and real-time overviews. By focusing on essential metrics, you showcase the true impact of your strategies, proving ROI and reinforcing the value of your client’s investments.
What is a marketing KPI dashboard?
A marketing KPI dashboard is a powerful visual tool that organizes data for quick and effective business analysis. With these KPI marketing dashboards, you can align your marketing activities with broader business objectives—whether it’s analyzing campaign performance, measuring customer engagement, or assessing the effectiveness of your strategies.
With marketing budgets shrinking to 7.7% of company revenue, compared to 9.1% in 2023, marketers are under more pressure than ever to make every dollar count. This is where KPI marketing dashboards become even more valuable. They give you clear insights into which strategies are working and where you can improve or adjust your resources, helping you make smarter decisions with a limited budget.
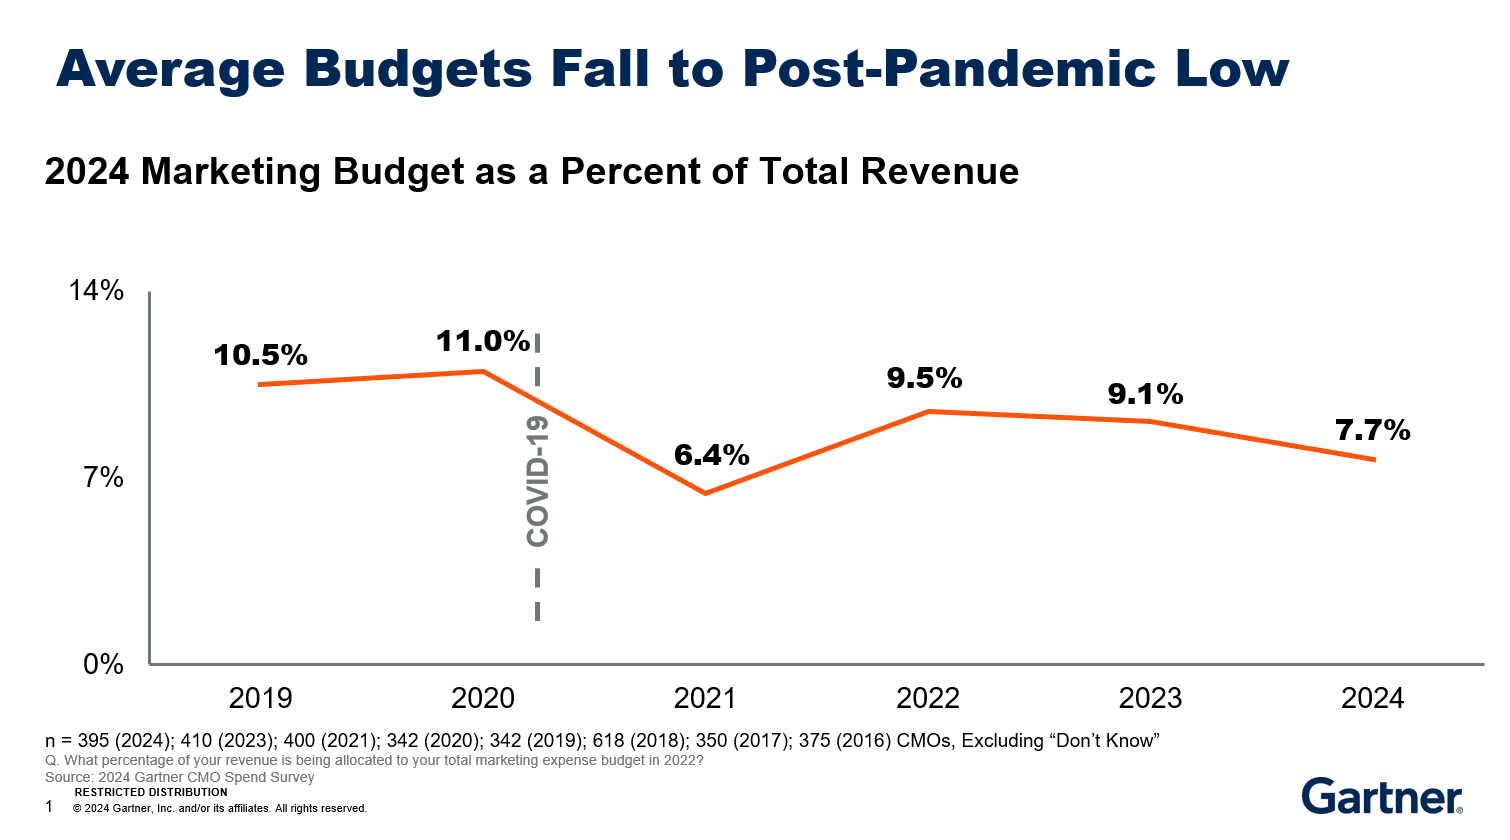
 Image Source: Gartner
While your input matters, your clients care most about the results and often struggle with raw numbers. This intellectual tool transforms complex metrics into actionable insights, presenting them through charts, graphs, tables, and scorecards. It’s not just about showing the data; it’s about telling the story behind your efforts and making the numbers meaningful and transparent.
Ideally, all these KPIs are displayed in a single marketing analytics dashboard for a comprehensive view. However, you can also build dashboards for individual channels or campaigns. KPI marketing performance dashboards are invaluable for real-time analysis and situational awareness, making it easy to pinpoint areas for improvement and identify actions that need to be taken.
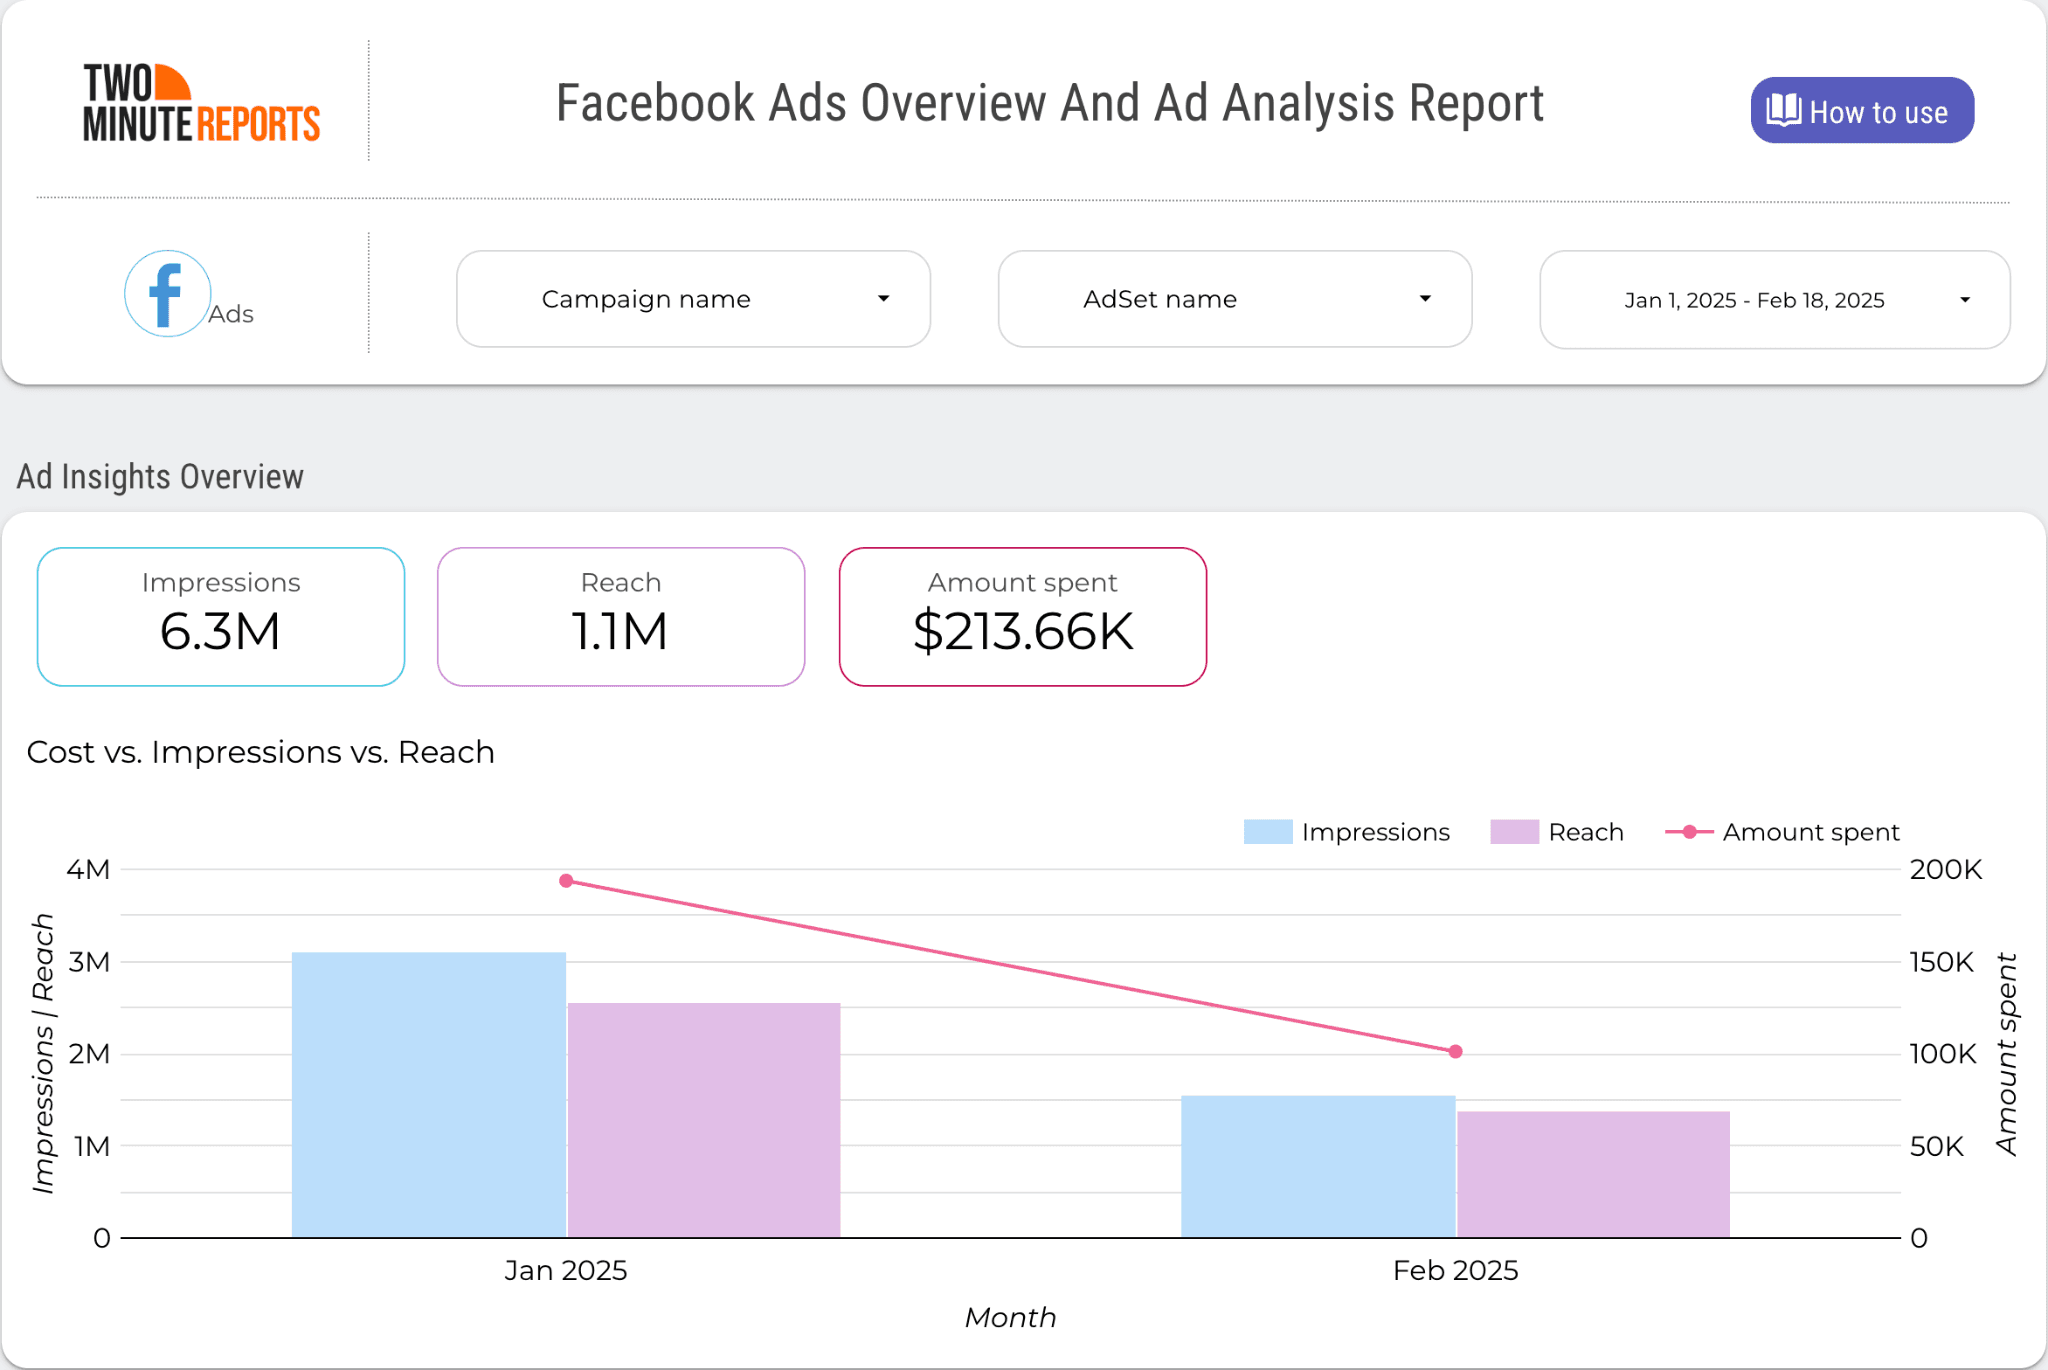
 Facebook Ads KPI Dashboard
Who’s it for: These KPI marketing dashboards are designed for key stakeholders such as marketing managers, digital marketing teams, and senior executives who need a centralized view of key metrics. Others include CMOs, brand managers, content strategists, social media managers, campaign analysts, SEO specialists, marketing analysts, and customer insights teams. |
Benefits of marketing KPI dashboards: How does this empower marketers?
Tracking KPIs isn’t just about data—it’s about making informed, strategic decisions that drive business growth. A well-structured marketing metrics dashboard helps marketers and clients focus on what truly matters, eliminating data clutter.
Key marketing metrics dashboards narrow the focus and provide clear insights into campaign performance, client retention, and lead conversion. They ensure that clients understand the real impact of your marketing efforts without getting overwhelmed by unnecessary data points. After all, the goal is to inform and guide, not to distract.
Ultimately, KPI marketing reporting dashboards do more than just display numbers—they strengthen agency-client relationships by fostering transparency, accountability, and efficiency. Here’s how:
- Clear, high-level insights – Get an instant snapshot of your campaign performance.
- Proactive problem-solving – Spot issues early and take action before they escalate.
- Goal tracking made simple – Transparent reporting helps align marketing efforts with business objectives, encouraging accountability.
- Improved productivity – Teams stay motivated with clear targets and measurable success.
- Competitive edge – Businesses can benchmark performance and refine strategies for growth.
- Optimized budget allocation – Ensure every marketing dollar is spent effectively by analyzing cost vs performance in real-time.
- Smarter investment decisions – Instantly evaluate the impact of your marketing campaigns to optimize strategies and maximize returns.
Difference between marketing KPI reports and marketing KPI dashboards
While both KPI marketing dashboards and reports help track strategic performance, they serve different purposes and are used in distinct ways. Dashboards provide real-time insights, whereas reports offer in-depth analysis over time.
A marketing KPI dashboard is a real-time, interactive tool that, when automated, provides the latest insights into key marketing metrics. It offers a high-level overview of performance for daily monitoring, spotting issues, adjusting strategies, and quick decision-making.
A marketing KPI report is a static, in-depth analysis of marketing performance over a defined period (daily, weekly, monthly, or quarterly). It provides structured insights, often with detailed explanations, helping businesses evaluate long-term trends and strategy effectiveness. Unlike dashboards, reports focus more on historical data and help predict strategy.
Feature | KPI Dashboard | KPI Report |
Purpose | Real-time data monitoring and quick decision-making | Detailed performance review and long-term strategy analysis |
Data Updates | Live, continuously updated | Static, based on a defined time period (weekly, monthly, etc.) |
Format | Interactive visualizations (charts, graphs, scorecards) | Structured documents with charts, tables, and insights |
Usage | Used for quick insights and immediate actions. | Used for periodic assessments, strategy adjustments, and stakeholder presentations |
Best For | Marketing teams, CMOs, and performance marketers who need instant visibility into campaign performance | Executives, clients, and stakeholders who look for a detailed breakdown of campaign success |
Which one do you need?
Depending on your client's objectives, you can choose between a marketing KPI dashboard and a KPI report. You can use them separately or combine both for a balanced approach, where dashboards deliver immediate insights and reports help you with deeper analysis and strategic decision-making.
Example: When you’re managing Google Ads campaigns for a client and need to track campaign performance.
- KPI Marketing Dashboard: Provides real-time tracking of key metrics like CTR, CPC, conversions, and ROI, allowing for instant adjustments in bids, ad creatives, and budget allocation when performance fluctuates.
- KPI Report: Offers a detailed performance summary at the end of the month, highlighting trends, key wins, and data-driven recommendations for future campaigns.
Pro tip: By leveraging dashboards and reports, marketing agencies can stay agile with real-time data while ensuring long-term strategic growth through comprehensive performance analysis.
How does a marketing KPI dashboard help with better decisions?
KPI performance dashboards are a game-changer in business and marketing decision-making. How? They turn raw data into meaningful visual insights and help marketers and business leaders shift from gut-based decisions to a data-driven approach. 53% of your marketing decisions are influenced by marketing analytics, highlighting just how critical these insights are. KPI analytics dashboards provide a clear picture of what’s working, what needs improvement, and where to tweak strategies by centralizing performance metrics in one place.
1) From intuition to data-driven decisions
A key marketing metrics dashboard helps you make informed choices backed by real-time data rather than assumptions. Analyze real-time performance indicators to identify trends, anticipate challenges, and optimize campaigns for maximum impact. For instance, a well-structured PPC or social media dashboard provides a clear picture of ad performance, engagement metrics, and ROI, ensuring that every marketing dollar is spent effectively.
2) Fostering collaboration with centralized insights
A well-structured marketing reporting dashboard keeps everyone on your team on the same page. Whether it’s marketing managers, digital strategists, and executives, having access to real-time insights ensures a shared understanding of business objectives, eliminating data silos. This enables better cross-team collaboration, optimized workflows, swift decision-making, and better strategic actions.
3) Adapting strategies with real-time feedback
One of the biggest advantages of KPI dashboards is the ability to refine strategies on the go. Instead of waiting for monthly reports, you can instantly track campaign performance in real-time, identify dips or spikes, and plan. This agility ensures marketing budgets are spent wisely, targets remain realistic, and operational bottlenecks are addressed before they escalate, ensuring campaigns stay on track.
4) Reinforcing best practices and continuous improvement
Marketing reporting dashboards don't just highlight successes; they help replicate them. Marketers can recognize patterns, pinpoint winning strategies, set benchmarks, and refine marketing efforts for greater long-term success, eliminating trial-and-error methods through continuous analysis of campaign performance.
5) Predictive insights for future strategic planning
Beyond tracking current performance, marketing analytics dashboards help businesses forecast trends by analyzing historical data, identifying emerging patterns, and tracking user behavior. With this data-driven approach, marketers can anticipate market shifts and refine their targeting strategies, supporting growth-oriented decision-making for long-term success.
Key marketing KPIs & metrics to include in the dashboard
Every Key Performance Indicator (KPI) should be directly tied to your business goals. Whether it’s revenue growth, social media engagement, or lead generation, ensure your marketing metrics and KPIs align with your company's objectives for maximum impact.
Marketing KPIs are the foundation for measuring success across different channels, but their significance and relevance vary depending on the platform. While SEO focuses on organic traffic and keyword rankings, PPC campaigns prioritize cost-per-click and return on ad spend. Social media metrics emphasize engagement and audience growth, whereas open rates, conversions, etc., determine email marketing success.
Let’s understand the common essential marketing metrics across channels:
1) Traffic: This refers to the number of visitors to a website or landing page and is crucial for understanding how well marketing efforts capture users’ attention to your digital properties.
2) Engagement: Engagement measures how actively users interact with your content, such as likes, shares, comments, time spent on pages, or clicks on ads. High engagement signals indicate your content resonates with the target audience, driving meaningful interaction.
3) Conversions: Conversions track the number of visitors who complete a desired action, such as filling out a form, purchasing, or signing up for a newsletter. It’s a critical metric for evaluating the effectiveness of marketing campaigns in driving goal-oriented actions.
4) Customer Acquisition Cost (CAC): This metric represents the total cost of acquiring a new customer, including marketing expenses, sales efforts, and other associated costs. A lower CAC means you’re acquiring customers more cost-effectively.
5) ROI & revenue impact: Return on Investment (ROI) measures the profitability of marketing campaigns, calculated by comparing the profit generated to the cost of the campaign. Revenue impact assesses how your marketing efforts directly contribute to business sales and success.
6) Retention & loyalty: Retention refers to the ability to keep customers over time, while loyalty measures how likely customers are to return or recommend your products/services. Both are vital for long-term business growth and profitability, highlighting customer satisfaction and the effectiveness of post-sale marketing.
Additional metrics to consider:
1) Click-through rate (CTR): This metric tracks the percentage of people who click on a link (like an ad or email) compared to the total number of visitors. A high CTR indicates effective customized messaging and compelling calls to action.
2) Cost per click (CPC): This metric measures the cost of each click in paid advertising campaigns. It helps determine how much you pay for the traffic generated and assesses whether your ads are cost-effective.
3) Lead generation: This metric focuses on tracking the number of leads (potential customers) generated through your marketing strategies. It’s also essential to understand the effectiveness of campaigns in attracting interest from individuals who may convert into customers later.
4) Social Share of Voice (SOV): This metric measures how much your brand is being talked about compared to your competitors on social media or other digital platforms. It gives insights into your brand's visibility in the market relative to others.
5) Bounce rate: Bounce rate refers to the percentage of visitors who land on your page and leave without interacting further. It indicates whether the landing page or content resonates with visitors or needs improvement.
6) Customer Lifetime Value (CLV): This metric estimates the total revenue a customer will generate during their relationship with your business. It helps in understanding the long-term value of acquiring and retaining customers.
7) Conversion Rate Optimization (CRO): This focuses on improving the percentage of visitors who convert into customers. CRO strategies are essential for optimizing landing pages, sales funnels, and overall user experience.
Marketers must track the right KPIs for each channel to optimize campaign performance. The table below breaks down the key marketing KPIs and how they differ across platforms, helping you refine strategies for maximum impact.
How to build a marketing KPI dashboard (step-by-step)?
Building a KPI marketing dashboard involves more than just pulling data into one place—it’s about creating a clear, insightful, and actionable view of your marketing performance. From selecting the right KPIs to designing a user-friendly interface, every step is vital in ensuring your dashboard delivers real value.
Here’s how to create a marketing KPI dashboard that keeps you and your team focused on what truly matters:
1) Define your marketing goals and business objectives
Start by identifying the core objectives your marketing efforts aim to achieve. Whether it's increasing brand awareness, boosting conversions, or improving customer retention, your goals will determine the KPIs you should track. Choose performance indicators that align with your business strategy and provide measurable insights into your success.
2) Select relevant metrics
Once you have your KPIs, narrow down the specific marketing metrics that will help you track progress. This could include traffic, engagement, conversion rates, customer acquisition cost (CAC), and retention metrics. It’s essential to balance real-time indicators (leading metrics) with long-term performance markers (lagging metrics) to get a complete picture of your marketing impact.
3) Choose the right dashboard tool
Select a marketing dashboard software that aligns with your reporting needs, business size, and data complexity to aggregate and visualize insights. The ideal tool should allow seamless integration with multiple data sources, offer customizable visualizations, and support automated updates to reduce manual effort. Look for features like role-based access, mobile compatibility, and scalability to accommodate future growth. Options include:
- Two Minute Reports (TMR): Great for automating reporting across multiple platforms, simplifying data collection, and streamlining analysis in Google Sheets & Looker Studio.
- Google Data Studio: Best for free, customizable dashboards with multiple integrations.
- Tableau: Ideal for advanced data visualization and in-depth analysis.
4) Integrate Data Sources
Connect your dashboard to essential marketing data sources or use a third-party tool for seamless tracking. Key sources include:
- Google Analytics to track website traffic, user behavior, and conversion paths.
- Google Ads & Facebook Ads to monitor ad performance, click-through rates (CTR), and ad spend.
- CRM Tools (HubSpot, Salesforce, etc.) to gain insights on lead tracking, customer interactions, and sales pipeline progress.
- Social media platforms to help you measure engagement metrics, audience growth, and brand mentions.
- Email marketing tools (Mailchimp, ActiveCampaign, etc.) help you analyze email campaign performance, open rates, and conversions.
5) Design a clear layout
A well-structured marketing dashboard template should be easy to interpret at a glance. To present data effectively, use clear visualizations like charts, graphs, and tables. Avoid data clutter and highlight key trends using color coding and interactive elements. The goal is to provide stakeholders with insights that help them take immediate action.
6) Automate data syncing
Manually updating KPI marketing dashboards can be time-consuming and prone to errors. To keep your dashboard accurate and up to date, integrate it with data sources like Google Analytics, CRM tools, advertising platforms, and social media accounts. Automation ensures that your team always has access to the latest performance data without the hassle of manual reporting.
7) Customize for the audience
Tailor the marketing KPI dashboard to different stakeholders - executives need high-level performance summaries, while marketing teams benefit from deeper insights into campaign performance and audience behavior. Creating multiple marketing dashboard templates, customizing them, and providing role-based access control ensures that team members only see the data relevant to their function.
8) Review, optimize, and evolve
Marketing performance is constantly shifting, and so should your dashboard. Regularly review your KPIs and update your marketing performance dashboard to reflect changing business goals, market trends, and new data sources. Set a cadence (daily, weekly, or monthly) for checking your metrics to ensure your team is always making informed, data-driven decisions.
9) Collaborate and act on insights
A marketing analytics dashboard is only valuable if teams actively use the insights to refine strategies. You can share dashboards across departments to implement workflow, foster transparency, align actions, and drive strategic decisions on trends and anomalies.
Free marketing dashboard templates: Types & customization tips
Marketing KPI dashboards come in various forms and complexities, each designed to address different aspects of digital marketing. These dashboards are often split by department, target recipient, or marketing channel, ensuring the right metrics are highlighted for the right audience. By customizing these dashboards to fit specific business needs, you can ensure that your marketing efforts are aligned with strategic goals and make data-driven decisions quickly.
With Two Minute Reports (TMR), you can seamlessly create and customize these marketing analytics dashboards by pulling data from multiple sources into Google Sheets and Looker Studio.
Let’s explore the seven popular KPI marketing dashboard examples widely used by marketing agencies and how TMR offers free, ready-to-use templates for over 30 integrations, enabling seamless tracking and reporting.
Web analytics dashboards
Web Analytics dashboards consolidate data from various sources to better understand how visitors interact with your client’s online presence (website or digital platform). These dashboards typically pull data from tools like Google Analytics, offering a clear, real-time overview of key metrics such as website traffic, user engagement, conversion rates, bounce rates, and page performance. Gain insights into user behavior, identify trends, and measure the effectiveness of marketing campaigns.
TMR advantage: Effortlessly connect GA4 to Google Sheets or Looker Studio, ensuring real-time insights and automated reporting. Plus, TMR’s Speedboost feature lets you retrieve data in the blink of an eye, making reporting effortless and insightful.

| Audience: Marketing managers, digital marketing teams, business analysts, web developers, product managers, CMOs, and client services teams who rely on real-time insights to optimize strategies and performance. |
How to customize your web analytics dashboard?
- Monitor interactions like clicks, scroll depth, and time on pages.
- Set goals (e.g., form submissions and purchases) to track conversions.
- Track traffic, bounce rates, and engagement on key landing pages.
- Analyze data by traffic sources (organic, paid, referral).
- Set real-time alerts to track sudden changes in traffic or conversions.
PPC dashboards
With a consolidated PPC dashboard, you can monitor data from multiple paid media sources, such as Facebook Ads, LinkedIn Ads, and Google Ads, all in one place. This lets you easily track conversion changes, customer acquisition costs, budget spending, total costs, and other important KPIs—making PPC dashboards an essential tool for any marketing strategy.
TMR Advantage: Automate pulling PPC metrics across different platforms into one centralized dashboard, eliminating manual intervention and enabling cross-channel insights for better performance analysis.

| Audience: Digital marketers, PPC managers, and advertising specialists responsible for optimizing ad spend. |
How can you tailor your dashboard to track specific user behavior?
- Allocate and track ad spending per platform (Google Ads, Facebook Ads).
- Analyze performance based on audience demographics or interests.
- Track the return on investment across specific periods to optimize ad spending.
Social media dashboards
Social media is one of the most powerful marketing channels, and while tracking each platform individually is important, monitoring all social media channels at a strategic level provides a more comprehensive view of performance.
Is this possible?
With Two Minute Reports’ social media KPI dashboards, you can seamlessly consolidate data from platforms like Facebook, Instagram, Twitter, and LinkedIn. These dashboards help marketers track key metrics such as engagement rates, follower growth, content performance, and goal completions with a centralized view. These real-time insights empower businesses to refine their social media strategies and optimize content for maximum reach and engagement.

| Audience: Social media managers, content strategists, Digital marketers, brand managers, performance marketers, growth strategists, and community managers responsible for building and enhancing online presence. |
How can you customize your social media dashboard to fit your business needs?
- Customize for individual platforms (Facebook, Instagram, LinkedIn, etc.).
- Track engagement by content type (posts, videos, stories).
- Measure the performance of specific hashtags or social campaigns.
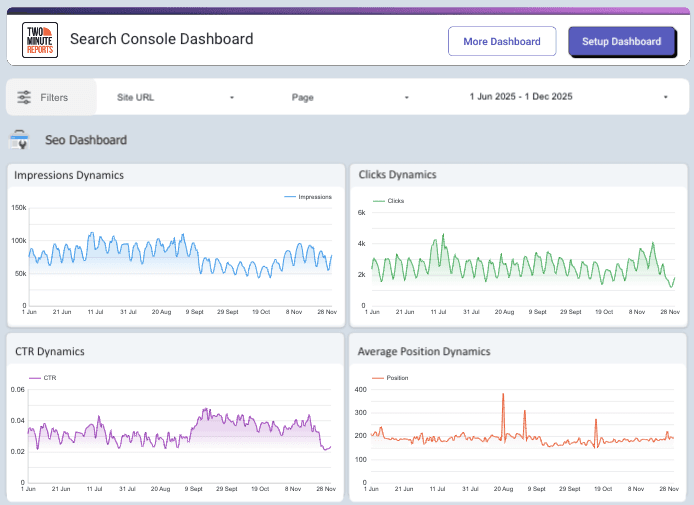
SEO
An SEO analytics dashboard is a must-have for businesses focused on SEO and organic growth. It helps track organic traffic from search engines and provides insights into your overall search performance.
With Two Minute Reports’ SEO KPI dashboards, you can seamlessly pull data from Google Analytics, Google Search Console, Google Trends, and other SEO tools. Track key metrics like organic traffic, keyword rankings, backlink performance, and search visibility to identify trends, optimize content, and improve rankings for long-term growth.
| Audience: SEO specialists, digital marketers, and web analysts who need to monitor website performance, optimize traffic, and improve search rankings. |
How can you personalize your dashboard to focus on user behavior?
- Focus on specific keywords or landing pages to measure performance.
- Track organic leads or sales to link SEO efforts with revenue.
- View keyword ranking or traffic changes over specific periods.
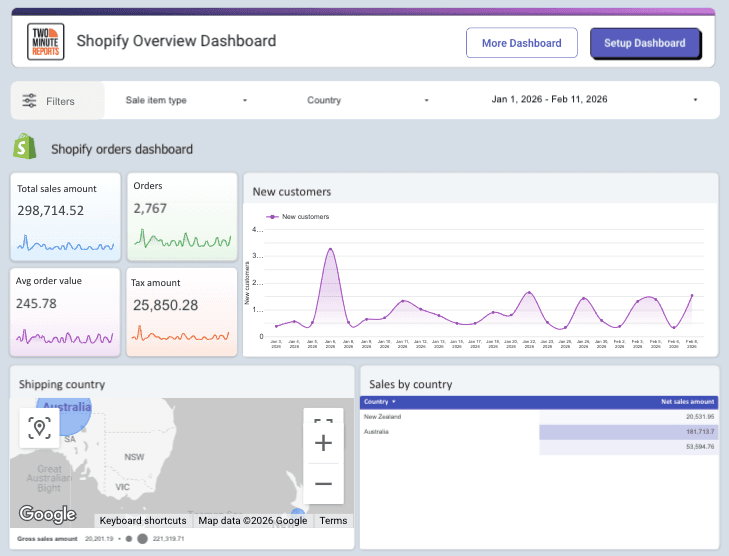
Ecommerce
Ecommerce success depends on real-time sales tracking, customer behavior, and marketing performance. Manually pulling and customizing data from platforms like Shopify, WooCommerce, and Amazon Seller can be time-consuming. Still, with Two Minute Reports’ Ecommerce KPI dashboards, you get a centralized view of revenue trends, cart abandonment rates, average order value, and customer lifetime value.
By consolidating data from multiple sources, businesses can identify top-performing products, optimize their sales funnel, and refine marketing strategies to boost conversions. Scaling an online store becomes easier and more efficient with clear, data-driven insights.
| Audience: Ecommerce managers, digital marketers, performance analysts, sales strategists, and business owners looking to optimize online sales and customer retention. |
How can you customize your ecommerce dashboard to track sales performance?
- Focus on revenue trends and top-performing product categories.
- Track where users drop off in the purchase process.
- Customize for tracking individual products’ conversion rates.
Email marketing
Email marketing remains one of the most profitable marketing channels, making it essential for marketers to track and analyze campaign performance. An email marketing KPI dashboard visualizes key metrics, helping marketers assess open rates, click-through rates, conversions, and overall engagement to optimize email strategies, segment audiences effectively, and improve email deliverability for higher ROI.
TMR Advantage: Seamlessly connect your email marketing data and automate tracking for higher ROI.

| Audience: Email marketers, CRM specialists, digital marketing managers, automation strategists, and growth marketers focused on customer engagement and retention. |
How can you customize your email marketing dashboard to track open and click-through rates?
- Track performance by audience type (e.g., new vs. engaged subscribers).
- Measure the results of A/B tests on subject lines and content.
- Highlight performance metrics for individual campaigns.
Lead generation
A lead generation KPI dashboard provides insights into how effectively marketing efforts drive potential customers into the sales funnel. It visualizes key metrics such as lead volume, cost per lead, lead conversion rates, and sources of high-quality leads, making it easy to optimize lead generation strategies, allocate budgets, and refine targeting for better conversion rates.
TMR Advantage: Simplify lead tracking by integrating HubSpot and other CRM tools, ensuring up-to-date insights.
| Audience: Performance marketers, demand generation specialists, sales teams, digital marketers, and business development managers aiming to boost customer acquisition. |
How can you customize your lead generation dashboard to track lead volume?
- Monitor performance by lead source (e.g., paid ads, organic, referrals).
- Track how leads are progressing through the sales funnel.
- Analyze lead generation trends over weeks or months.
Best practices for an effective marketing KPI dashboard
Creating a KPI dashboard isn’t just about displaying data—it’s about making insights accessible, actionable, and aligned with business goals. Here are some marketing dashboard best practices to ensure your dashboard is both effective and user-friendly:
1. Align KPIs with goals – Focus on metrics that directly support your marketing objectives.
2. Keep it clean & focused – Avoid clutter; highlight only the most critical data.
3. Maintain visual consistency – Use uniform colors, fonts, and charts for easy interpretation.
4. Regularly review & optimize – Update KPIs as business priorities evolve.
5. Balance depth & simplicity – Provide high-level insights with drill-down options for details.
6. Use the right visuals – Choose simple, effective charts to convey data.
7. Tailor for different stakeholders – Executives need summaries; marketing teams need detailed insights.
8. Usability test – Ensure the dashboard is intuitive and actionable.
Final thoughts
A KPI marketing dashboard is more than just a tool for tracking metrics—it’s a strategic asset that helps you make better decisions faster. Whether aligning your team, refining strategies, or predicting future trends, marketing KPI dashboards give you the clarity and confidence to move forward.
With Two Minute Reports, you can streamline your reporting process, eliminating the need for manual work and keeping your data fresh and actionable. Plus, with access to free, customizable dashboards from TMR, you can easily connect over 30 integrations. This ensures you have the relevant data-driven insights to stay on top of your performance and make informed decisions every time.
Frequently Asked Questions
A KPI (Key Performance Indicator) is a vital metric to measure how effectively you achieve your marketing objectives. These marketing KPIs help track progress towards specific goals, such as boosting brand awareness, increasing conversions, or improving engagement.
A Chief Marketing Officer (CMO) dashboard provides a high-level view of your overall effectiveness of marketing strategies and spending in one place. It typically includes long-term metrics (brand health) and short-term indicators of ongoing campaigns (lead generation).
Start by identifying the key KPIs to track, selecting your data sources, using clear visuals like graphs or charts, tailoring the dashboard to fit your user’s needs, and sharing the dashboard with stakeholders for continuous insights.
A marketing dashboard is designed to give you a clear, visual overview of your marketing efforts. Consolidating key metrics in one place helps marketers and business leaders track progress, measure success, and make data-driven decisions.
The four P's are Product, Price, Place, and Promotion. These are essential for building KPIs that align with your marketing strategy and help you measure performance across different aspects of your business.
A marketing KPI dashboard provides a real-time snapshot of your performance metrics, helping you track progress that aligns with business goals. With charts, graphs, scorecards, and tables, it transforms raw data into clear, actionable insights.
Related Blogs


Meet the Author
Shabika VenkidachalamShabika, at her core, is a storyteller who believes even data-heavy topics can be infused with heart. At Two Minute Reports, she blends creative writing with user intent to create clear, purposeful content that is deeply human. Away from her desk, she finds inspiration in nature, where creativity flourishes without distractions.
