
Summarize this blog post with:
Shopify gives you a plethora of data to analyze your store performance, but turning that data into a clear, up-to-date Data Studio dashboard can become a tedious task. You need to bring together sales, orders, products, customers and other store details before you can see what’s actually driving performance.
With Two Minute Reports, you can connect Shopify to Google Data Studio and bring your sales and marketing insights into one dashboard. This makes it easier to streamline ecommerce reporting and spot performance trends as they happen.
In this guide, I’ll show you how to connect Shopify to Google Data Studio and build your store dashboard step by step.
How to Connect Shopify to Google Data Studio?
You can connect Shopify to Data Studio using the following methods:
- Method 1: Connect Shopify to Google Data Studio via Two Minute Reports Hub.
- Method 2: Connect Shopify to Google Data Studio using pre-built templates.
Method 1: Connect Shopify to Google Data Studio via TMR Hub
Two Minute Reports Hub is your dedicated workspace for adding, organizing and managing your Shopify store data. Here’s how to get started:
Step 1: Creating a Connection
1. Go to hub.twominutereports.com and click Connections → Create Connection.
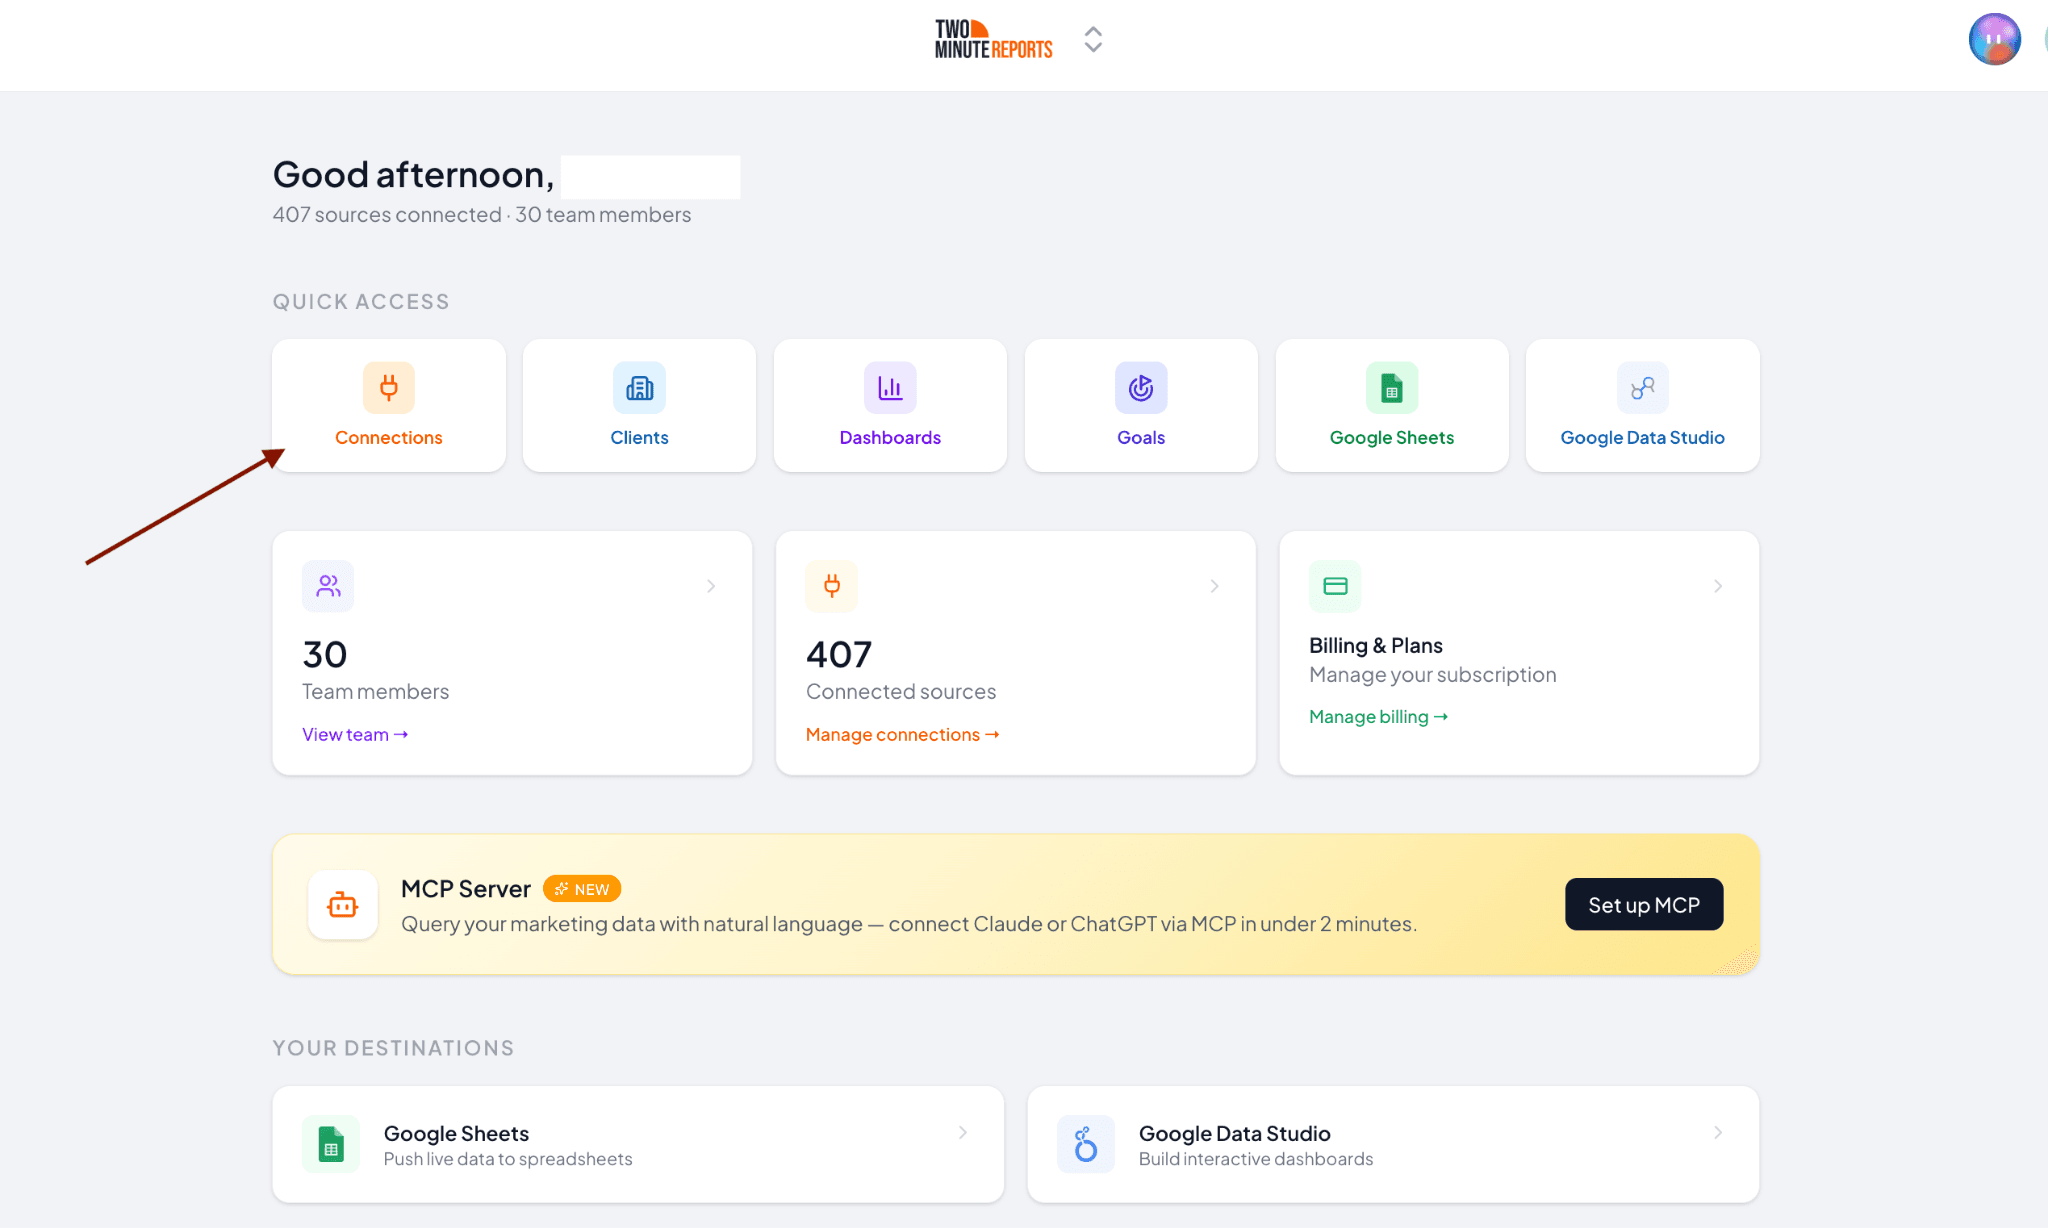
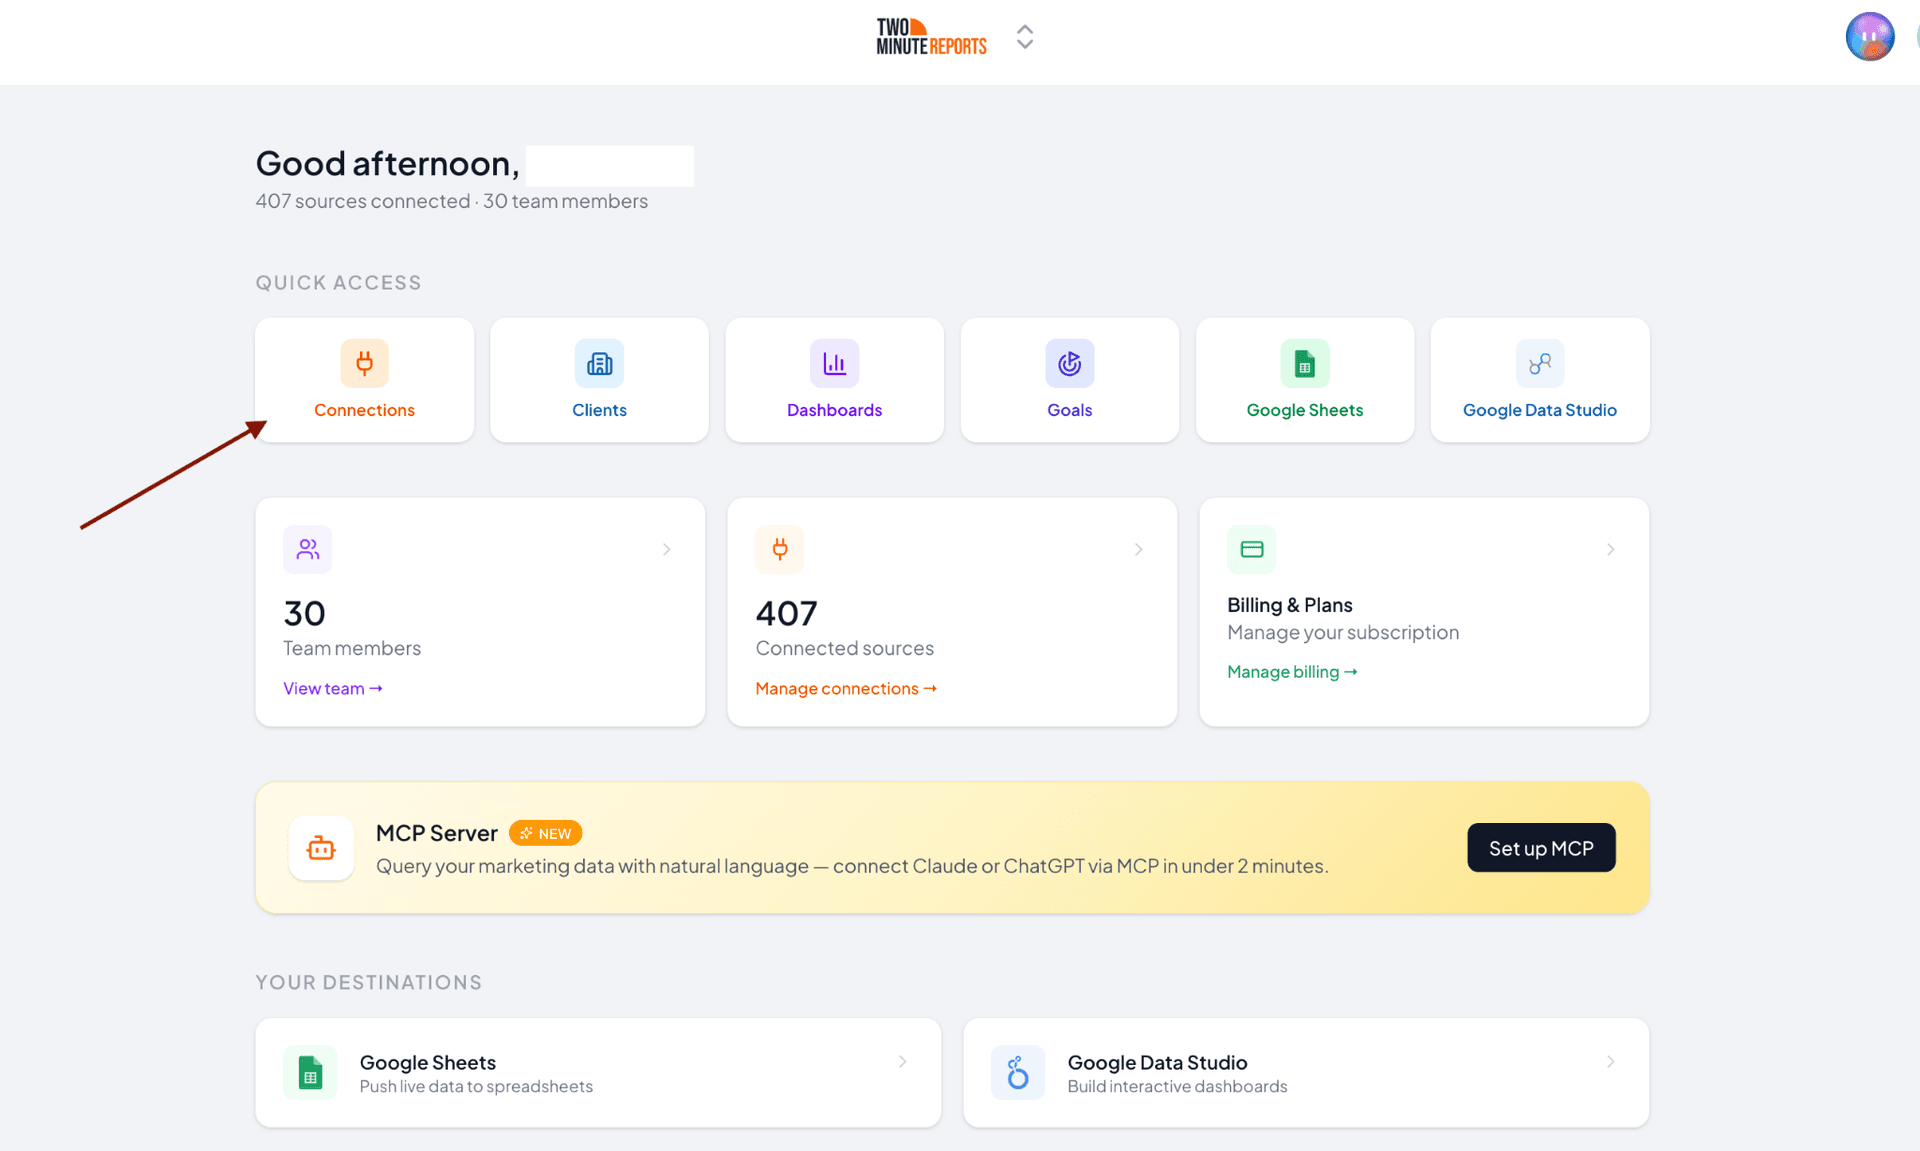
2. Inside the dialog box, complete these three steps:
- Select Shopify from the list of options.
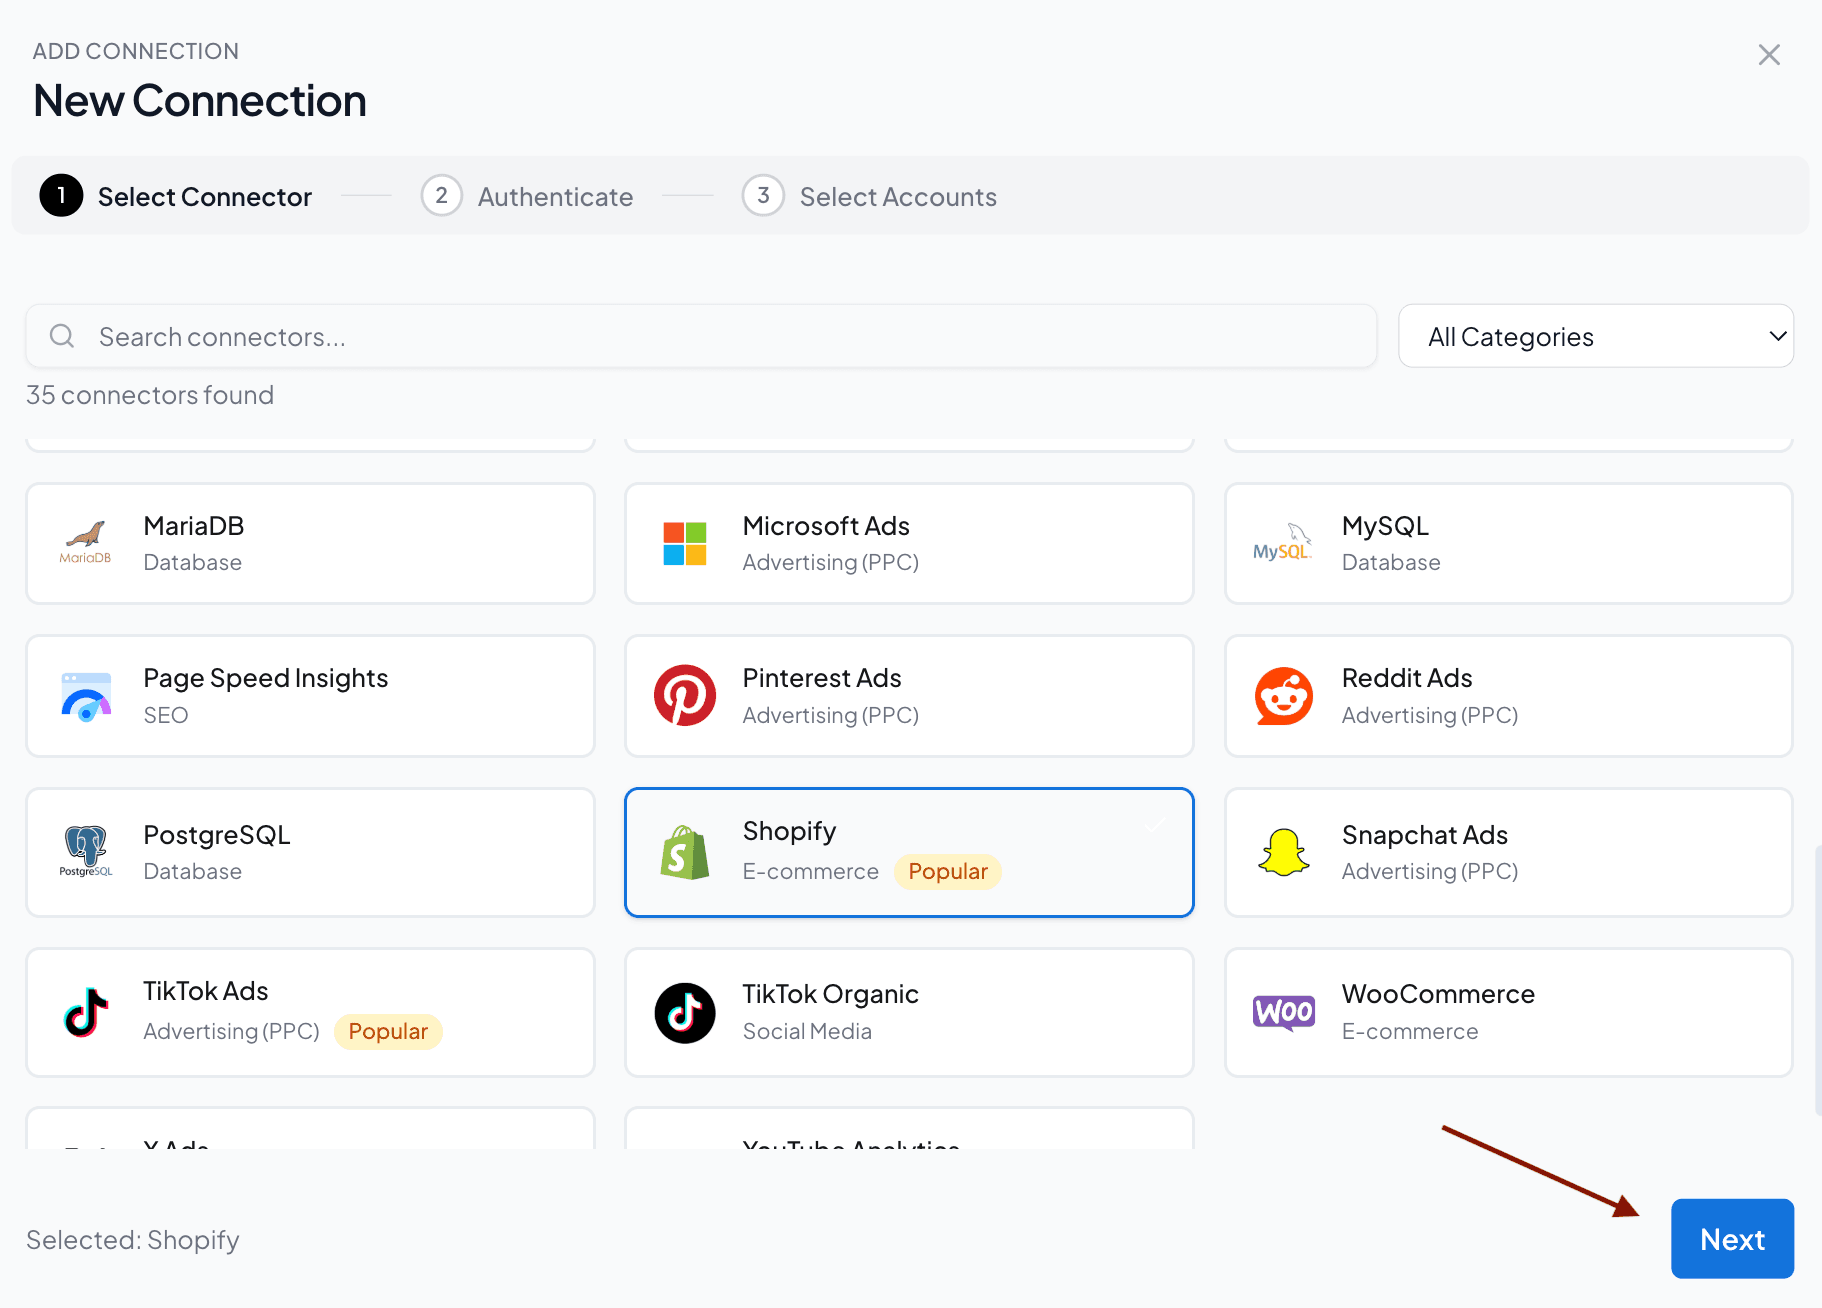
- Next authorize your connection by selecting the app type: You could either choose Shopify Public App and enter your store URL, or choose Shopify Admin Custom App and enter the access token. Checkout our article on creating the app from your Shopify store.
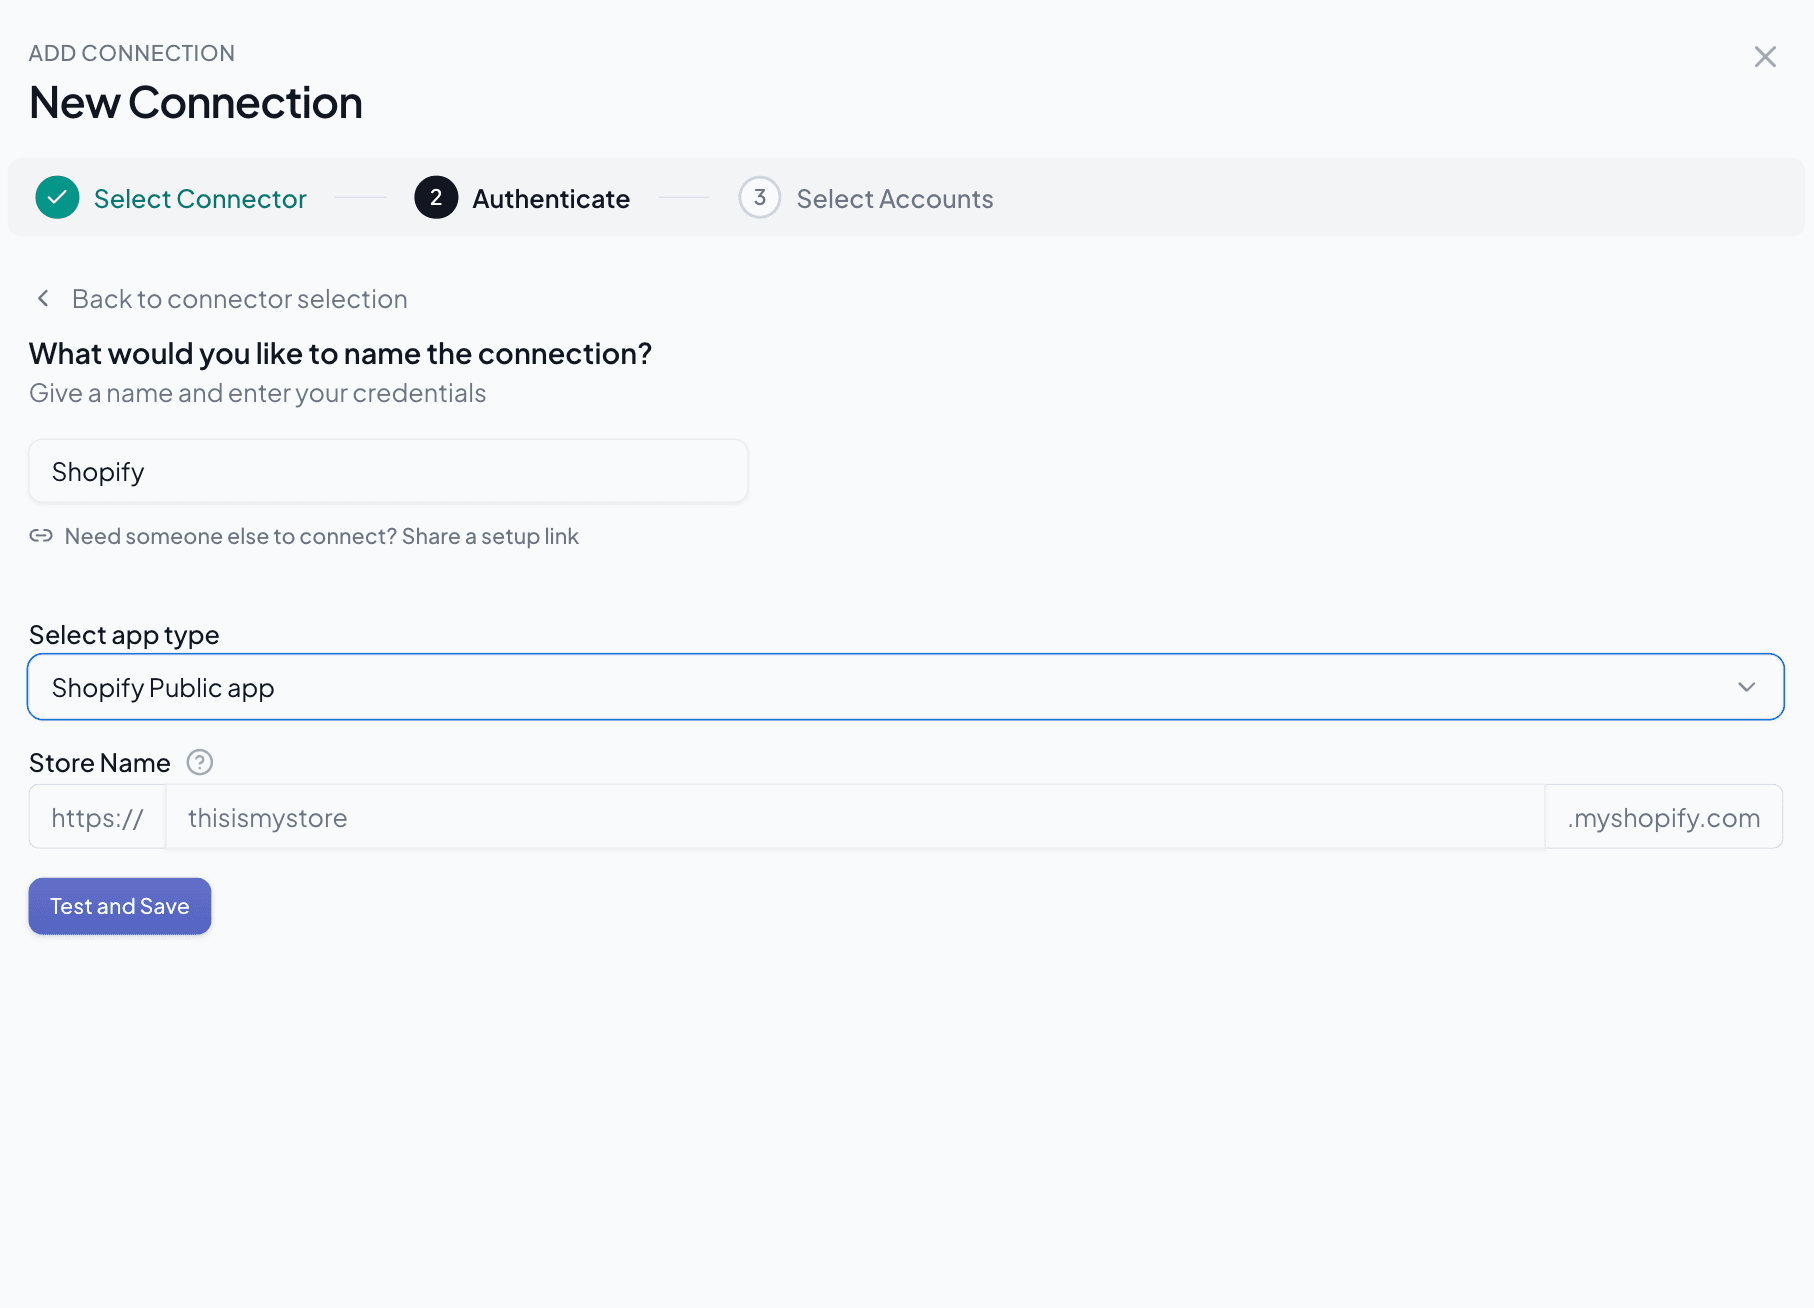
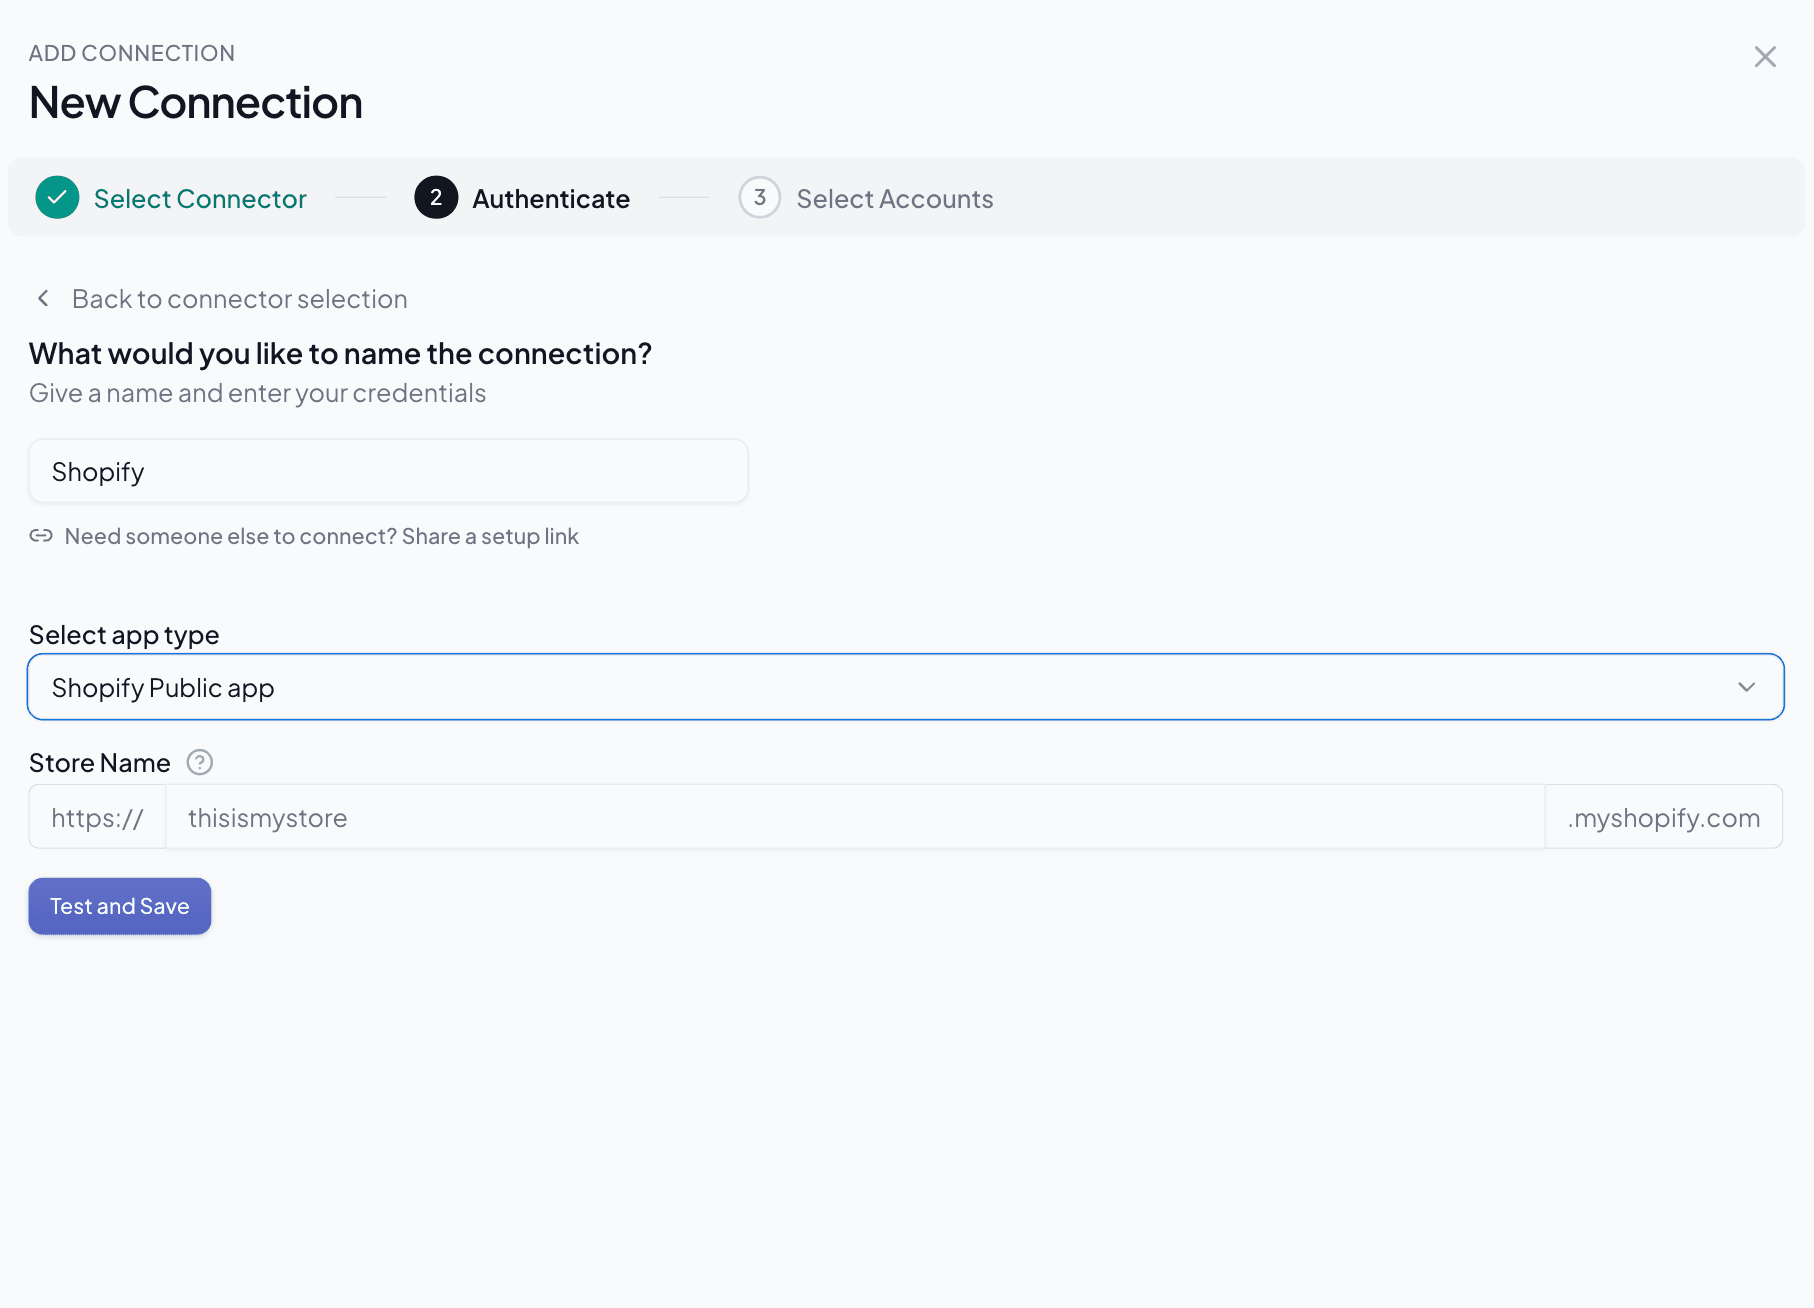
- Next, enable the Shopify accounts you want to track performance. Please note that you cannot query disabled accounts.
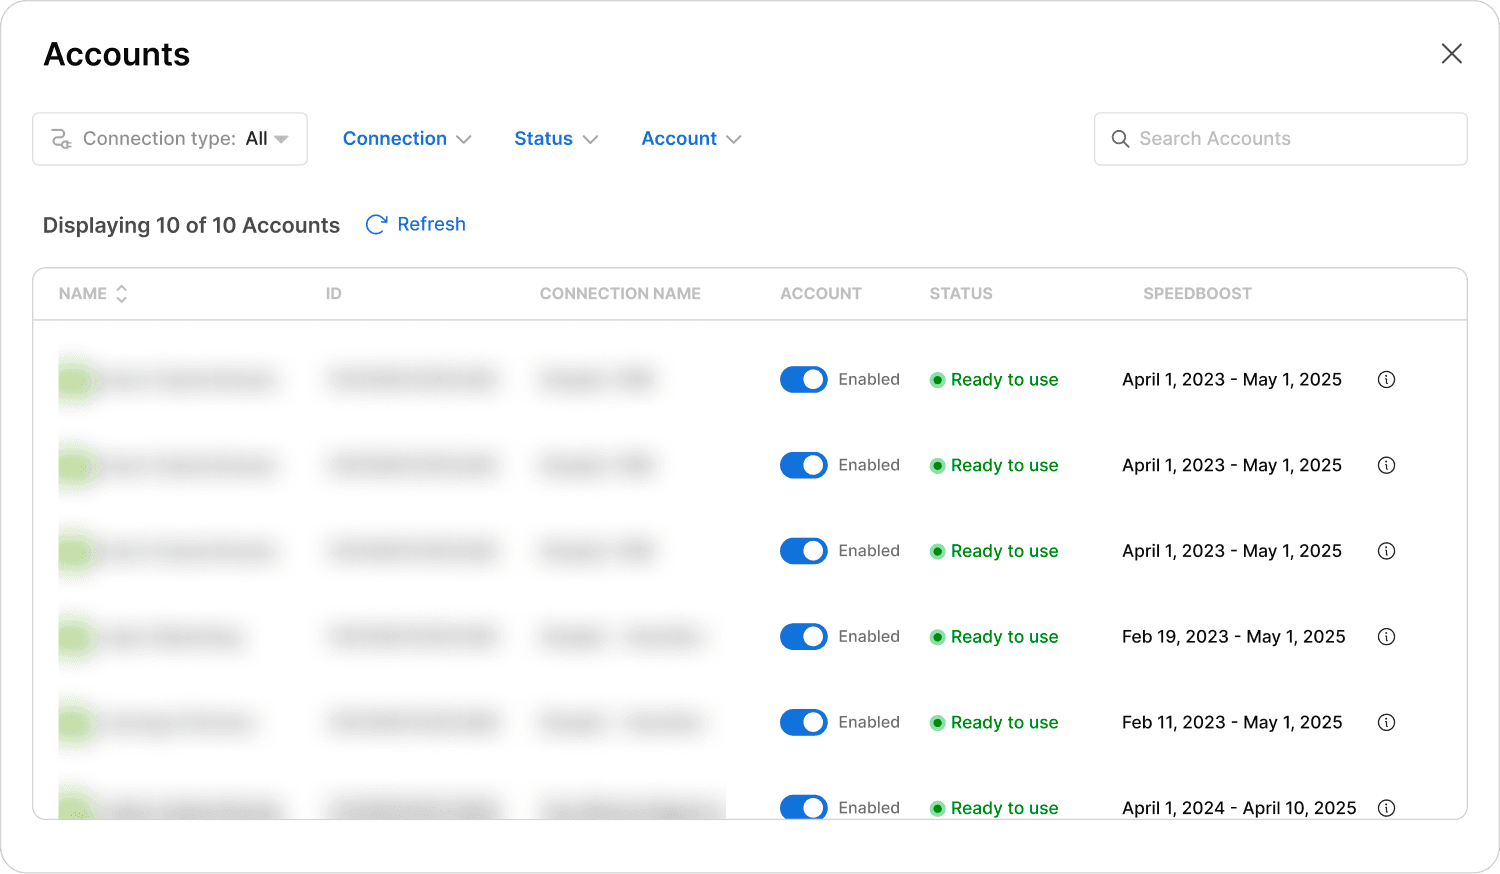
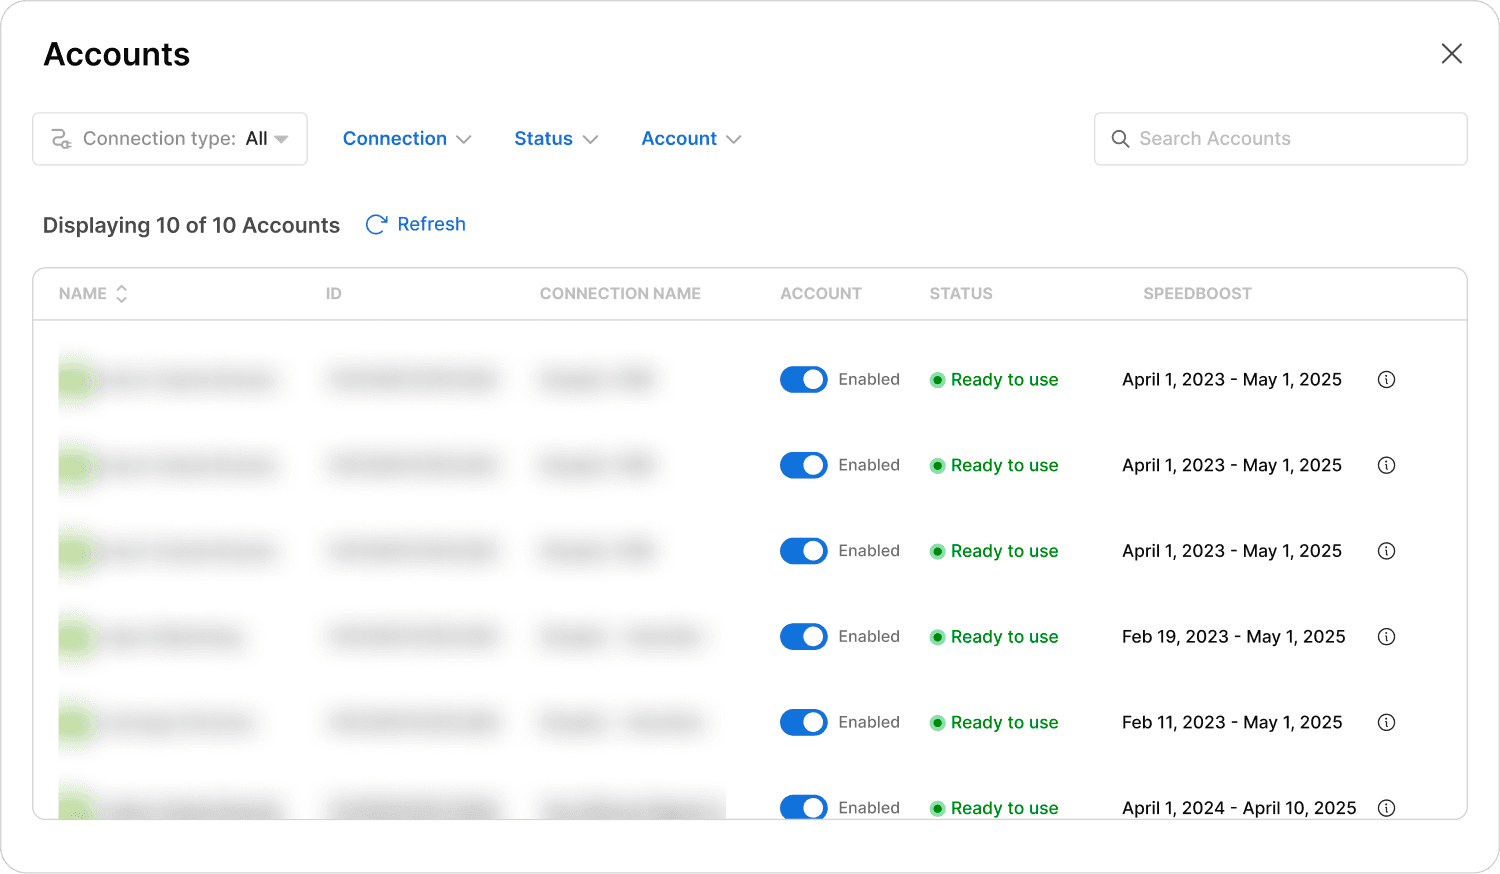
Note: With Speedboost, you can handle high-volume Shopify store datasets and create lightning-fast Data Studio dashboards without any delays. This is an exclusive technology of Two Minute Reports built for scalable client reporting.
3. Once done, go back to the Hub Homepage and click Google Data Studio and proceed with the steps below to build your Shopify dashboard in Data Studio.
Step 2: Configure Your Shopify Account in Looker Studio
- Once you’re in the Google Data Studio menu, click Create Report.
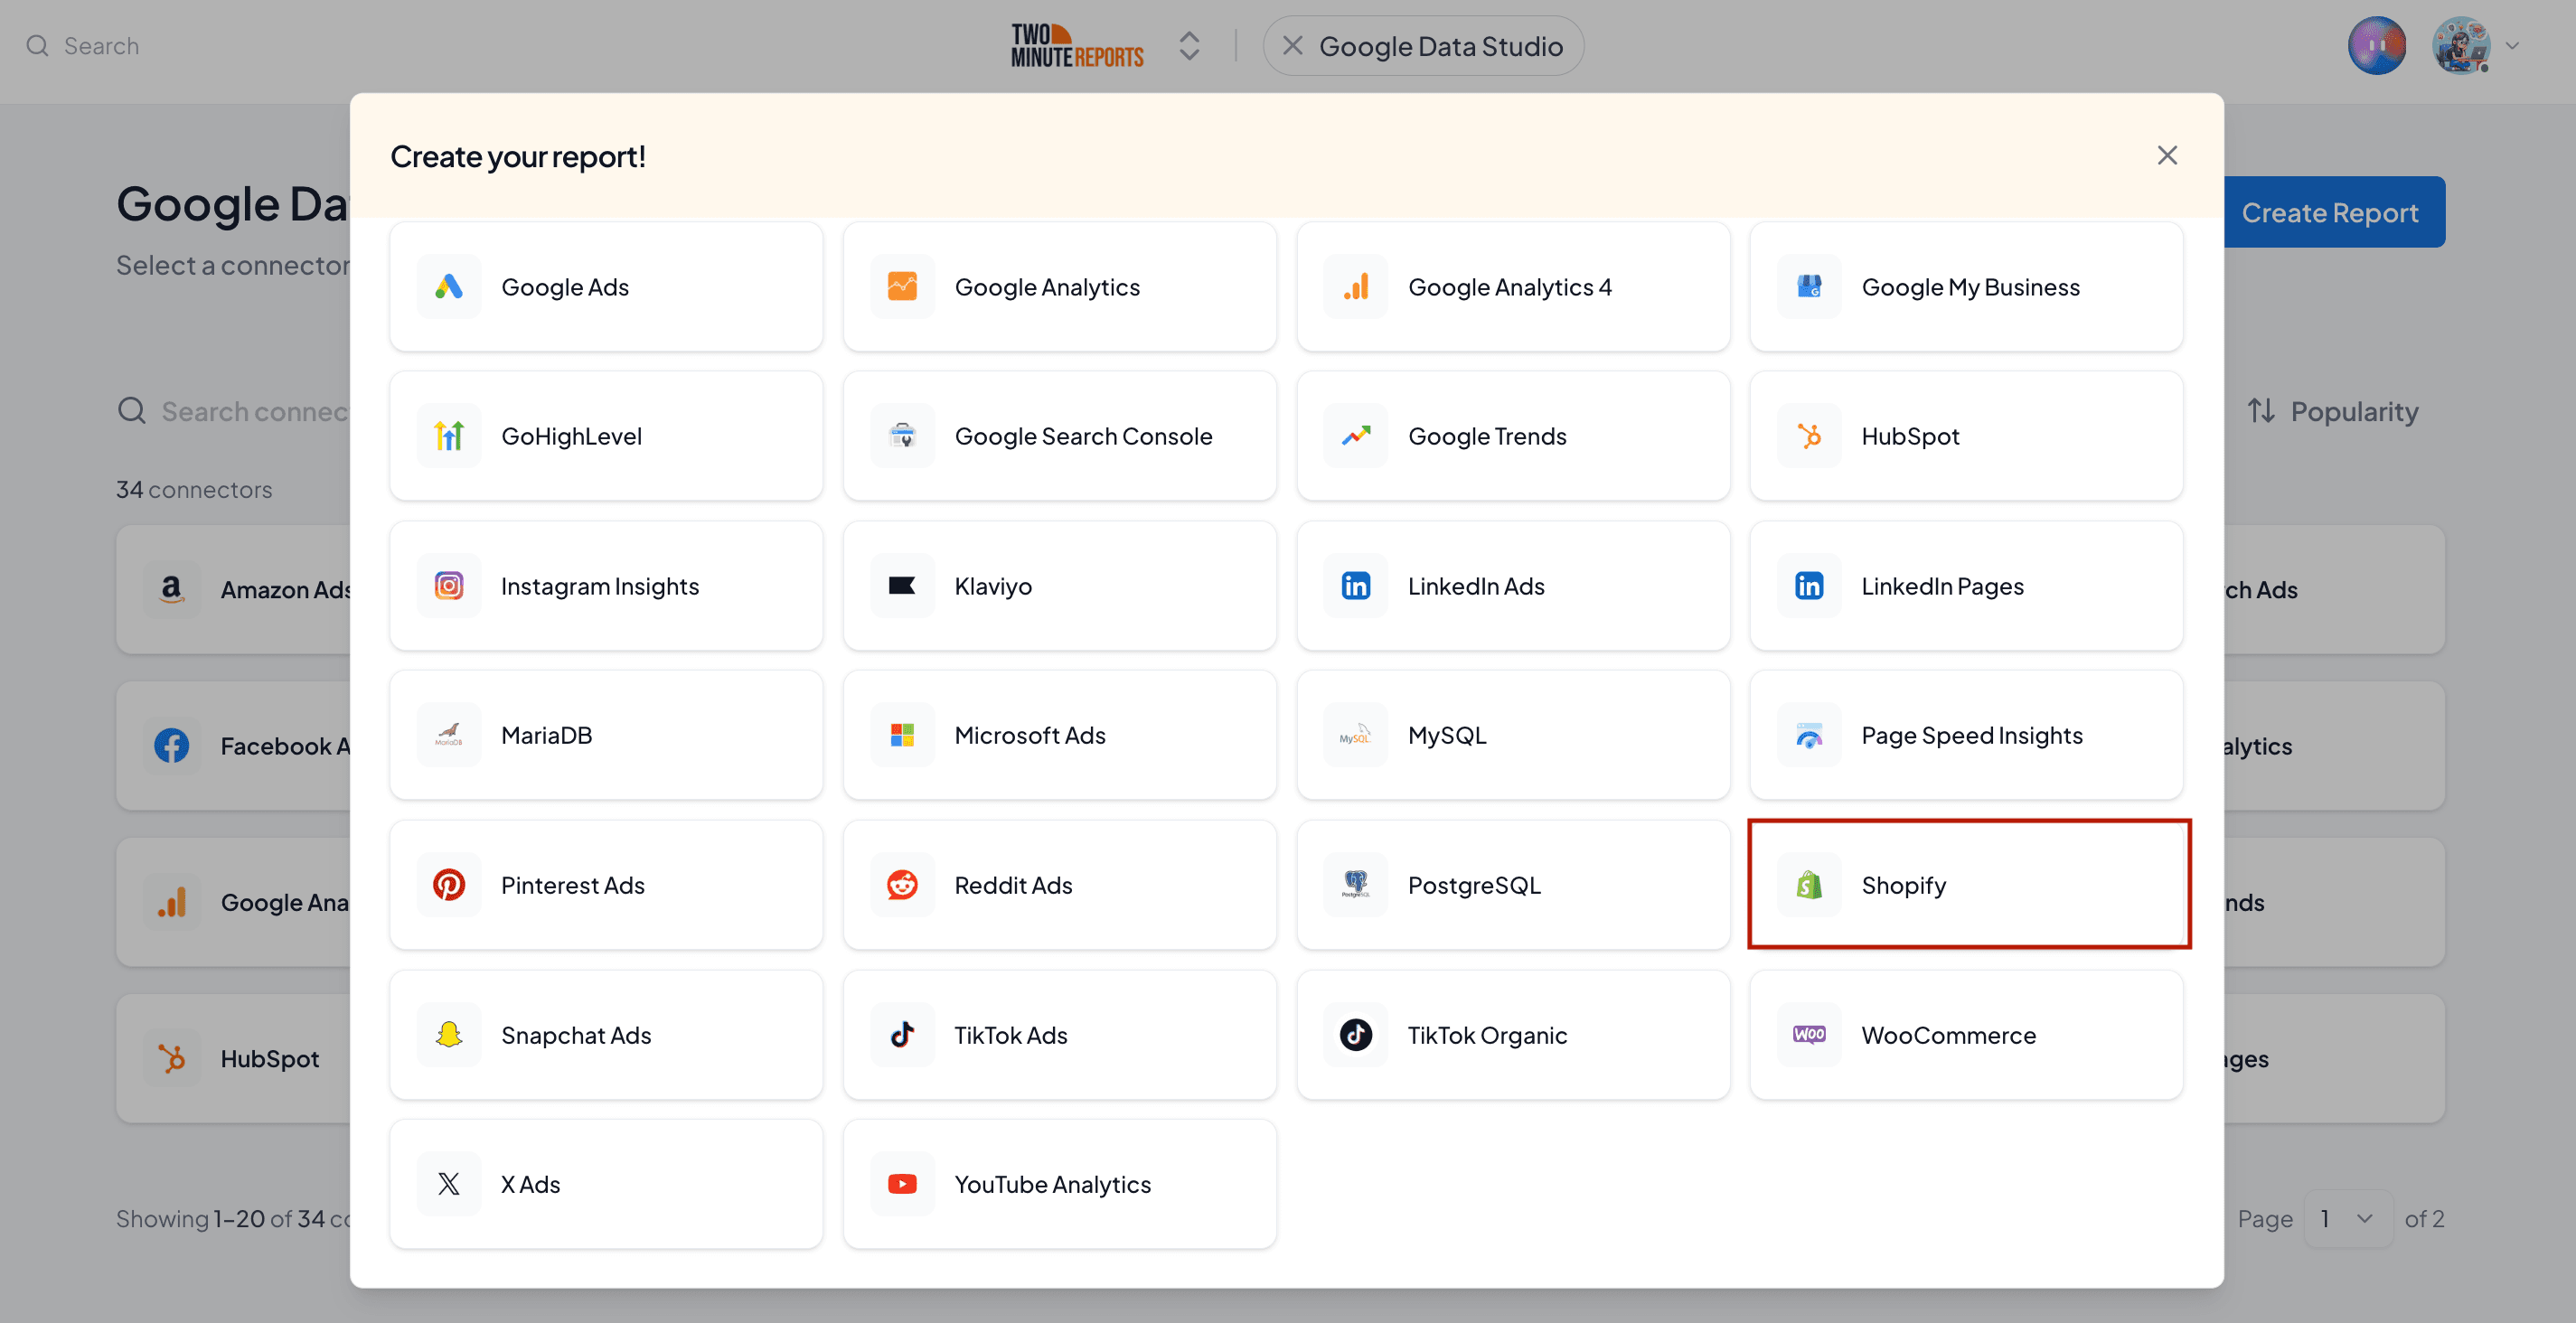
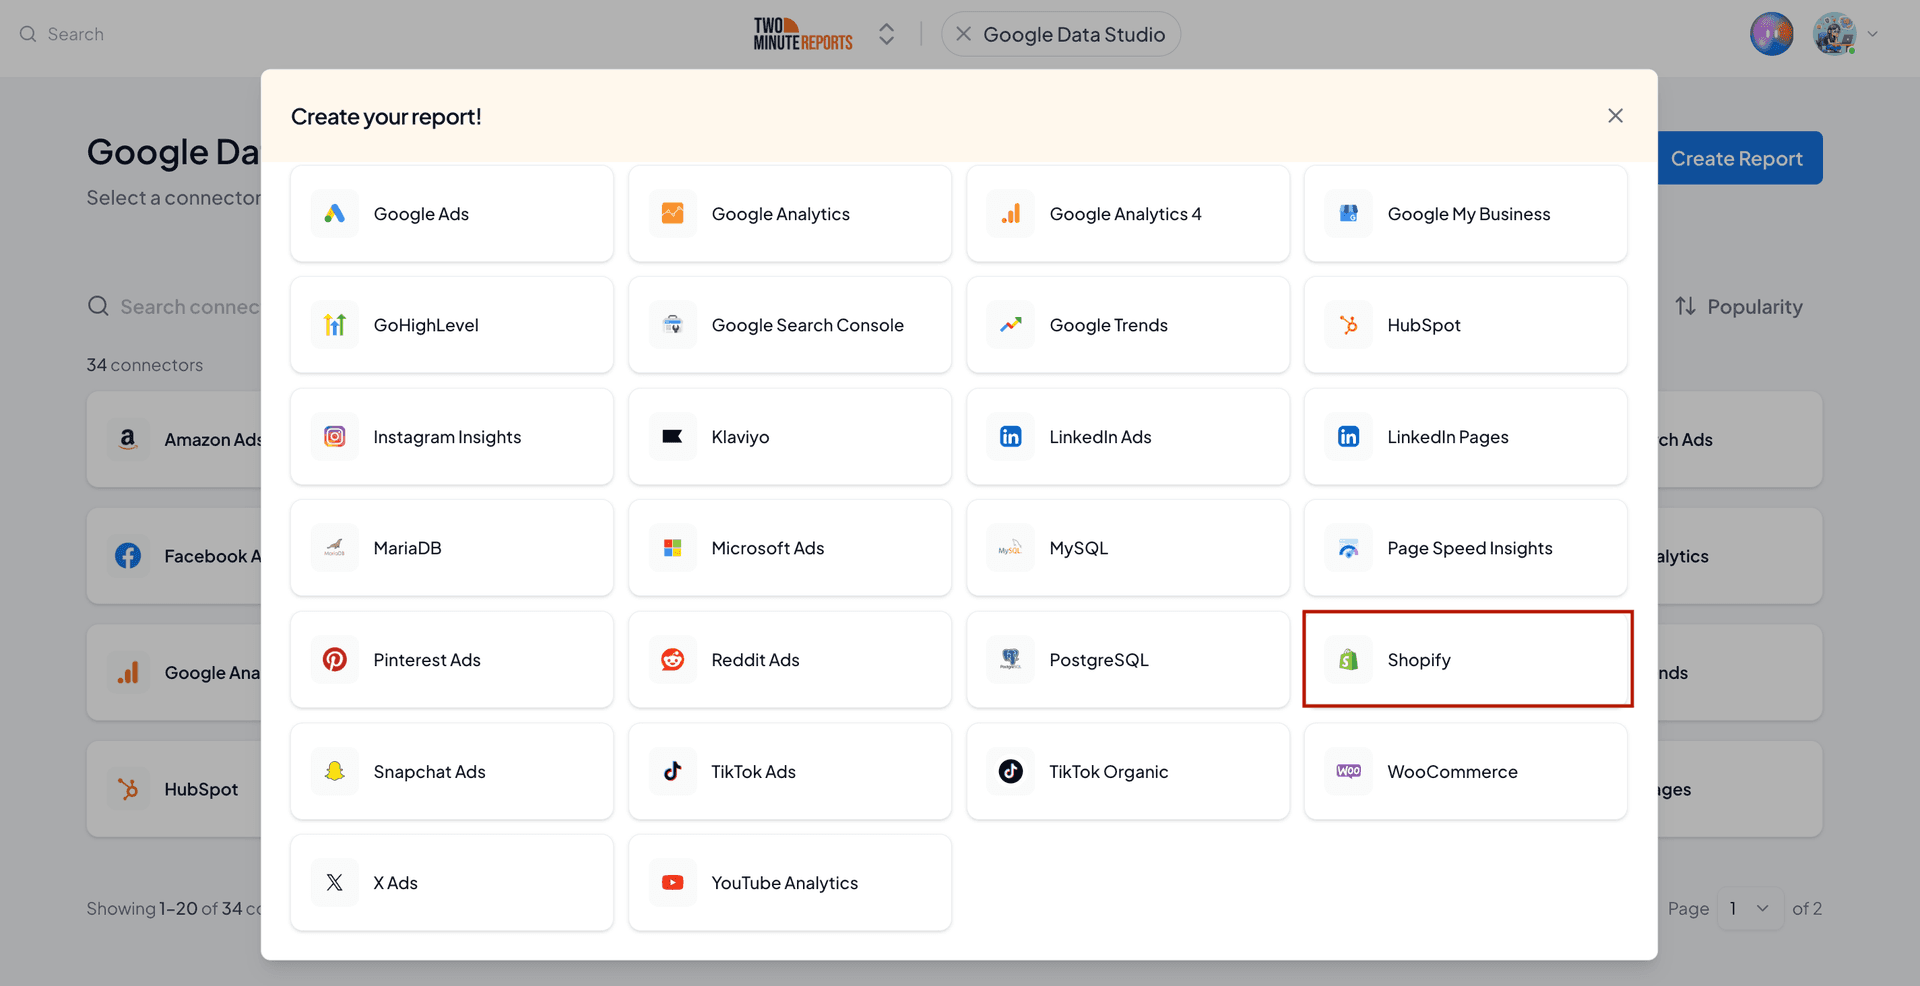
- Select the Shopify Data Studio connector from the list.
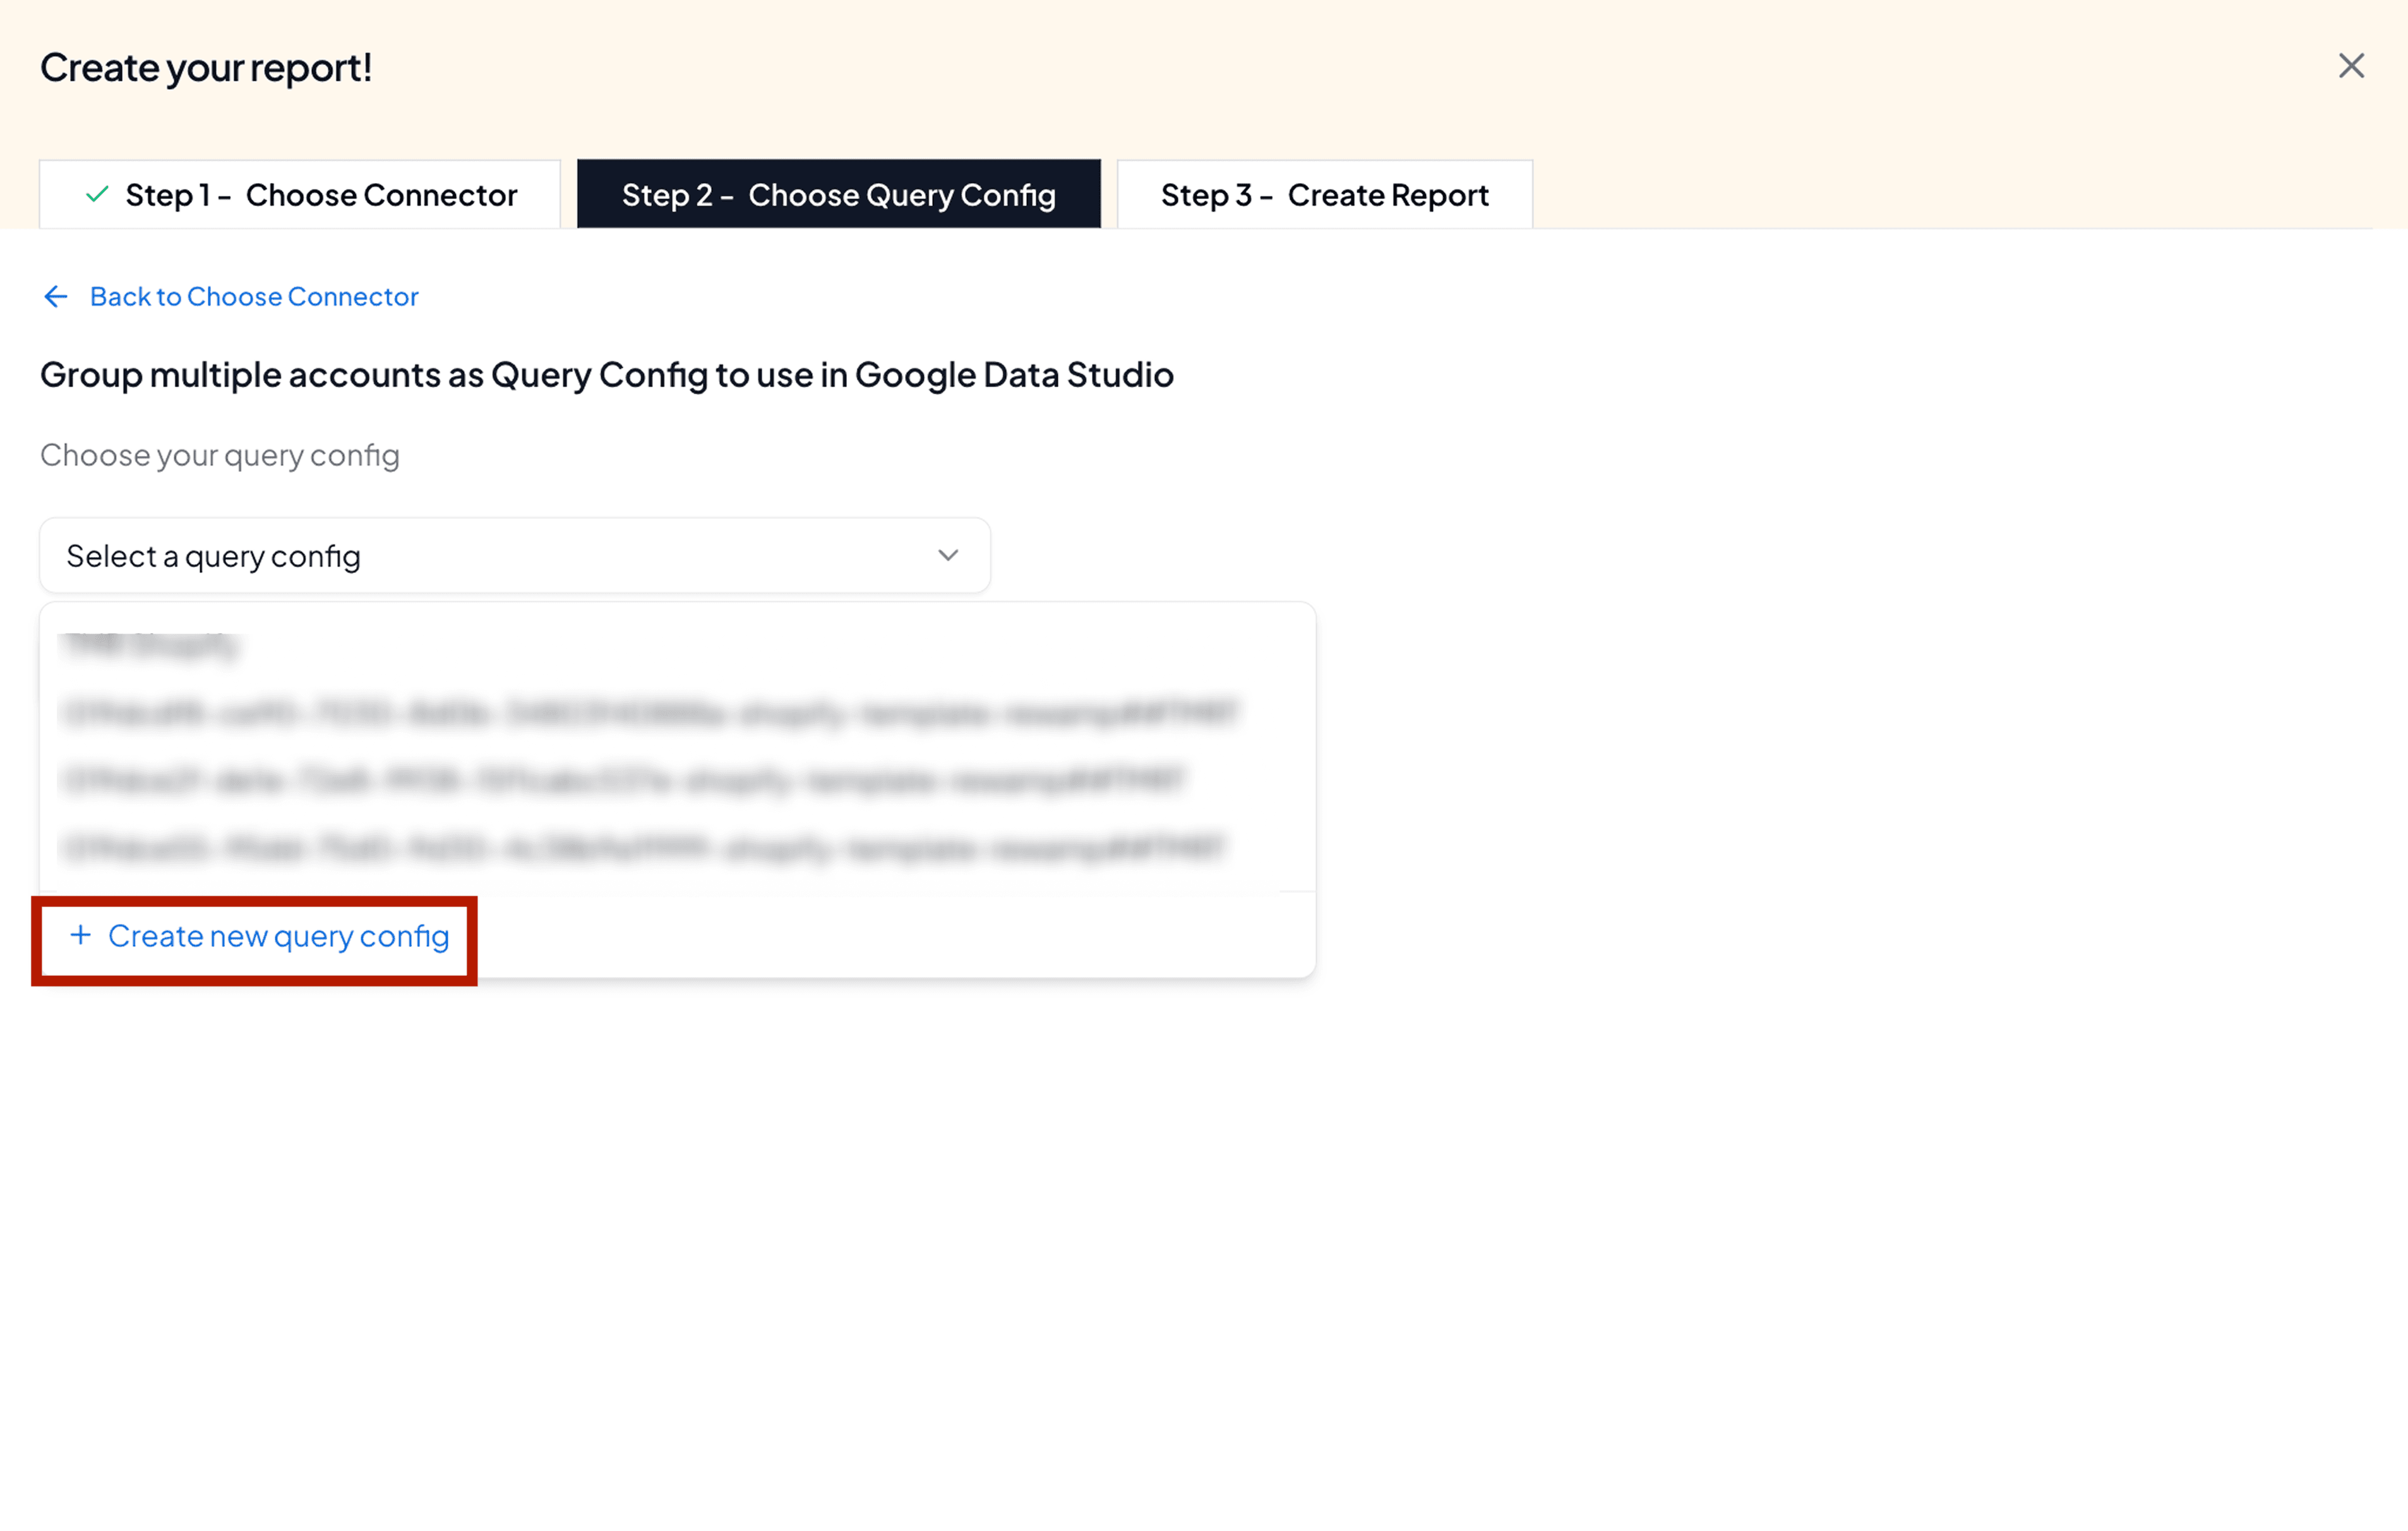
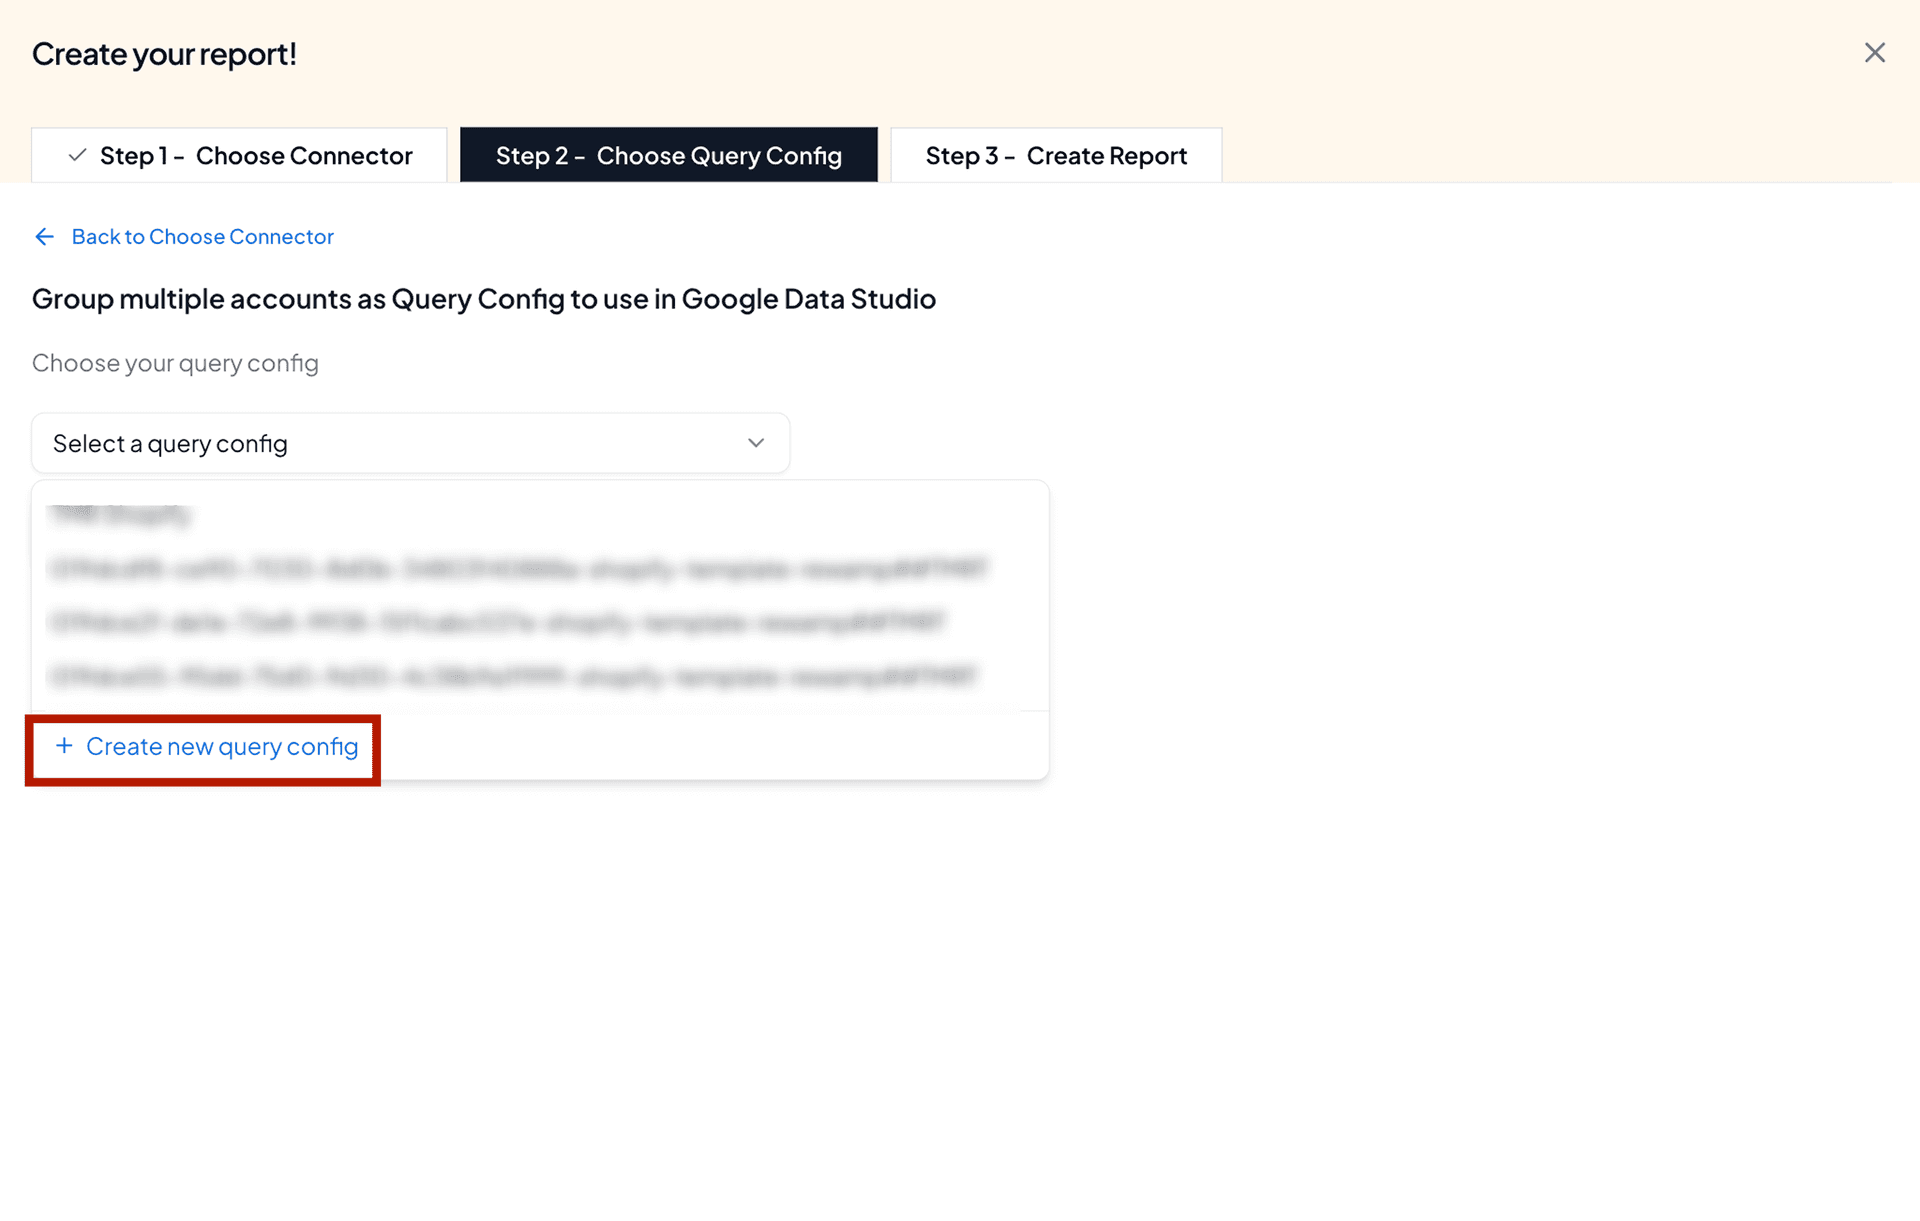
- In Step 2 (Choose Query Config dropdown), click +Create new query config.
Query Config lets you group multiple accounts, making it easier to access centralised insights in your Data Studio dashboard.
- Once you click Create New Query Config, you can specify the name of your Query Config and select the required Shopify accounts to connect to Looker Studio. Click Save.
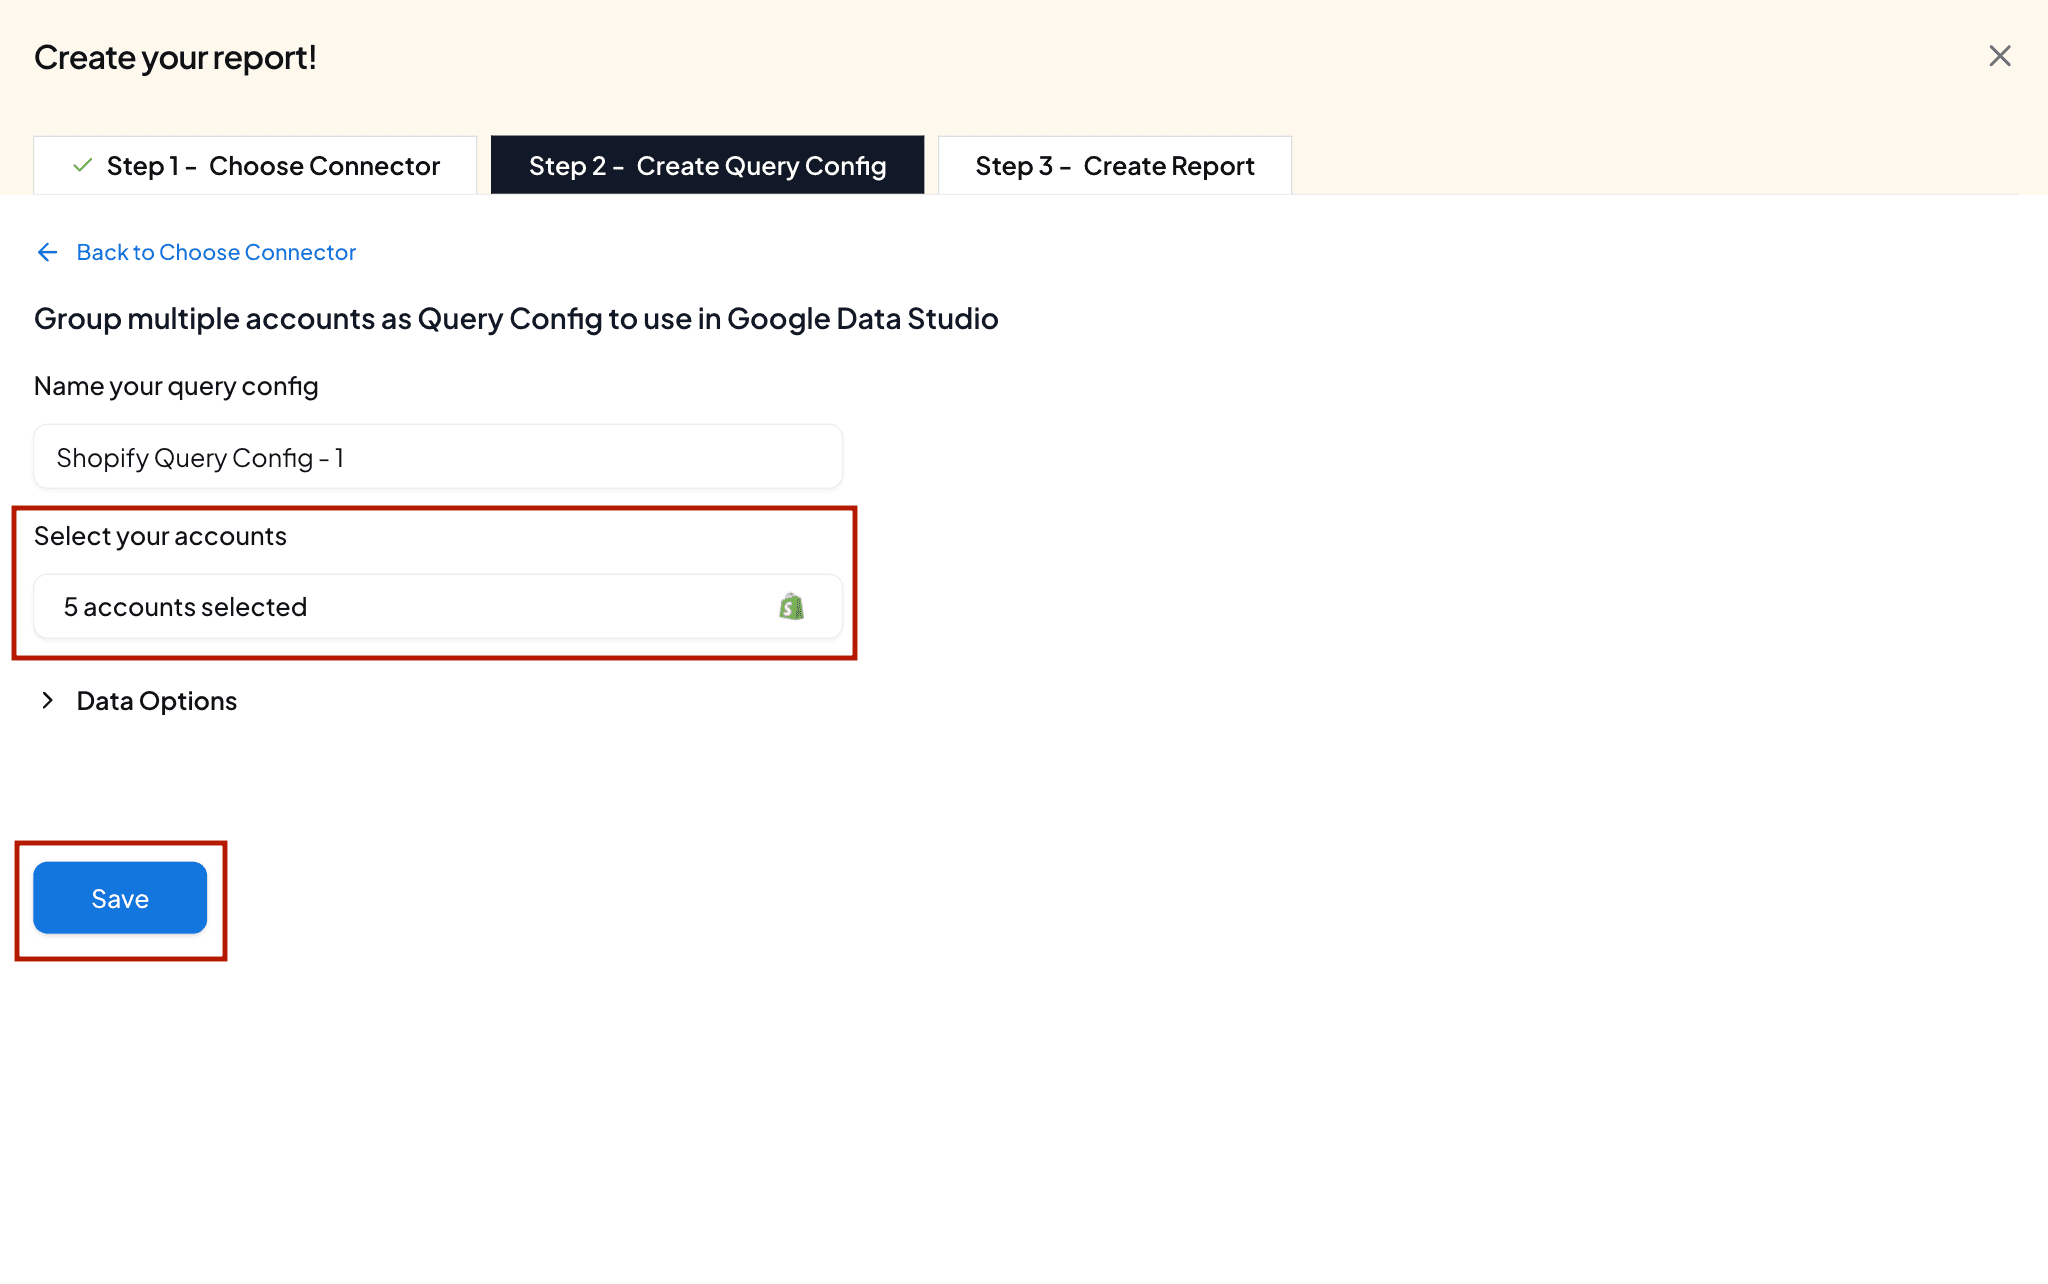
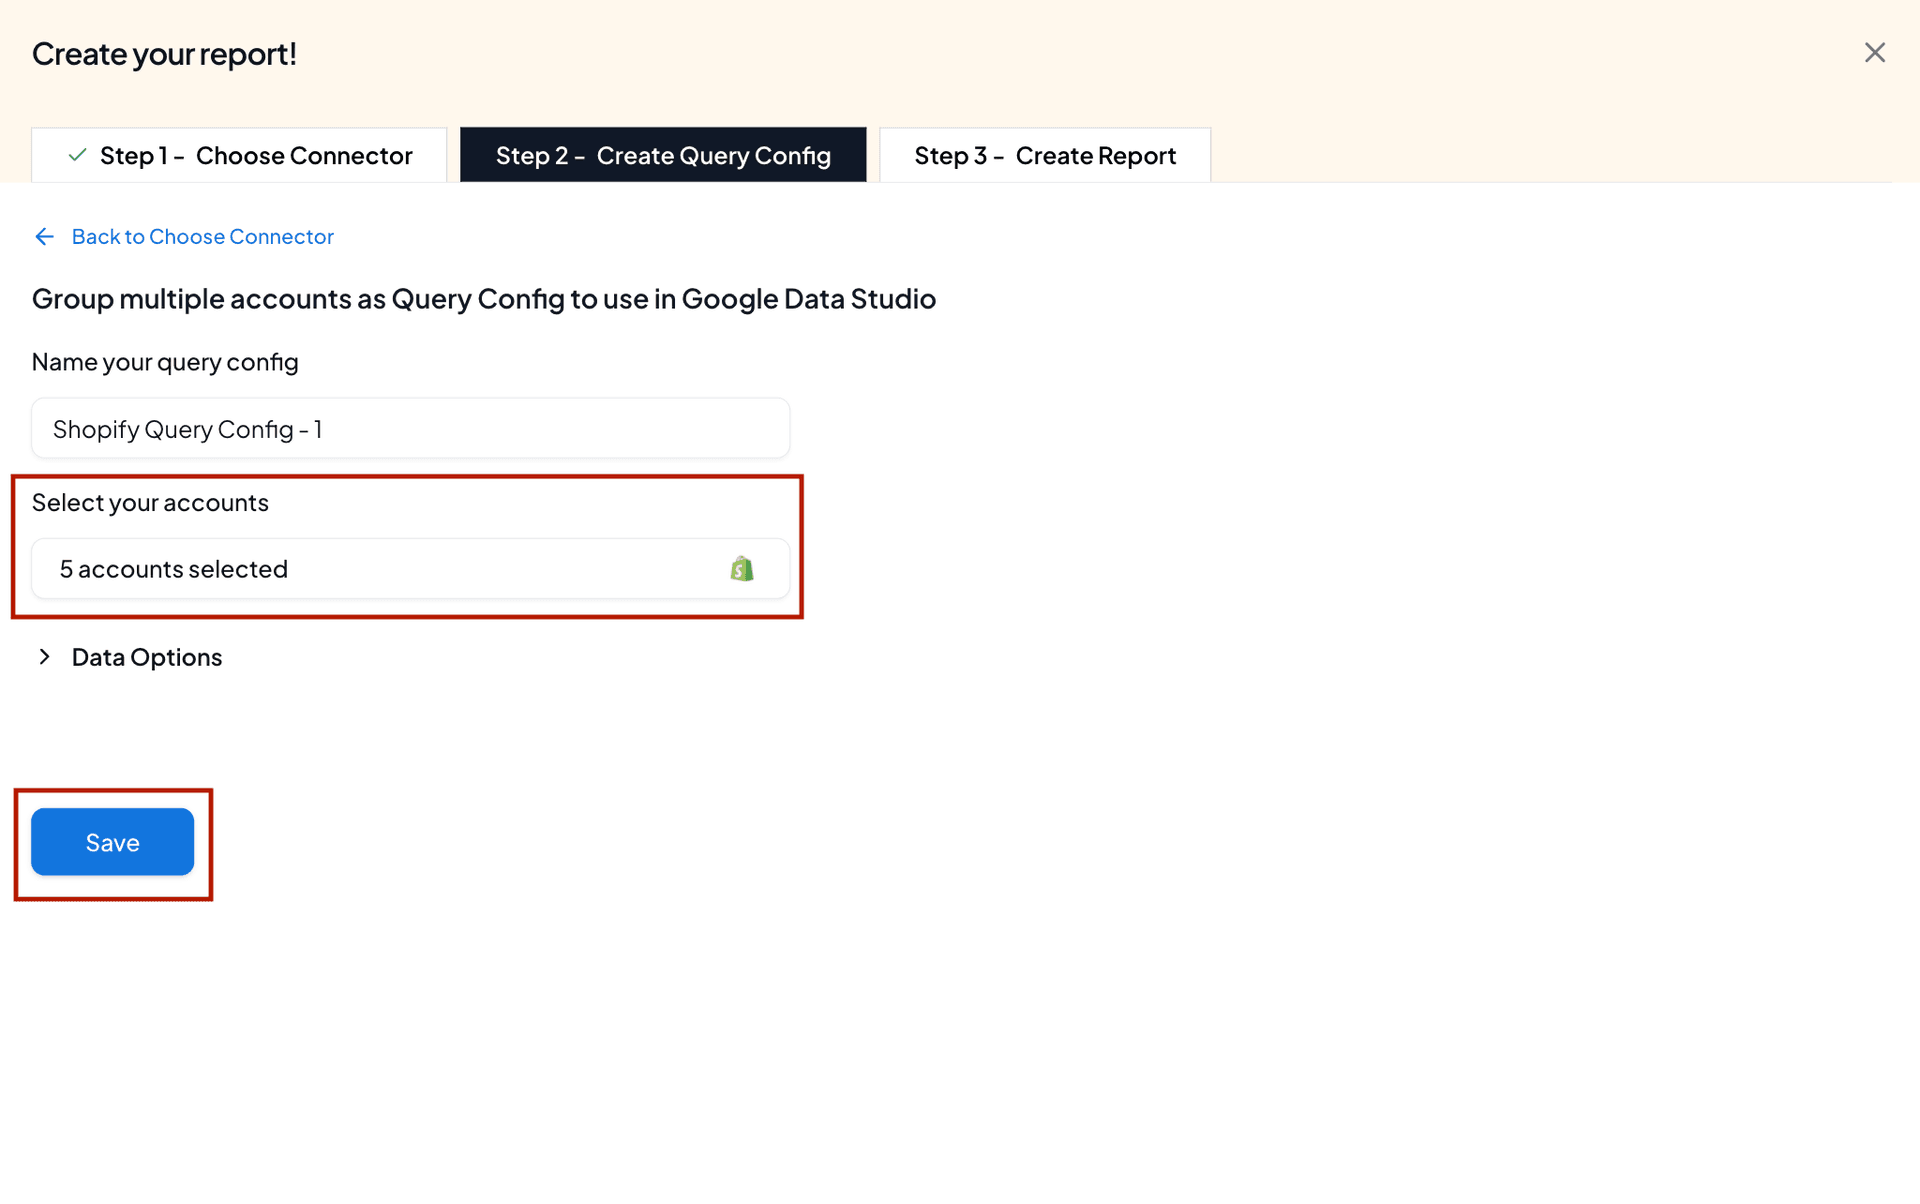
- Then, click Create from scratch to build your Shopify dashboard in Data Studio.
Step 3: Build Your Shopify Dashboard in Data Studio
- Now you’ll land on the Data Studio dashboard.
- Select your team and your Query Config (Shopify Query Config – 1). Click Connect to continue.
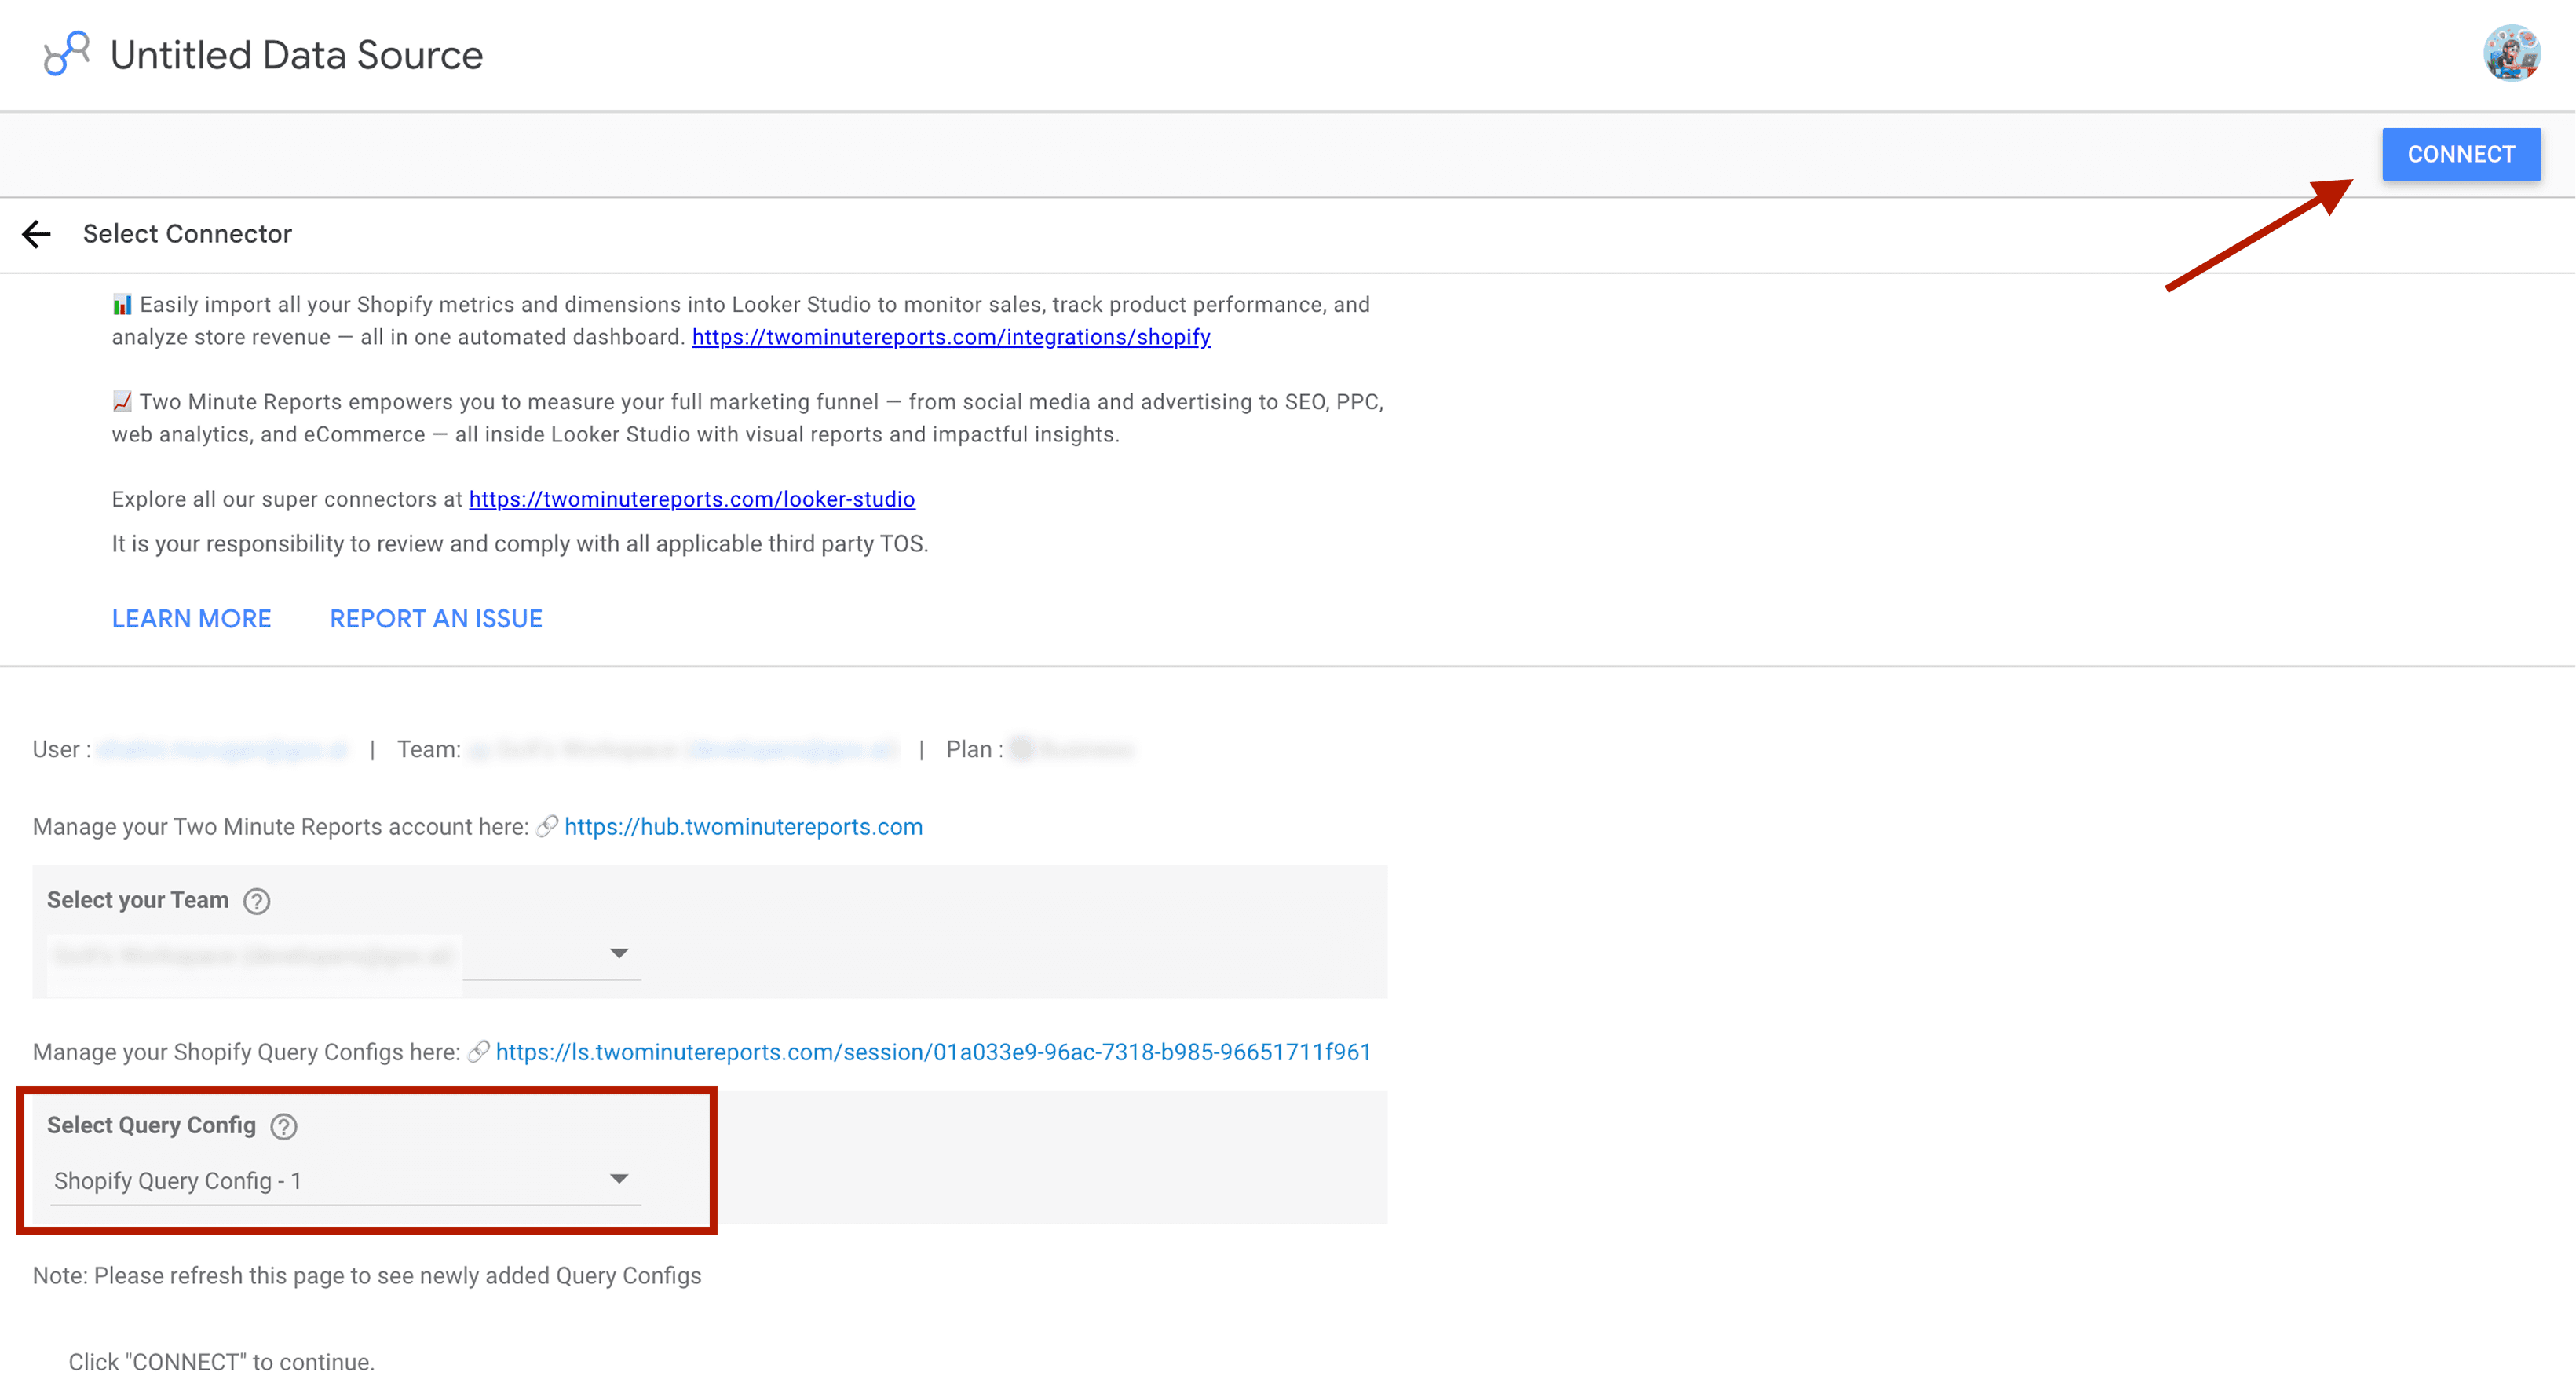
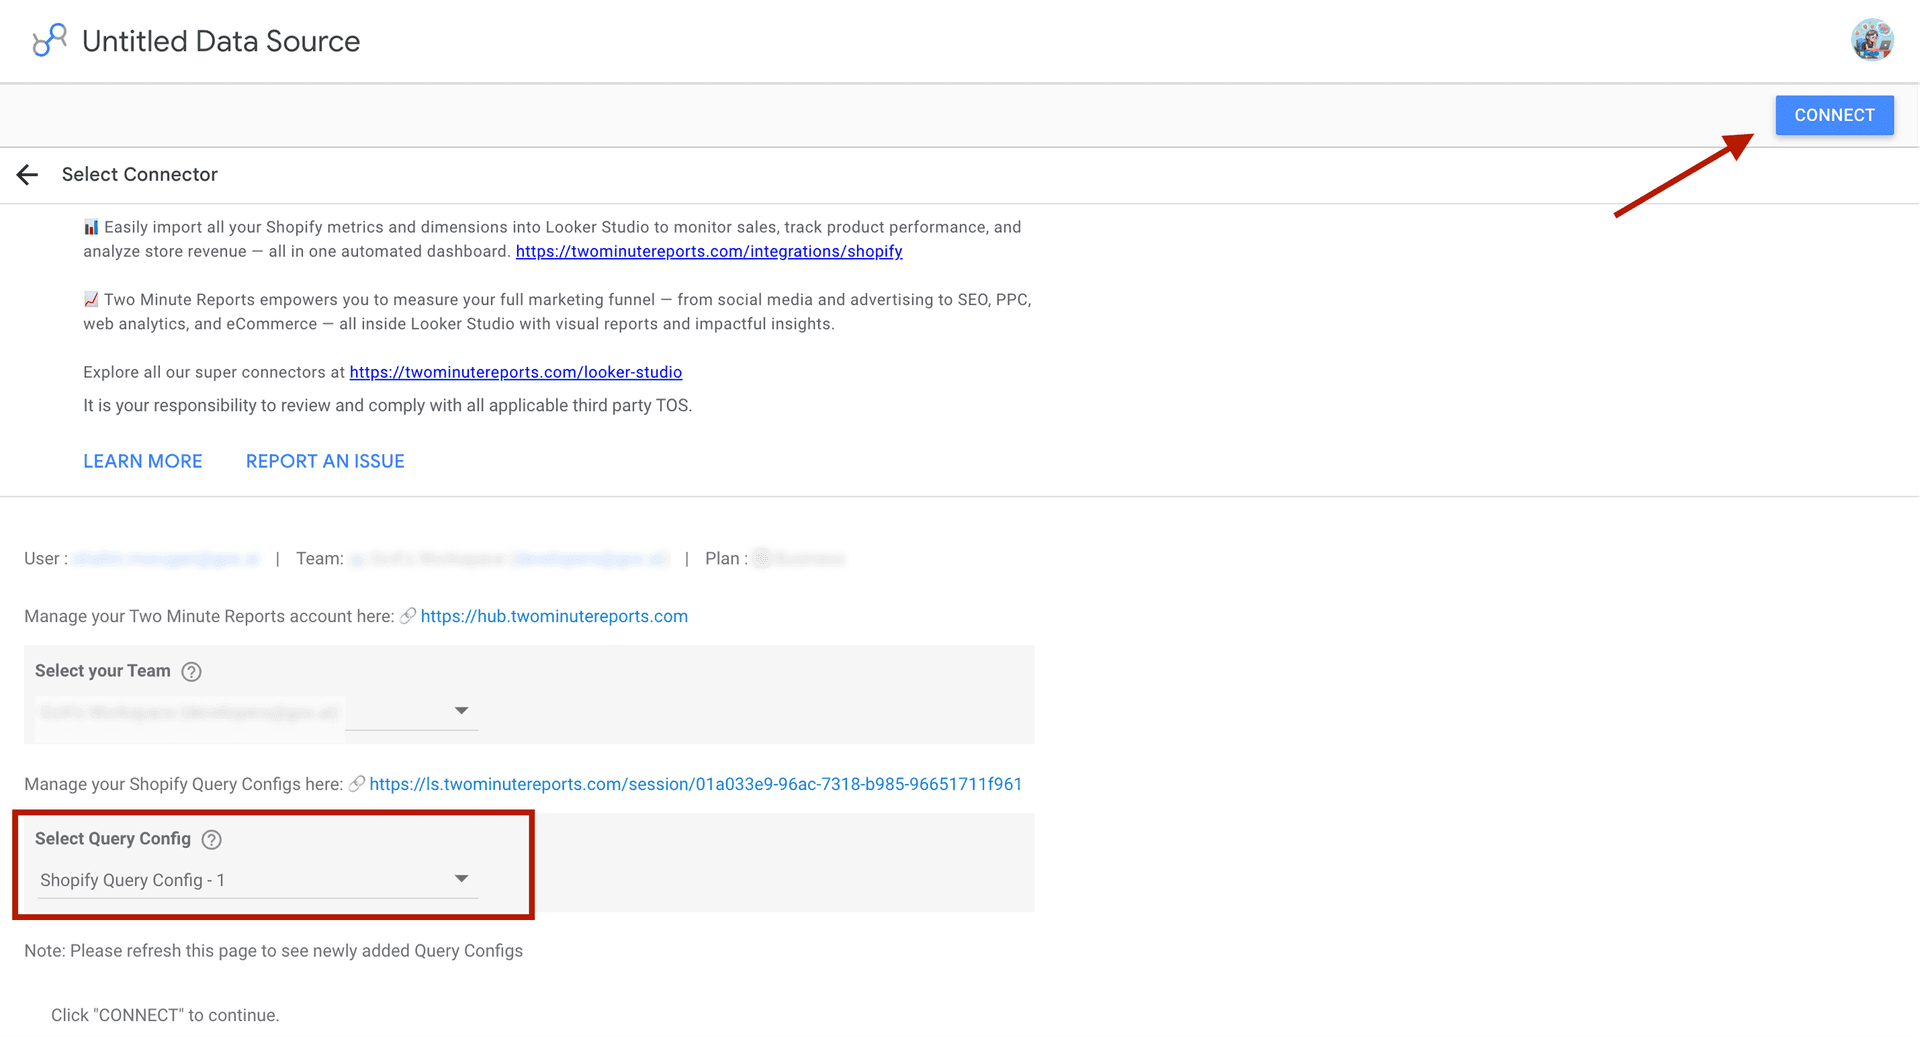
- Review the Shopify metrics and dimensions to be included and click Create Report.
- Now, you can add relevant charts, drag and drop metrics, include filters, date ranges and dimensions to customize your Shopify dashboard in Looker Studio.
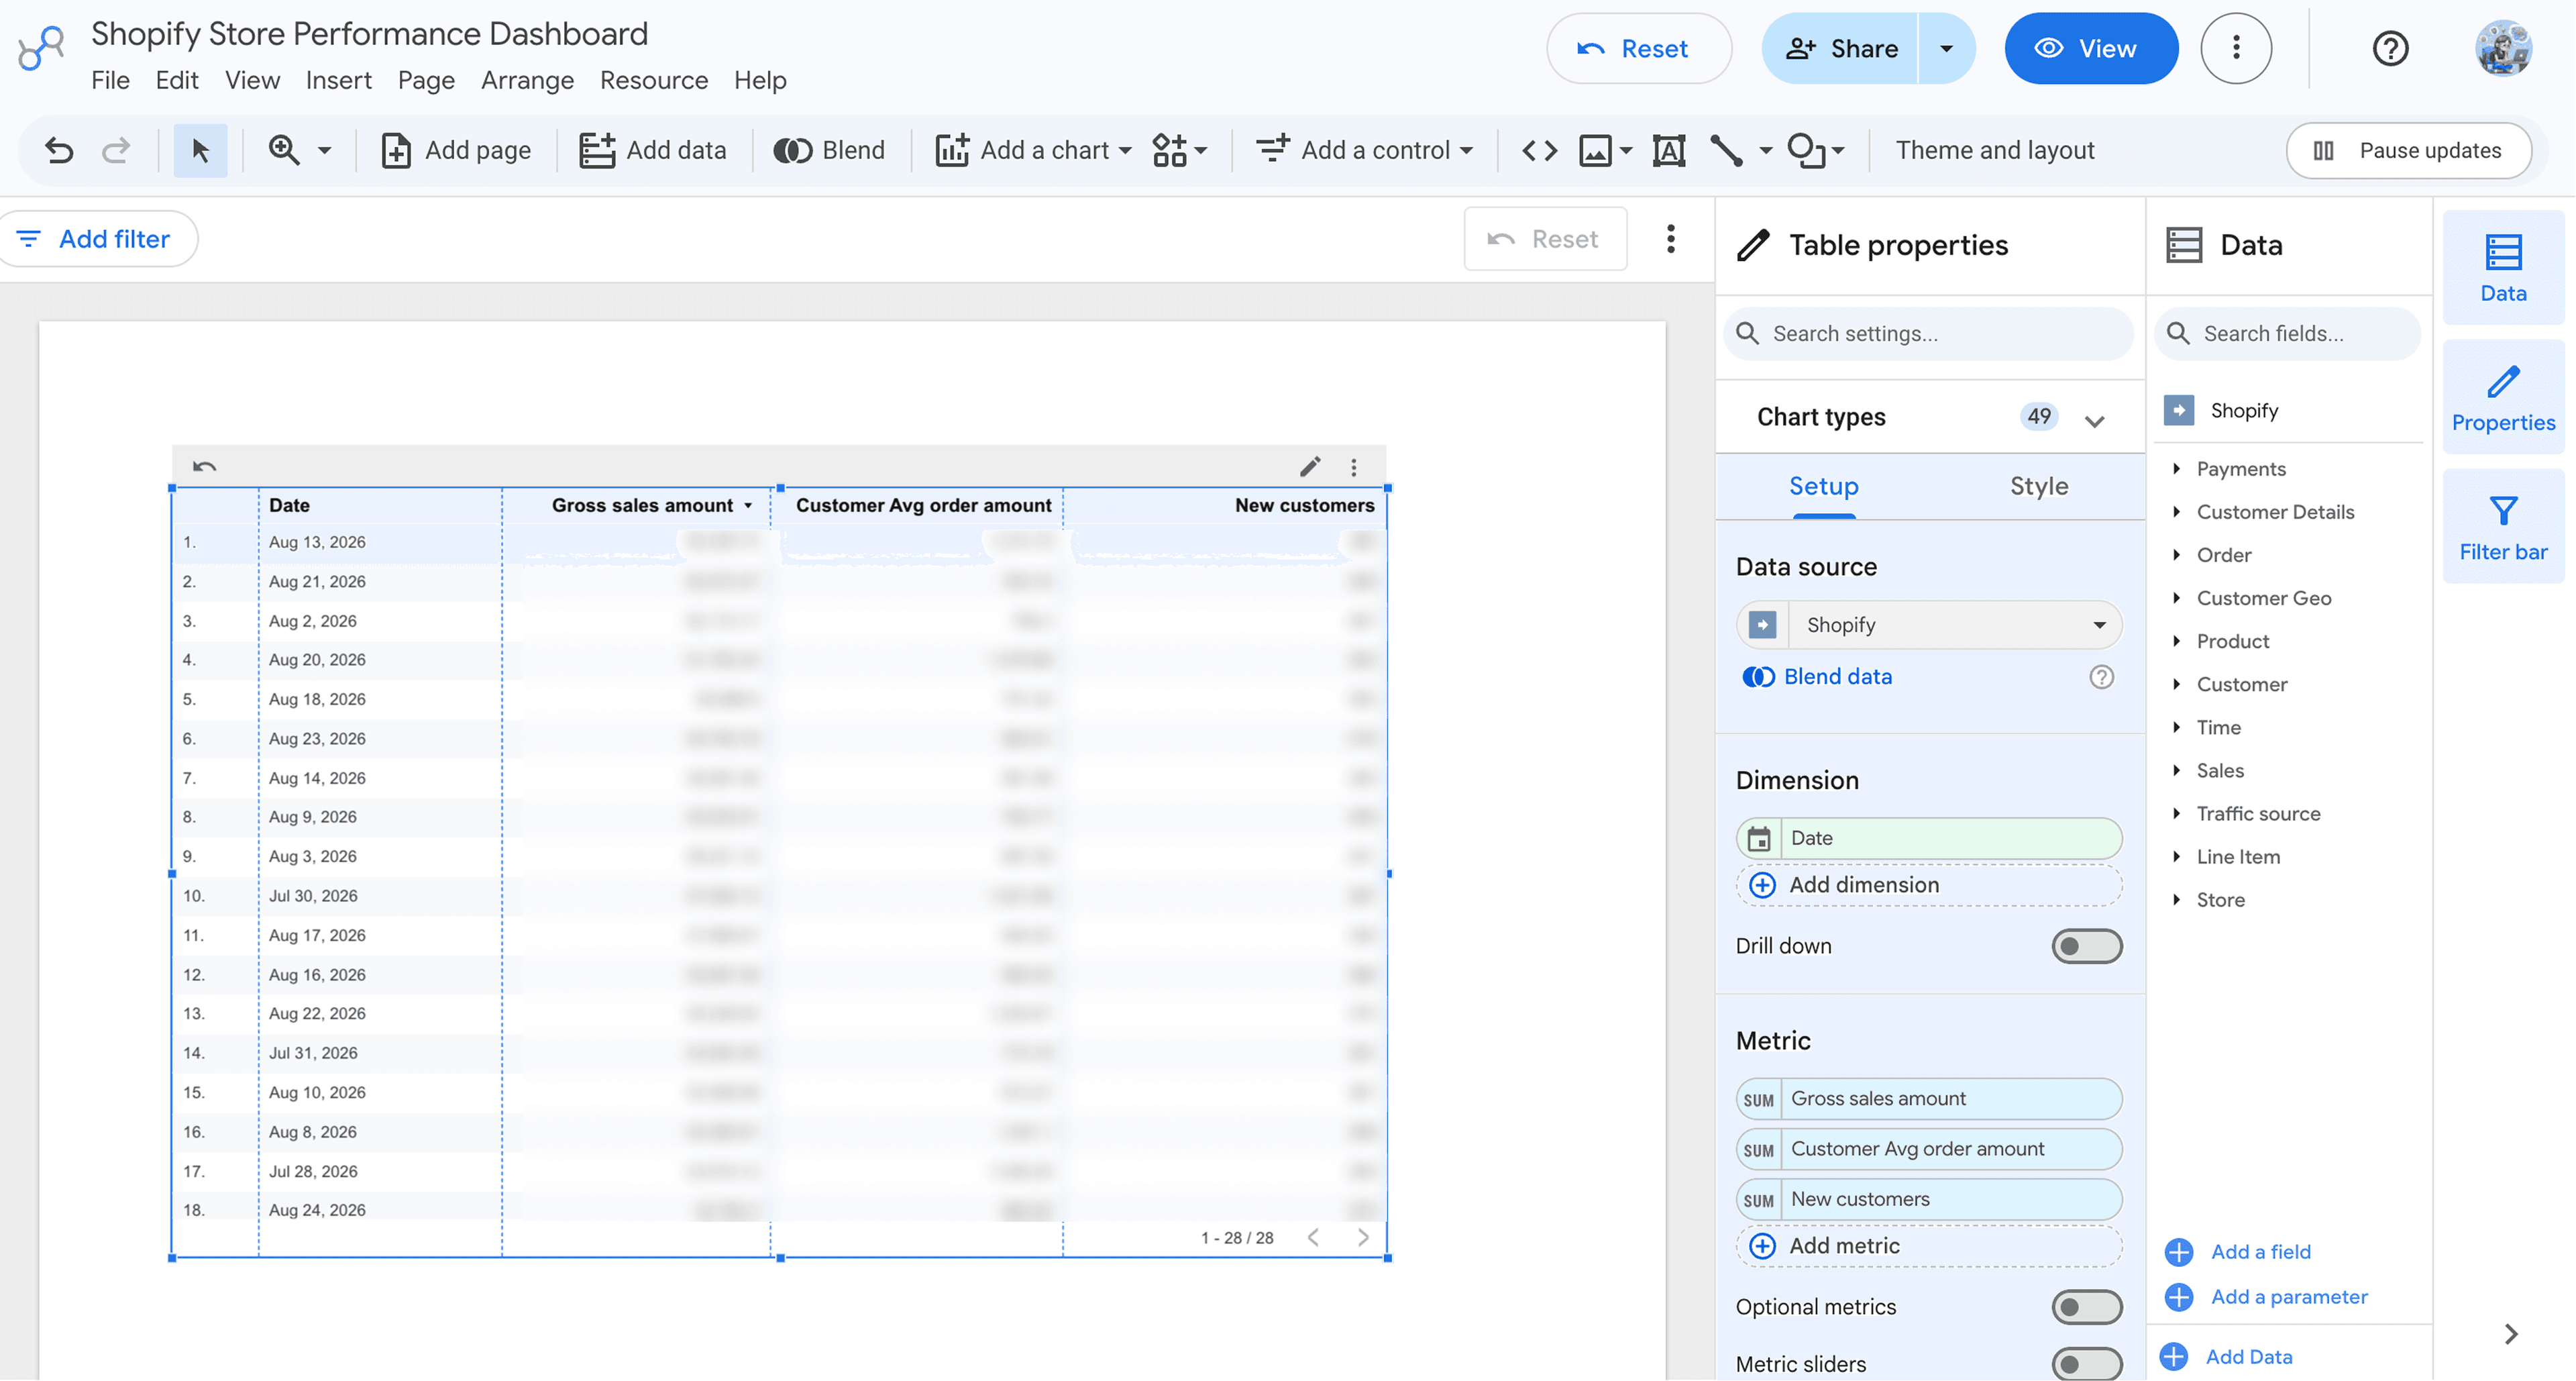
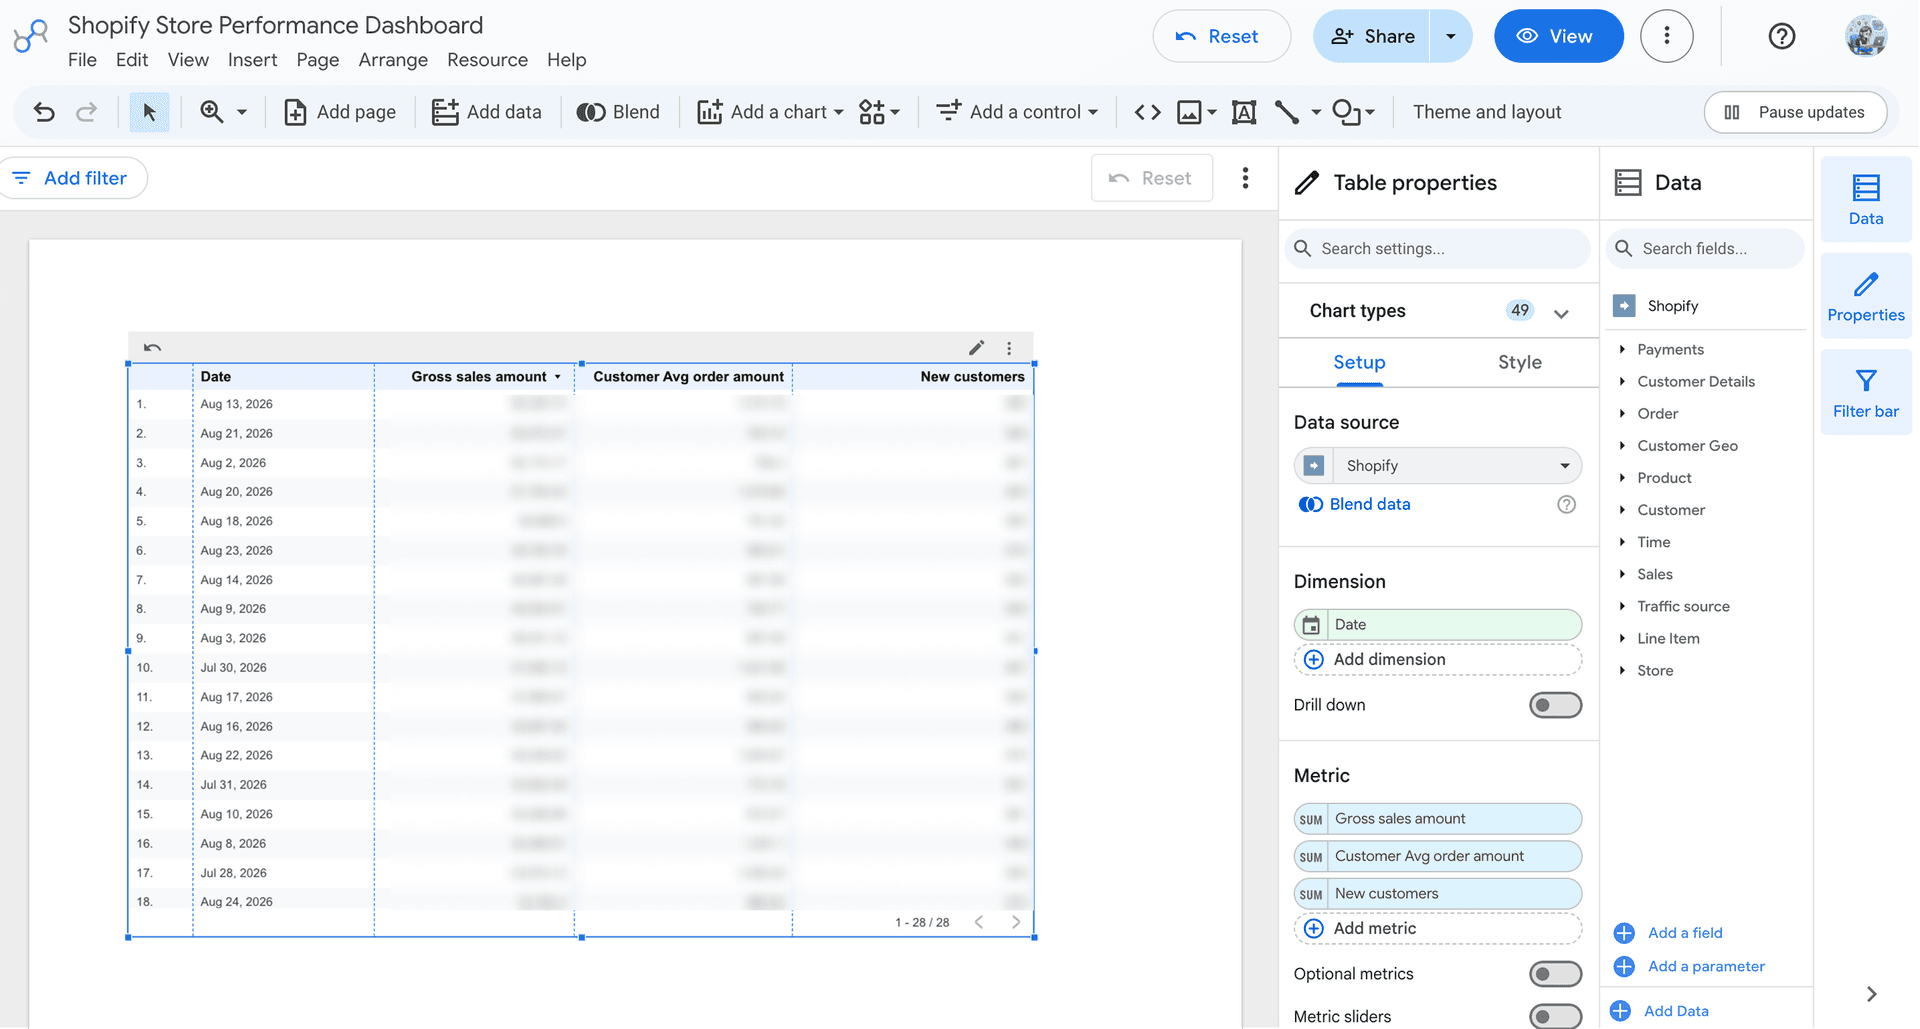
That’s it. You can insert any type of visual element to showcase your Shopify store performance. Just select the chart type, and the data flows in automatically, helping you track the latest performance insights in one place.
Once your Shopify data is connected to Looker Studio, you can track key metrics such as average order value, order volume, items per order, discount rate and return rate over time. Shopify benchmarks vary significantly across industries, with median AOV ranging from $38.29 to $153.54, median orders per store ranging from 626 to 8978, and return rates by order count ranging from 0.54% to 4.23%.
To see how your store compares with other businesses in your industry, explore our Shopify benchmarks.
Method 2: Connect Shopify to Data Studio using Pre-built Templates
With Two Minute Reports’ pre-built Shopify templates for Looker Studio, you can build a ready-made dashboard and share it with your client in minutes.
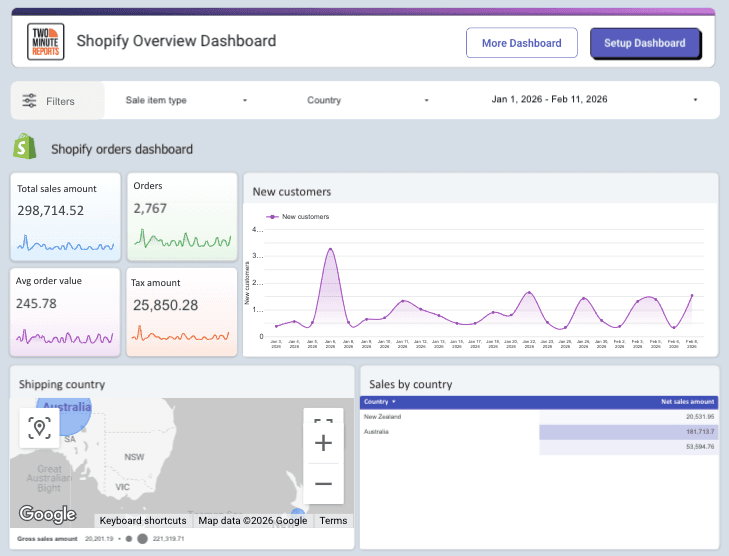
For this workflow, let us choose the Shopify Overview Dashboard. Here’s what’s inside the template:
- Sales Overview: Get an instant snapshot of your Shopify store with KPI scorecards for Total Sales, Orders, AOV, and Tax amount.
- Sales Trends: Track sales performance over time to understand how revenue changes across different periods, identify new vs returning customers, and spot trends that can help you evaluate store performance.
- Order Performance: Monitor orders by financial status, fulfilment status, etc to understand purchasing patterns, and measure how consistently your store generates orders.
To connect your data:
- Click Get Template for Free to open the Shopify Overview Dashboard.
- Click Use My Own Data and select your team and Shopify Query Configuration created in Step 2 (Method 1)
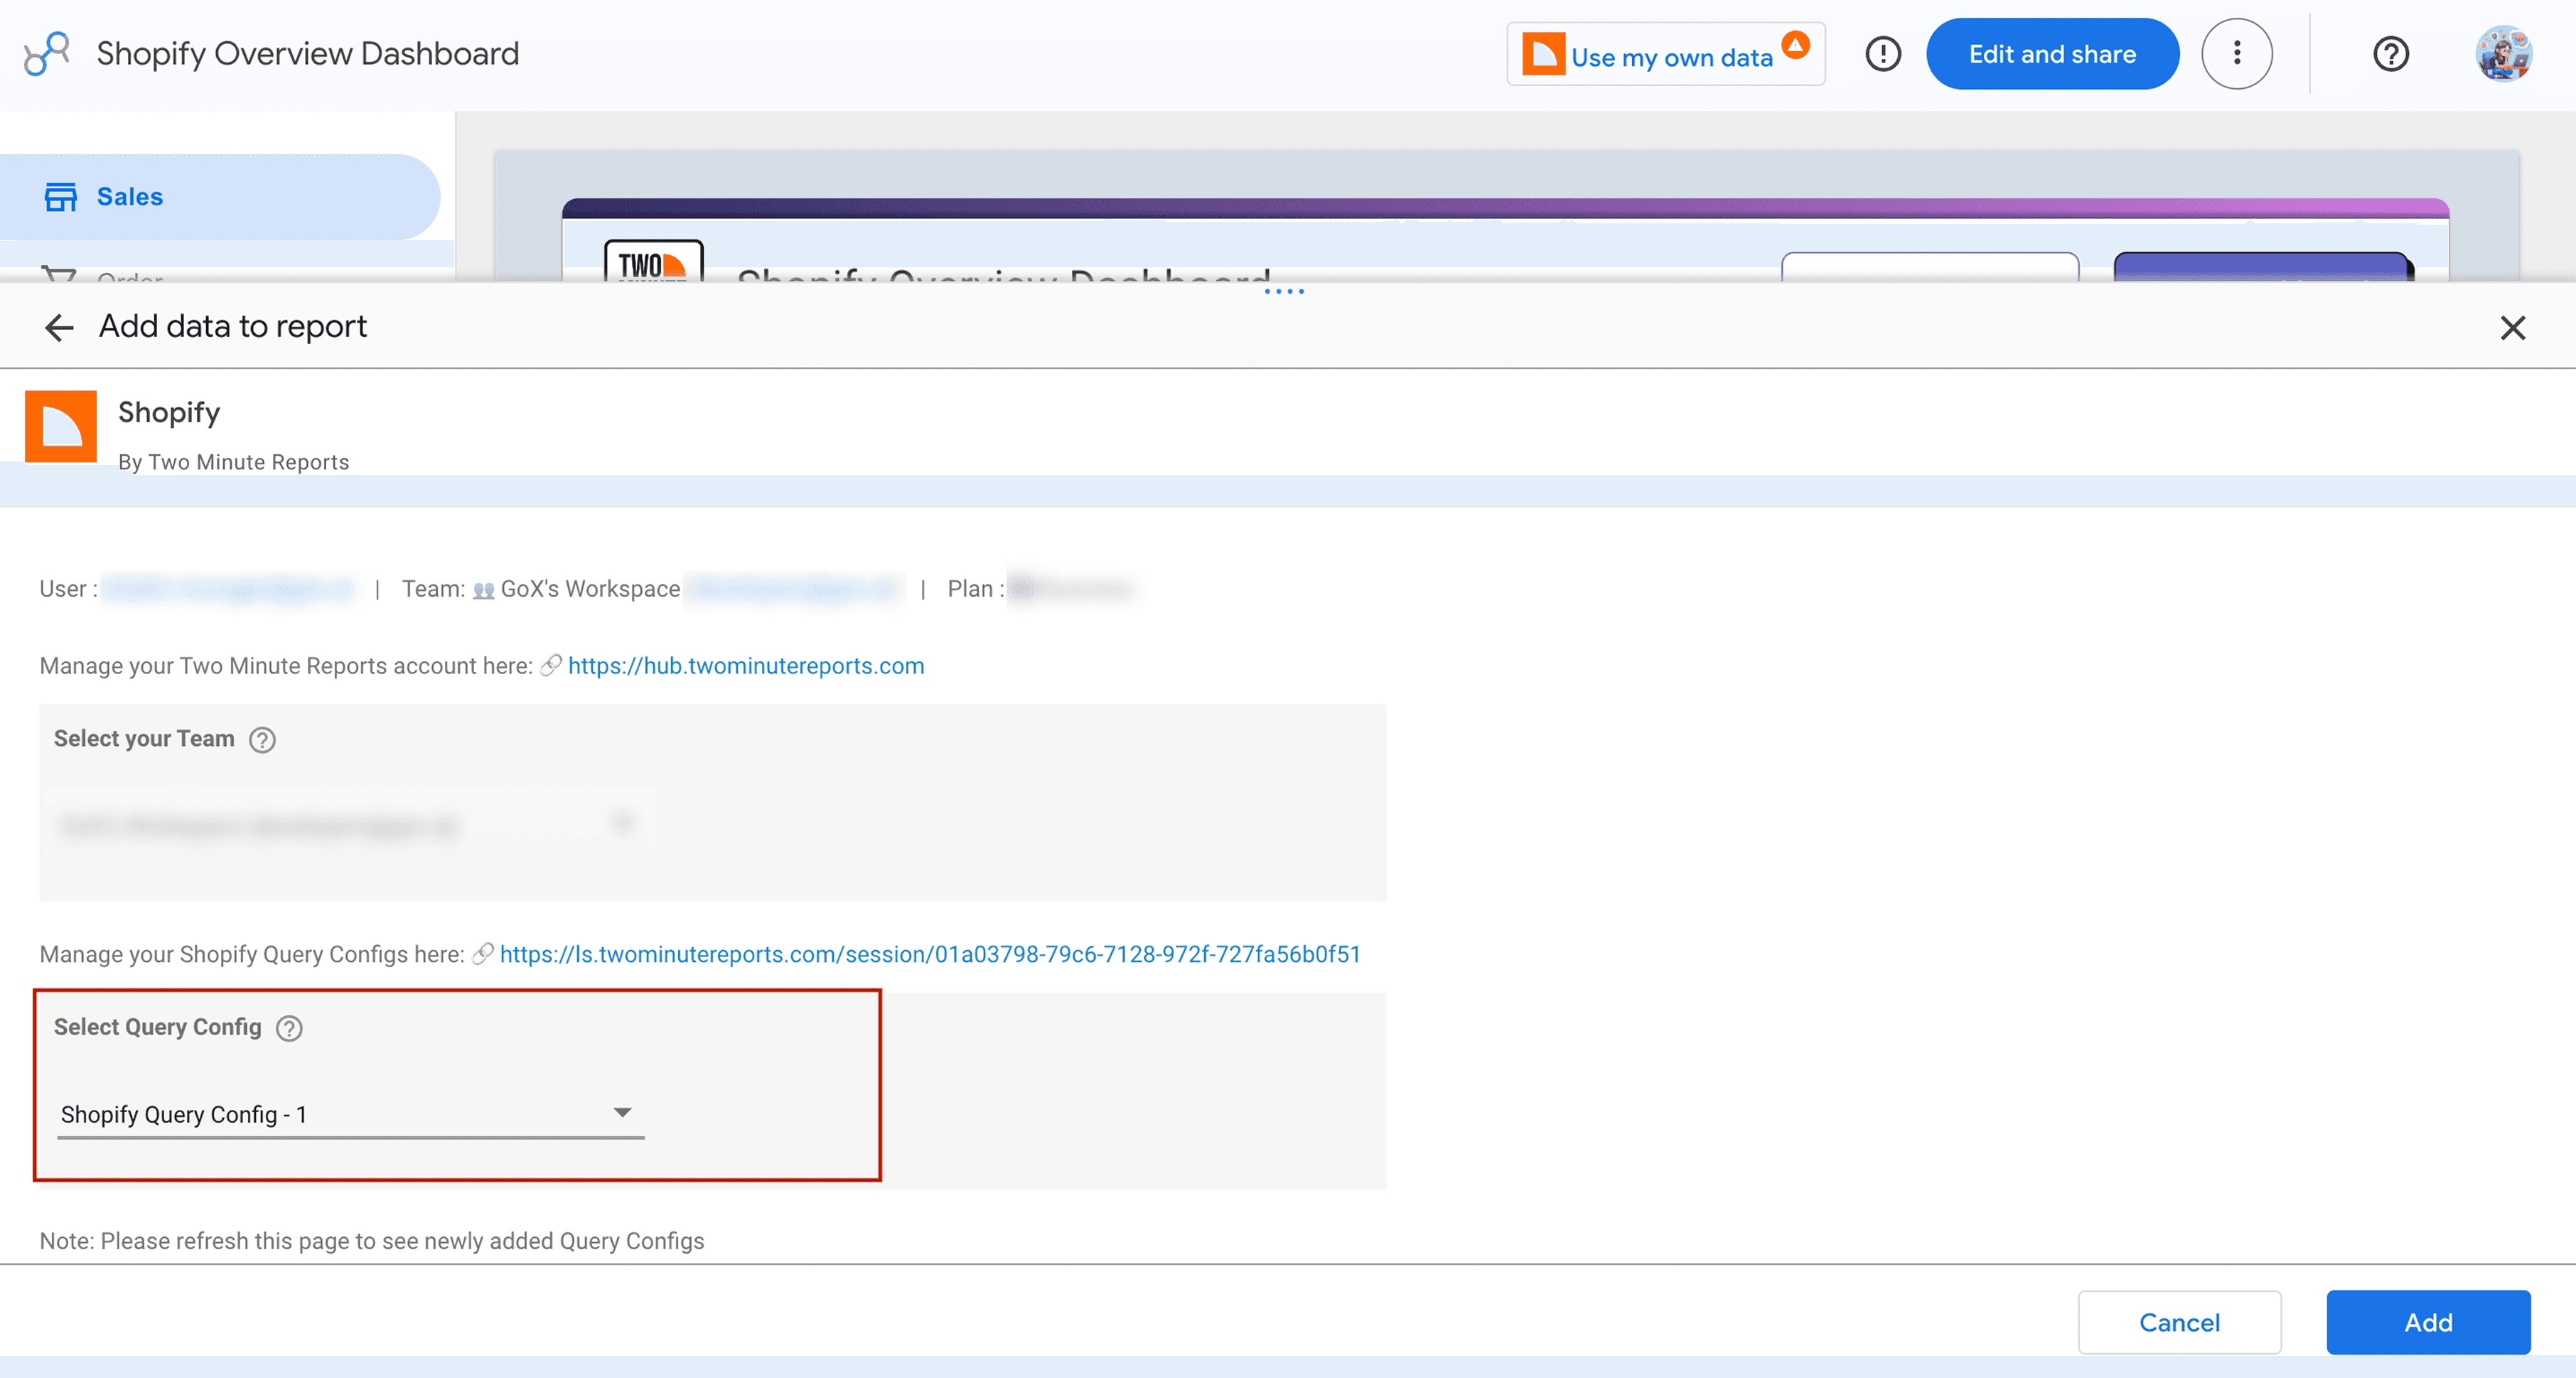
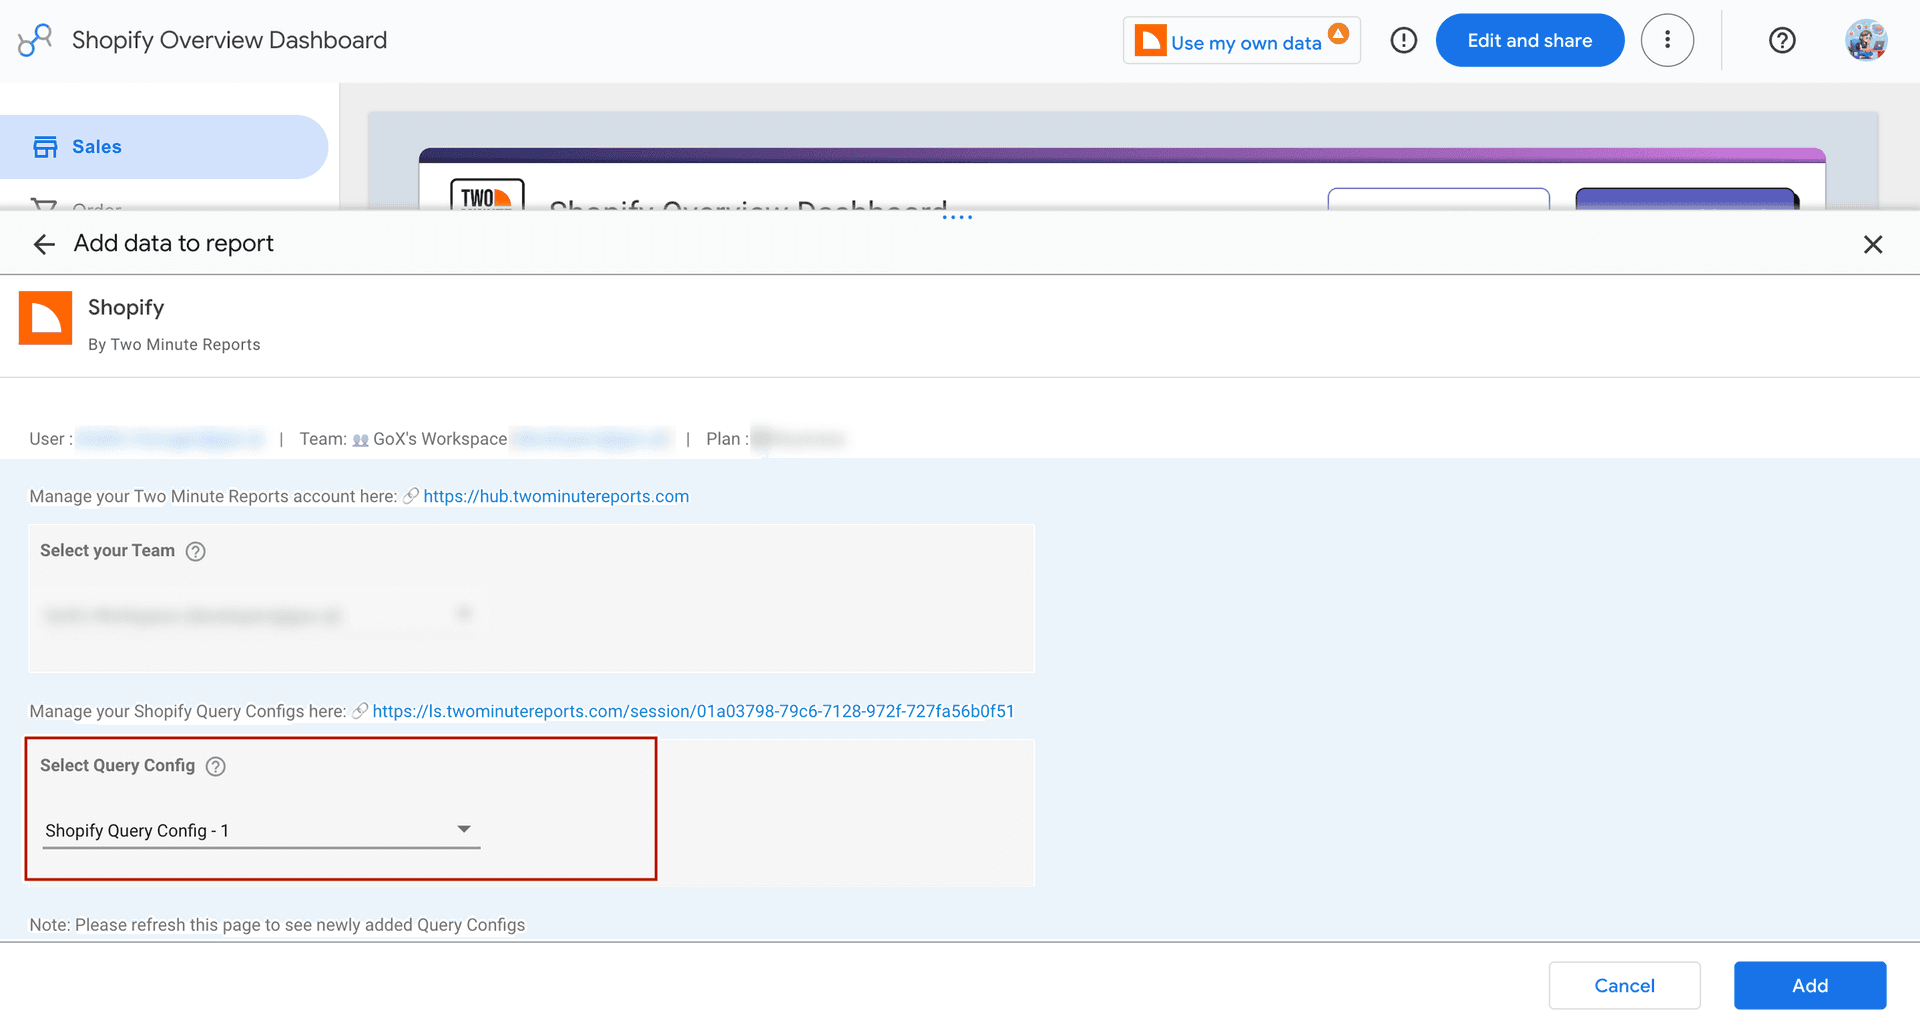
- Click Add. Your Shopify store data will be automatically populated in the dashboard.
- Click Edit to customize the layout, drag and drop metrics and adjust the visual elements to match your brand.
- Once done, click Share to send your Shopify Data Studio dashboard to your clients and stakeholders.
Click the template link below to get started. It opens directly in Data Studio.
Why Connect Shopify to Looker Studio?
While standard marketing tools give you straightforward performance analytics, you won’t get in-depth understanding unless you apply customized filters and evaluate performance from a 360-degree perspective. This is where Two Minute Reports helps - by automating data extraction on a customized schedule and consolidating it in one place. Here’s why you should get your Shopify data to Looker Studio.
Easily visualize your Shopify data
Looker Studio empowers you to gain comprehensive visual insights into your Shopify data. You can easily generate interactive, real-time dashboards and reports. This facilitates seamless monitoring of crucial indicators like total sales, returns, and customer behaviour.
Refine your marketing strategies
Importing Shopify data into Looker Studio allows you to seamlessly integrate sales data with marketing reports. This integration enables you to identify the most effective marketing channels for driving traffic and sales.
Increased data accessibility and collaboration
Looker Studio facilitates effortless sharing of Shopify reports throughout your organization. Its collaborative features allow multiple users to access and edit the same report simultaneously, promoting data-driven decision-making across all departments.
How to Analyze Shopify Data in Looker Studio?
Your Shopify Looker Studio dashboard should bring together the metrics that help you understand how much you sell, what customers buy, and where your customers come from. Here are the key metrics to follow:
Ready to Connect Shopify to Data Studio?
Stop switching between Shopify reports to understand how your store is performing. Bring sales, orders, products, inventory, customer and traffic data into a single Data Studio dashboard, so you can identify what’s working, where you’re losing revenue, and make faster decisions.
Try Two Minute Reports free for 14 days and see how you can transform your Shopify data into actionable dashboards in Data Studio.
Frequently Asked Questions
First, connect your Shopify store to Two Minute Reports. Then, select your Shopify account and create a Query Config with the data you want to use. Once connected, your store data will be imported into Looker Studio, and you can create dashboards to track sales, orders, products, inventory and customers in one place.
Yes, with Two Minute Reports’ Shopify connector, you can connect and import multiple store accounts into a single Looker Studio dashboard. Our pre-built Shopify Looker Studio templates will consolidate data and give you a holistic view of all your stores’ performance.
With Two Minute Reports’ Shopify Reporting tool, you can pull key metrics such as sales, orders, refunds, discounts, inventory, customers, payments, along with cost of goods sold and dimensions including date, customer geo, line items, product details, etc to build custom Shopify dashboards in Data Studio.
Use Data Studio’s built-in email delivery. Go to Share → Schedule delivery, set your repeat frequency (eg: daily), pick a time, confirm the timezone, add recipients and click Save. Your updated Shopify dashboards land in your client’s inbox automatically.
Yes. Two Minute Reports includes Speedboost technology, which is designed to process high-volume Shopify datasets effectively. This keeps your Shopify dashboards highly responsive, even when analyzing large volumes of historical data.

Meet the Author
Shalini MuruganShalini is driven by ideas that create a tangible impact. At Two Minute Reports, she specializes in content that helps marketers optimize their reporting workflows. When she's not transforming complex data into meaningful insights, you might find her lost in a book, jotting down ideas in her notebook, or connecting the dots others overlook.