Summarize this blog post with:
Are you struggling to manually copy and paste your Bing Ads data into Google Sheets?
If yes, it might be due to the following reasons:
- You have a growing client base, so manually tracking campaign performance feels extremely time-consuming.
- Native Bing Ads analytics feels clunky, especially when you need customized dashboards.
- You are managing multiple campaigns across different time zones and need real-time updates.
This is where you can use Two Minute Reports’ Bing Ads reporting tool. It lets you connect Bing Ads directly to Google Sheets, so you can streamline and automate performance tracking without manual effort. There are two ways by which you can accomplish this:
- Connecting Bing Ads to Google Sheets using the sidebar.
- Connecting Bing Ads to Google Sheets using the built-in templates.
Let’s get started.
How to extract Bing Ads data to Google Sheets?
To get started, install the Two Minute Reports add-on from the Google Workspace Marketplace. After you have installed, you can connect Bing Ads to Google Sheets in the following methods:
Method 1: Connect Bing Ads to Google Sheets using the sidebar
Step 1: Creating a Connection to your source
To create a Connection, you must connect your Bing Ads accounts to Google Sheets.
To do this, launch the Two Minute Reports add-on from the Extensions menu in your spreadsheet. Next, open the sidebar and perform the following steps:
Go to Menu > Click Connections > Click Add to start creating a new Connection
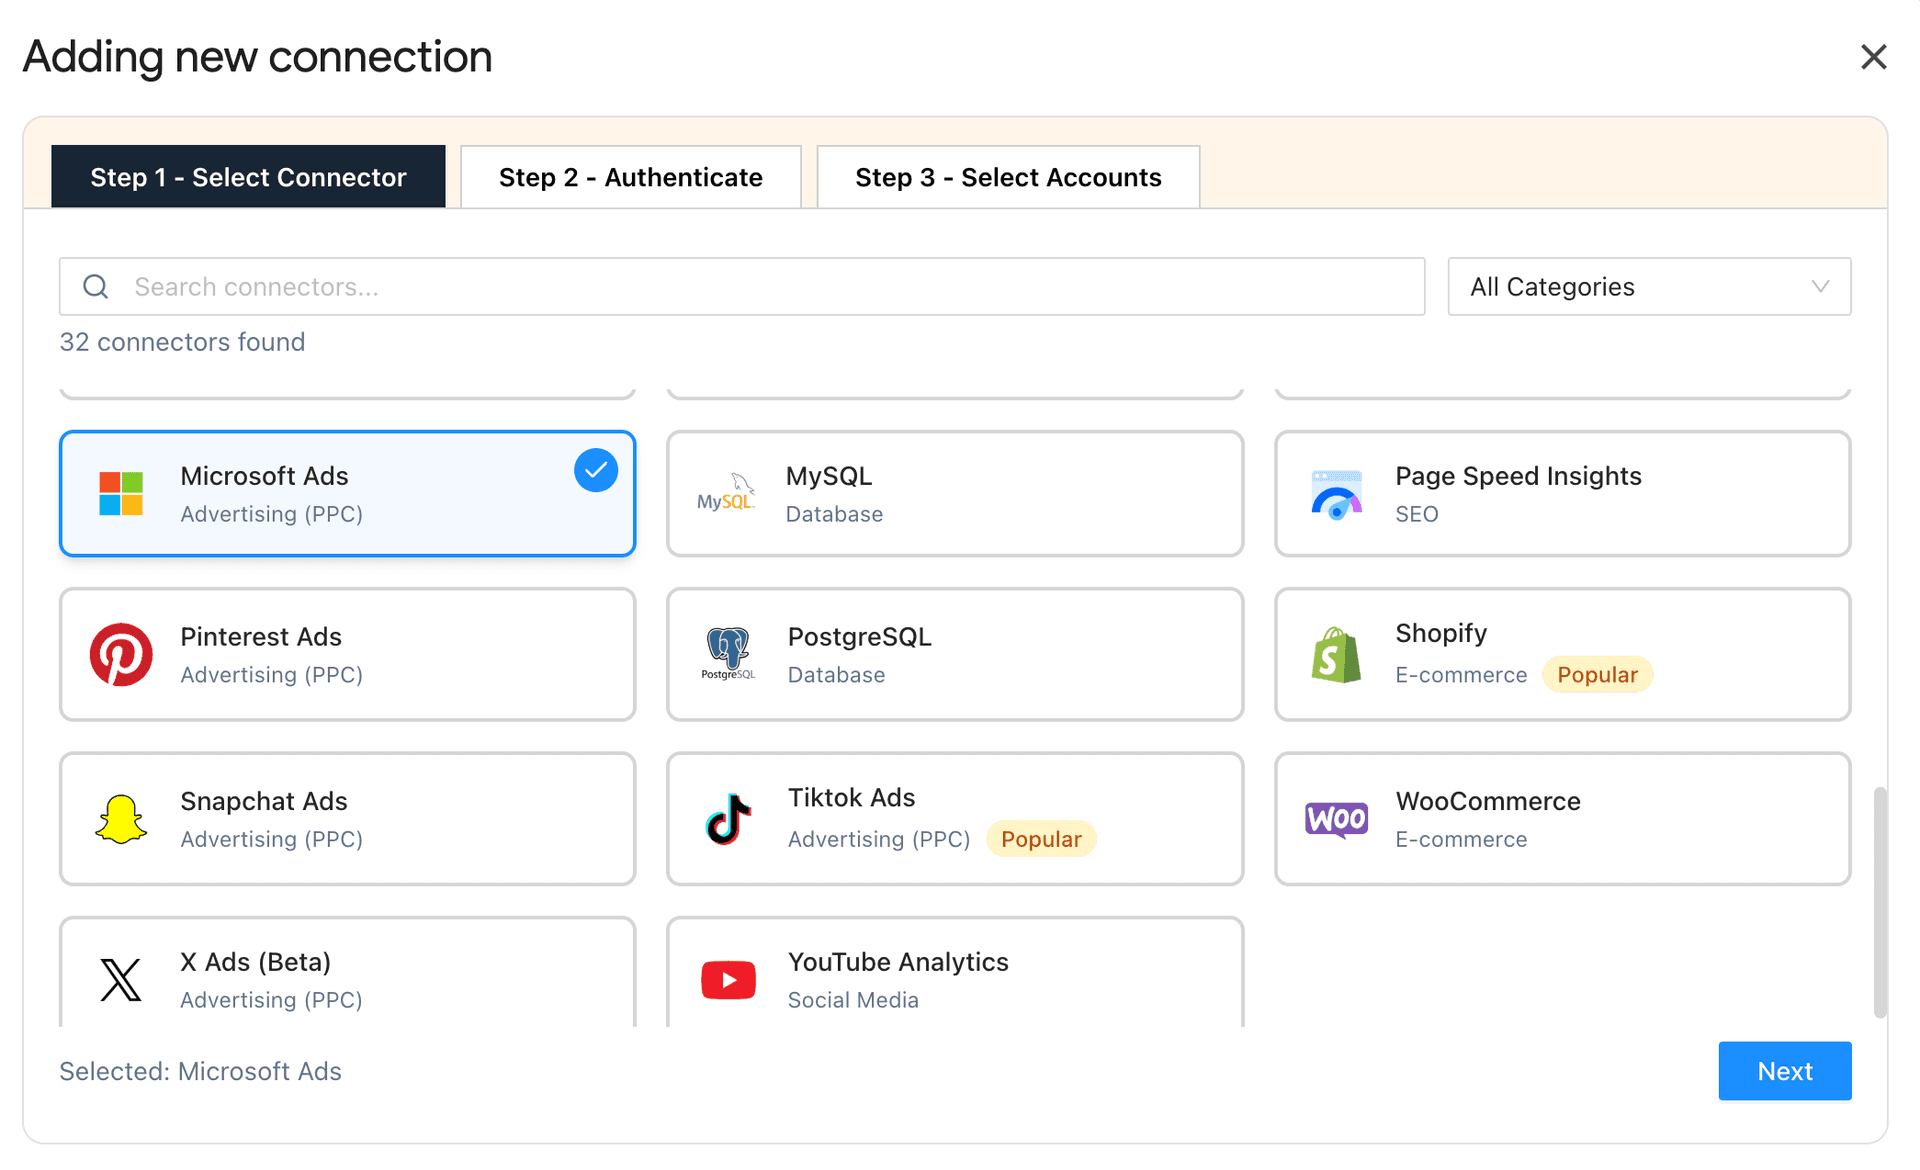
2. Next, authorize your Connection by specifying the login credentials. Once you’ve authenticated, you can visualize the following fields: Name, ID, Connection Name, as shown below:
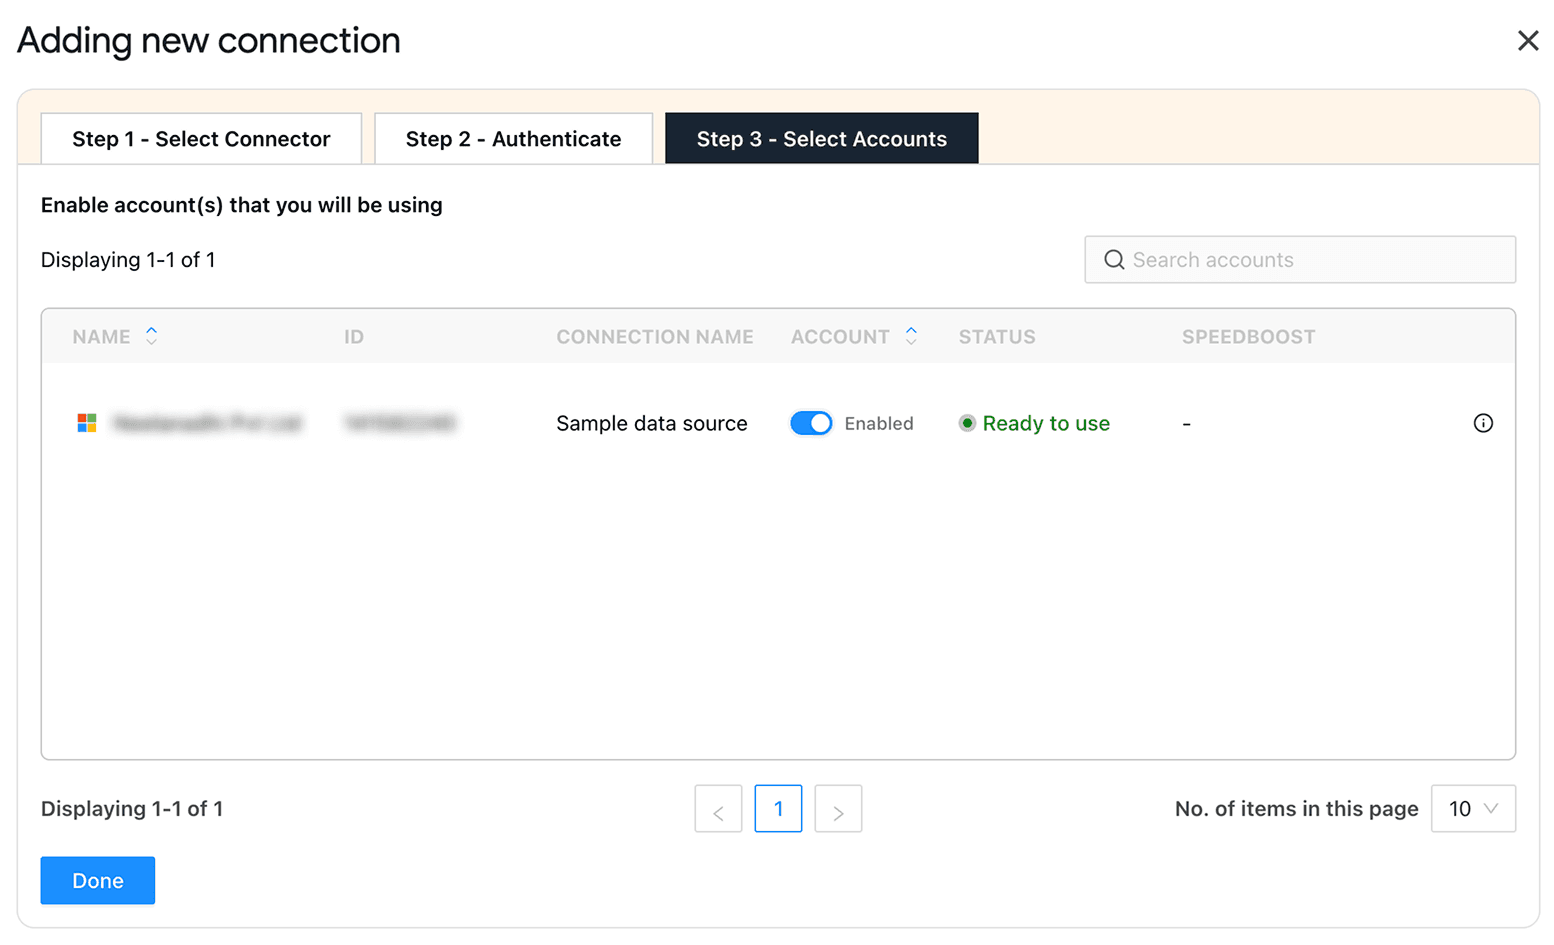
3. Enable the toggle for the accounts you want to run queries. Please note that you cannot extract data from the disabled accounts.
4. Once you’ve enabled the associated accounts, you can hit “Refresh Connections” to ensure the connected Bing Ads accounts are reflected in the sidebar.
Now that you’ve created the Connection, the next step is to create a query. Let’s explore how to do that.
Step 2: Creating a query and report configuration
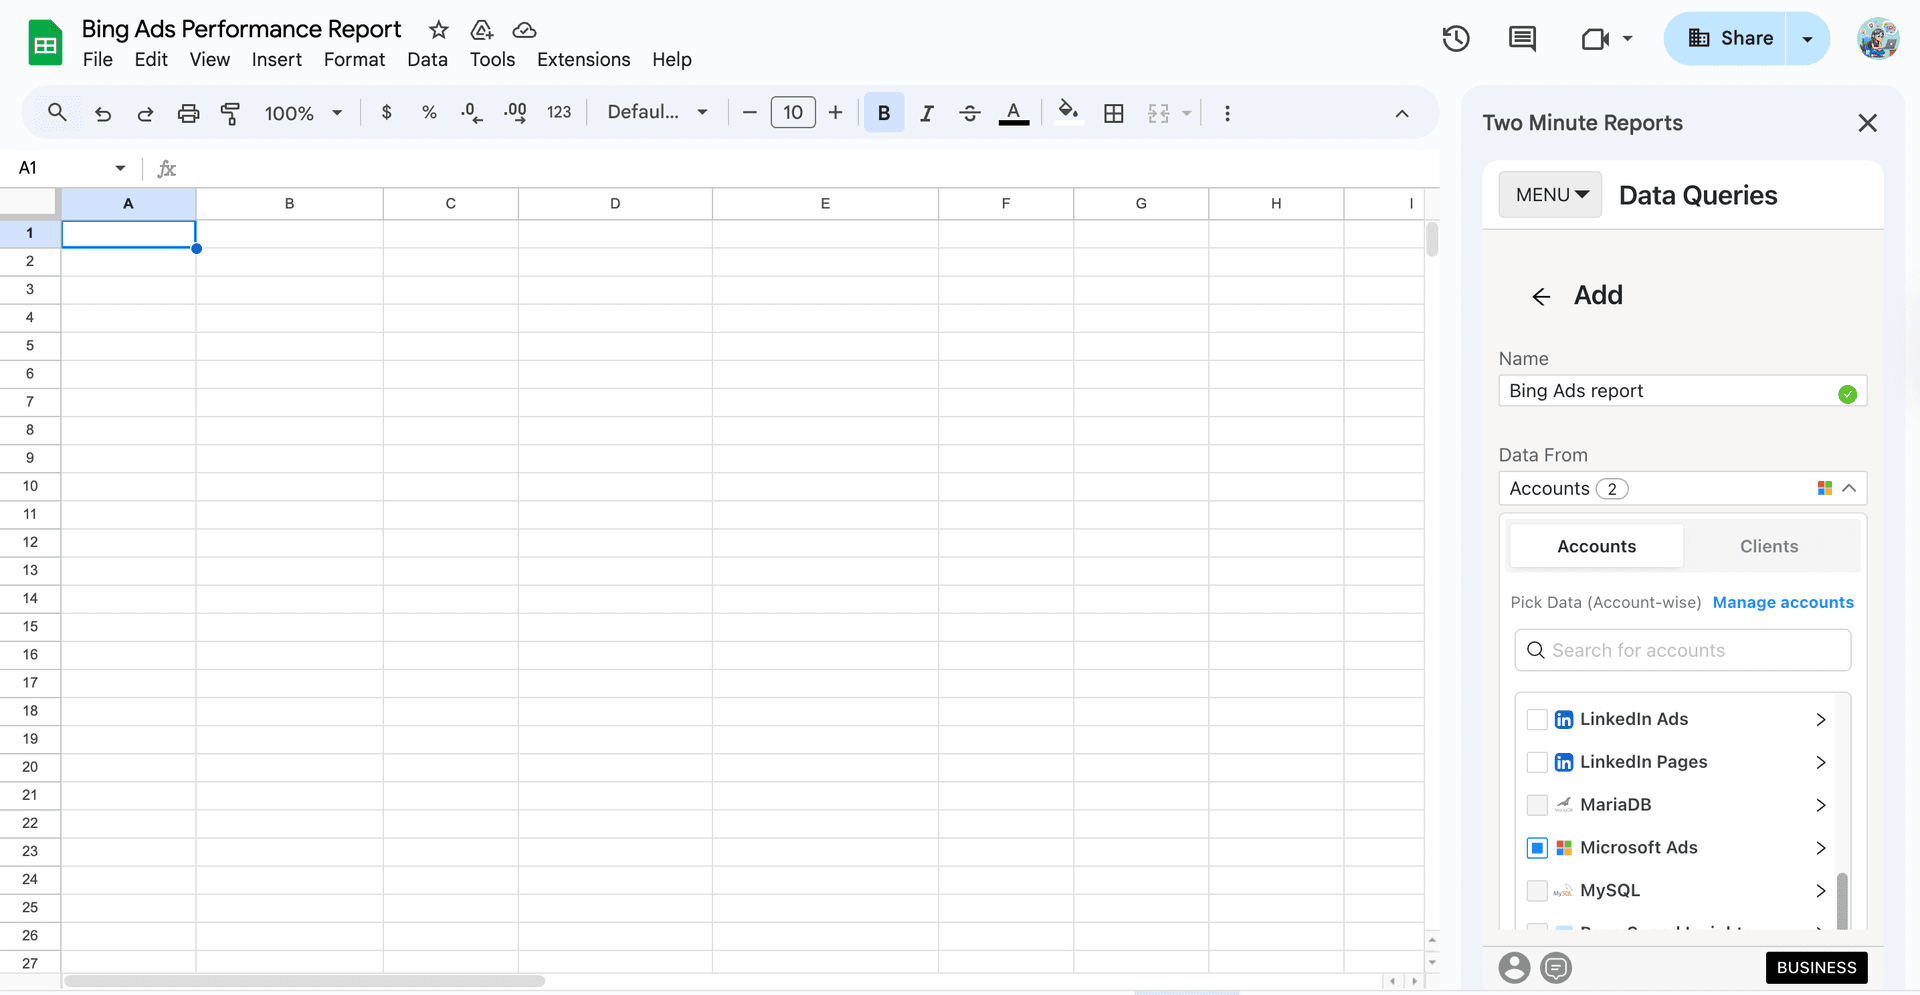
To extract your Bing Ads campaign data, click Data Queries from the Menu dropdown. You can follow the steps below to create your Bing Ads report.
1. Click Add and select your desired Microsoft/Bing Ads account from the sidebar.
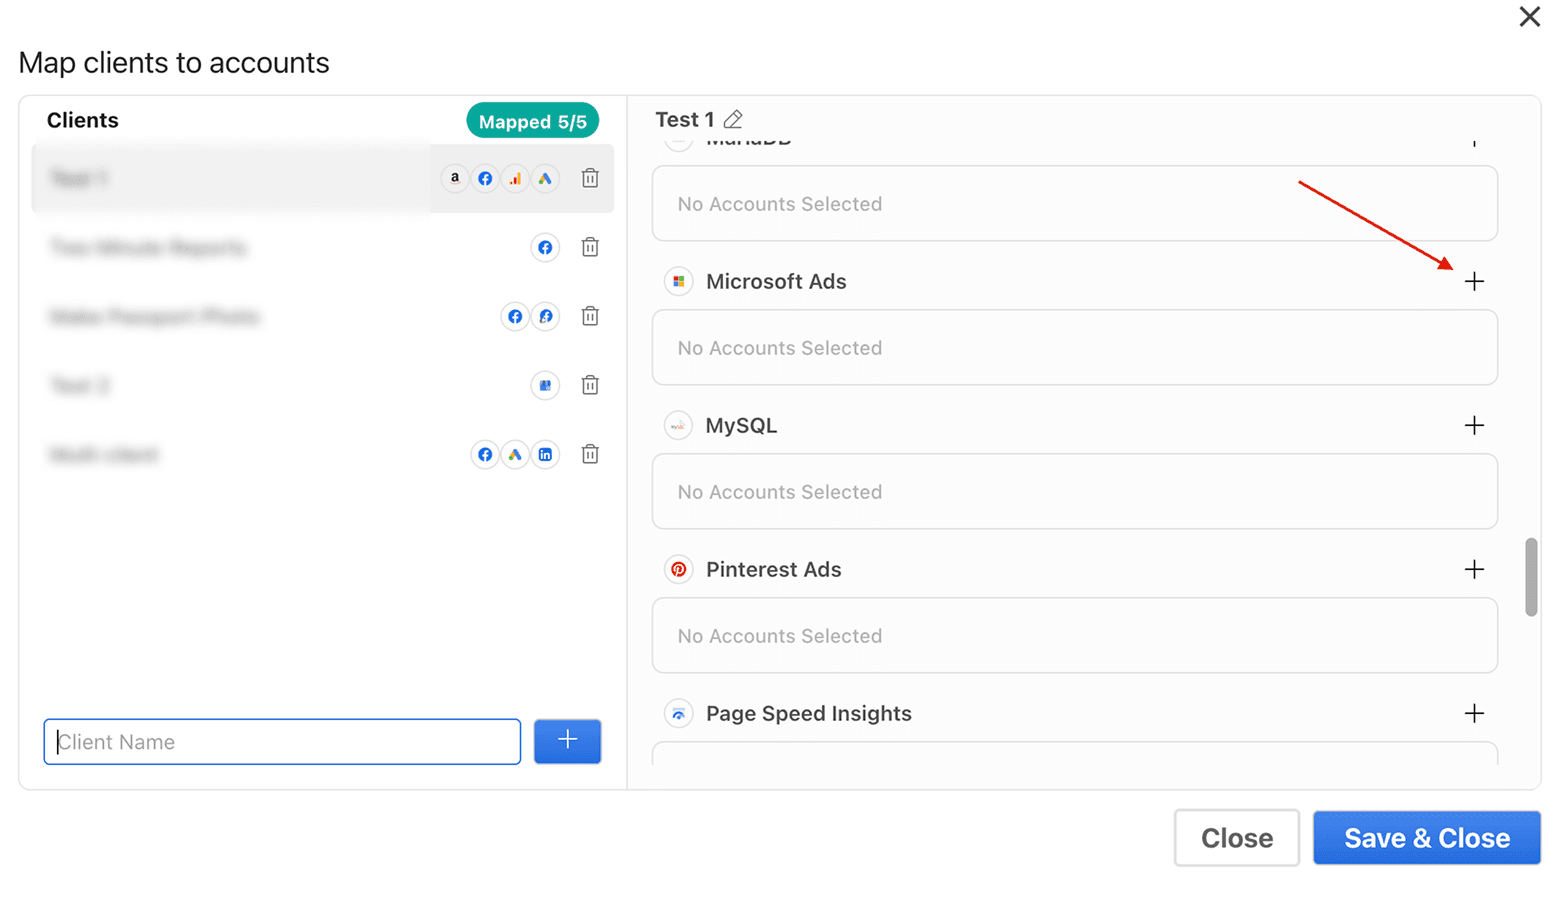
2. Alternatively, navigate to the “Clients” section. Click on “Manage clients” and map the necessary account details. Once done, click Save & Close to save your client’s details.
3. Next, add the required Microsoft Ads metrics and dimensions you want to analyze. Then select the date range to track and measure campaign performance.
Pro tip: While selecting the date range, you can also use the Custom Range (cell reference) option. Simply enter the start and end dates in the required cells. After that, you don’t have to reopen the sidebar – you can update the dates in those cells and your reports get refreshed dynamically.
4. Once you finish the above steps, click Run Query to visualize the final results. This query fetches the data from your chosen Bing Ads accounts onto the sheet and cell of your choice.
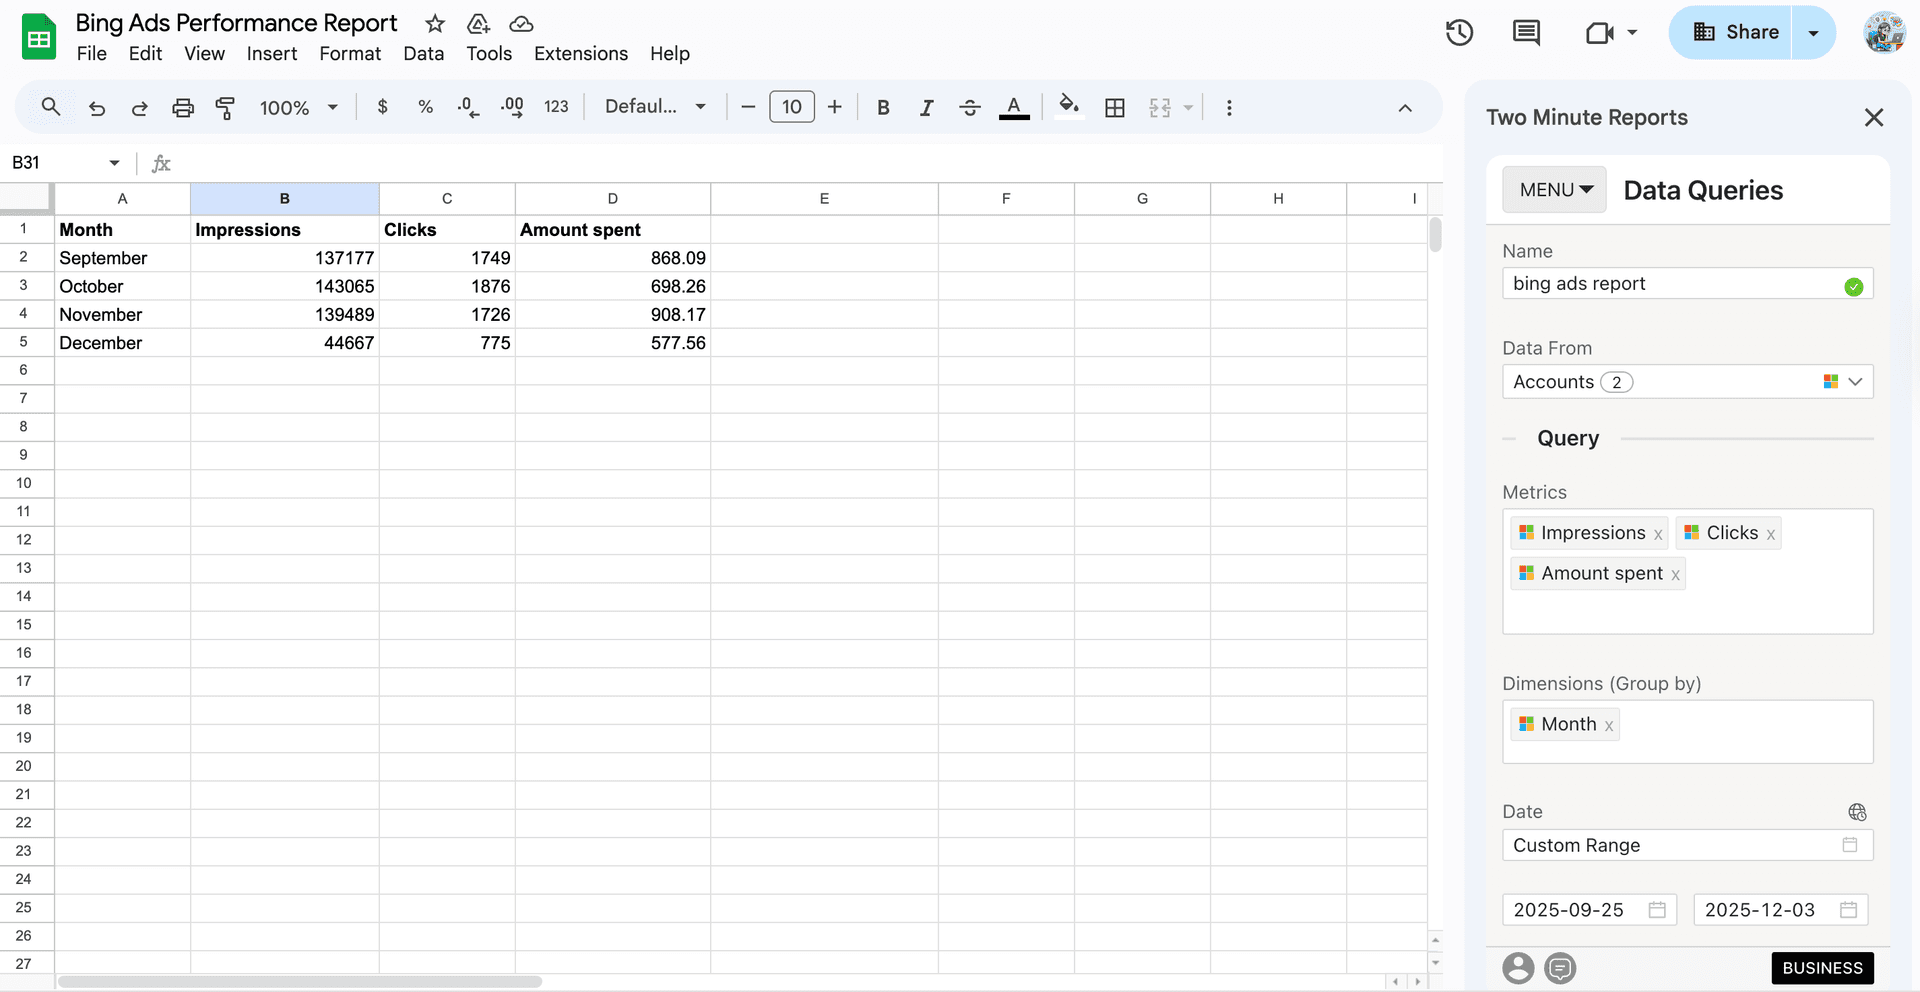
Pro tip: You can set up automated refresh schedules (daily, weekly or monthly) and keep your clients informed with real-time performance updates.
Pro TMR tip: Run all your queries directly from the Extensions menu on your Google Sheets. Go to Extension > Two Minute Reports > Choose your desired quick action.
While creating your Bing Ads report through the sidebar is straightforward, there’s also another easier way to streamline your campaign performance analysis. Let’s explore leveraging Bing Ads reporting through built-in templates.
Method 2: Creating a Bing Ads report using pre-built templates
You can access the Bing Ads templates for Google Sheets via: Extensions > Two Minute Reports > Templates.
- In the template gallery, you can select your preferred Bing Ads template to streamline campaign performance tracking.
- Next, click Use to build your report. Your template will open in Google Sheets.
- Finish importing your template by selecting the required Bing Ads accounts from the dropdown. Once done, click Submit to create your report.
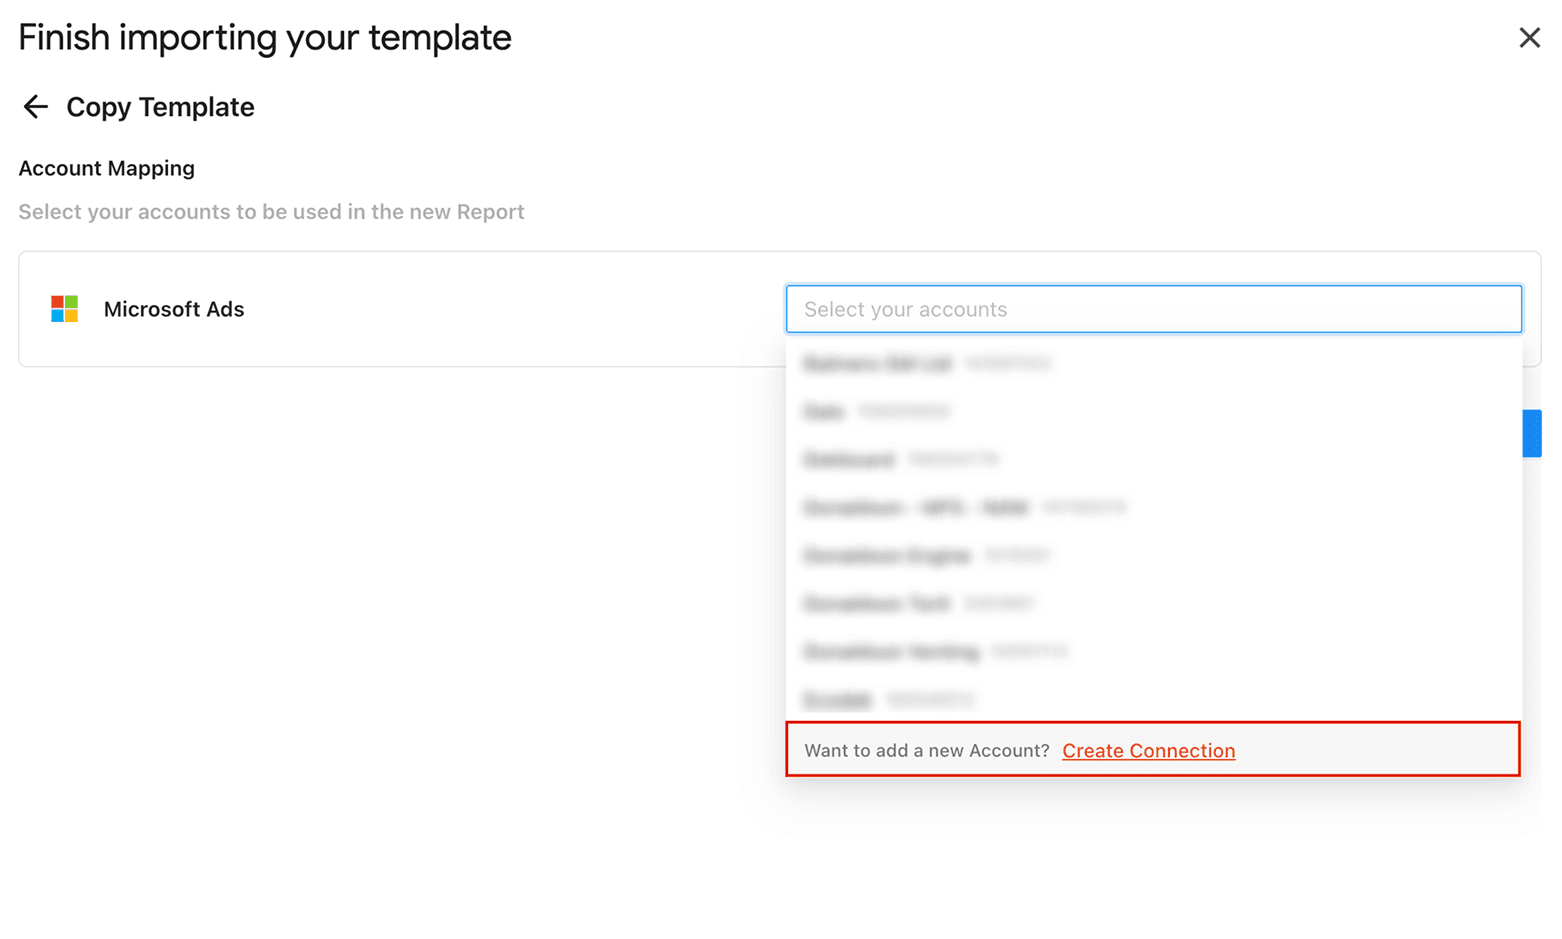
- Next, click Extensions > Two Minute Reports > Run all queries to auto-populate your dashboard with updated insights.
How to automate your Bing Ads report using Two Minute Reports?
You’ve created the Connection, executed the query, and visualized the output. Now, it’s time to automate your Bing Ads report. By scheduling automatic updates, your clients will receive the latest campaign insights without any manual intervention. Here’s how you can set it up:
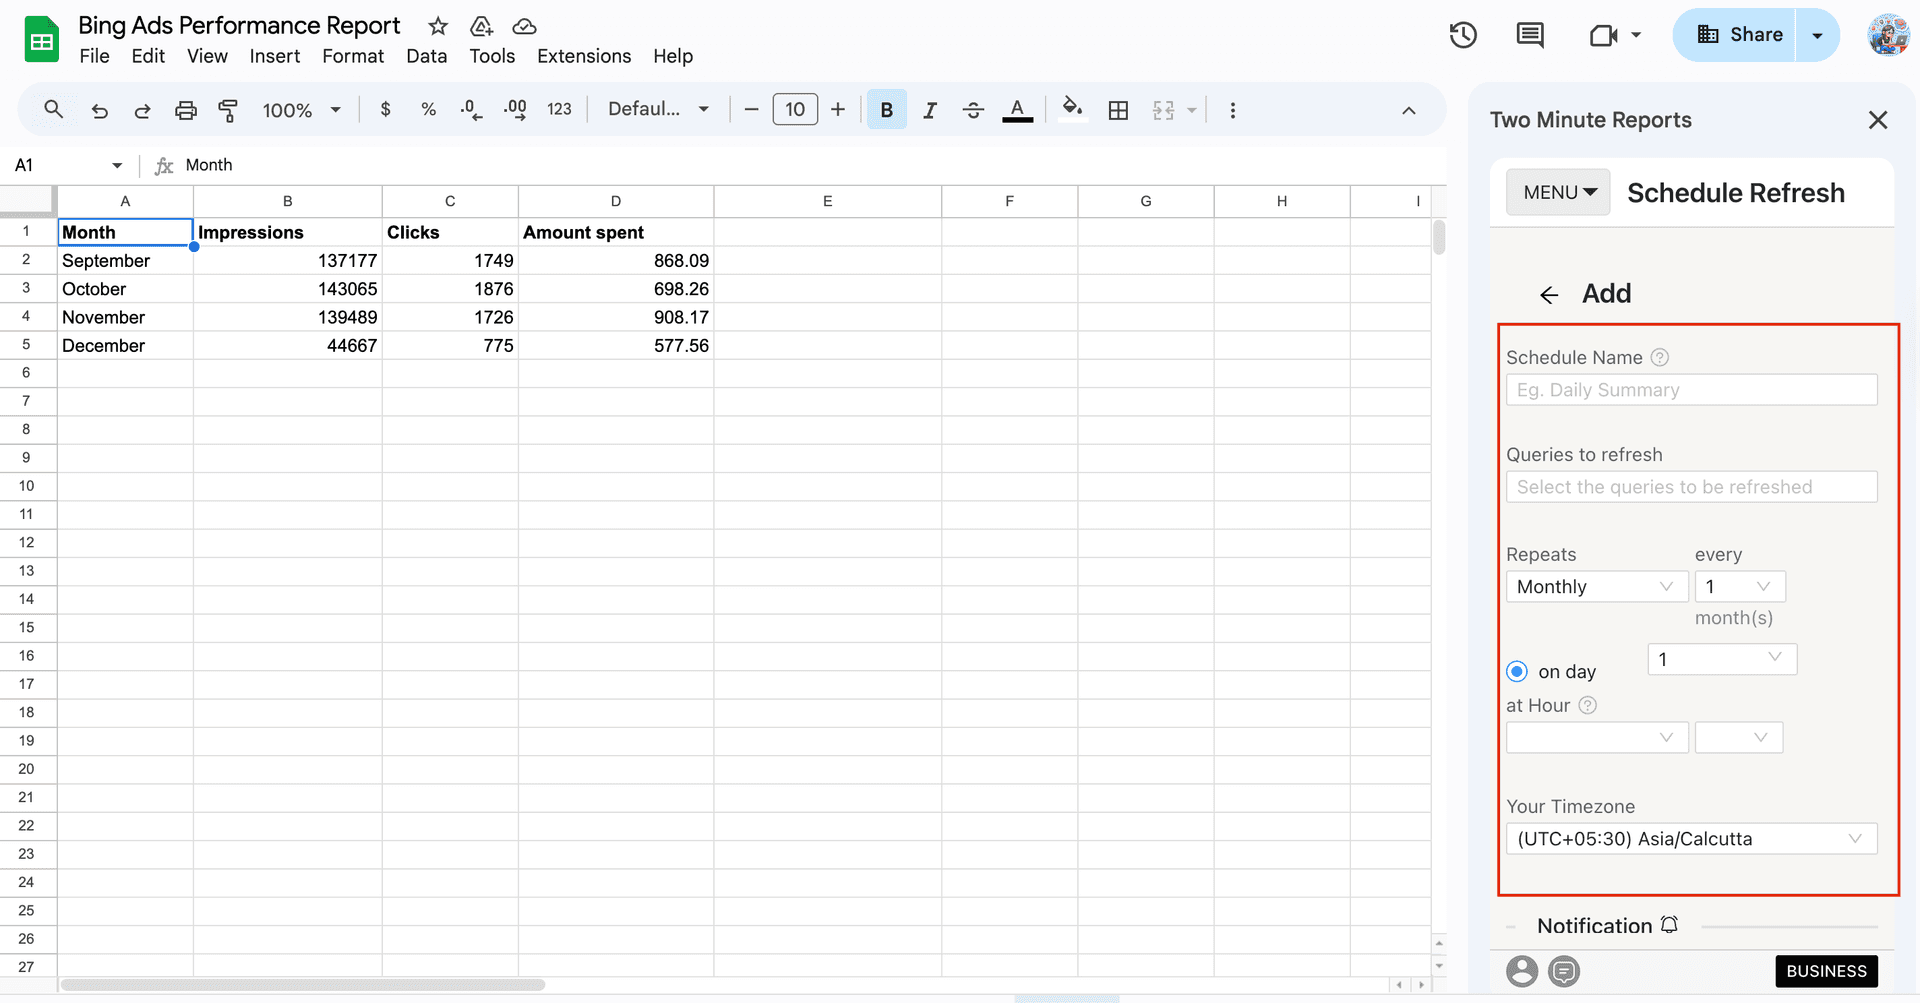
1. Go to Extensions > Two Minute Reports > Schedule Refresh
2. Next, specify the Schedule Name, select the queries to refresh, and choose the refresh schedule – daily, hourly, weekly or monthly and timezone. The “Every” field indicates how often the refresh will occur.
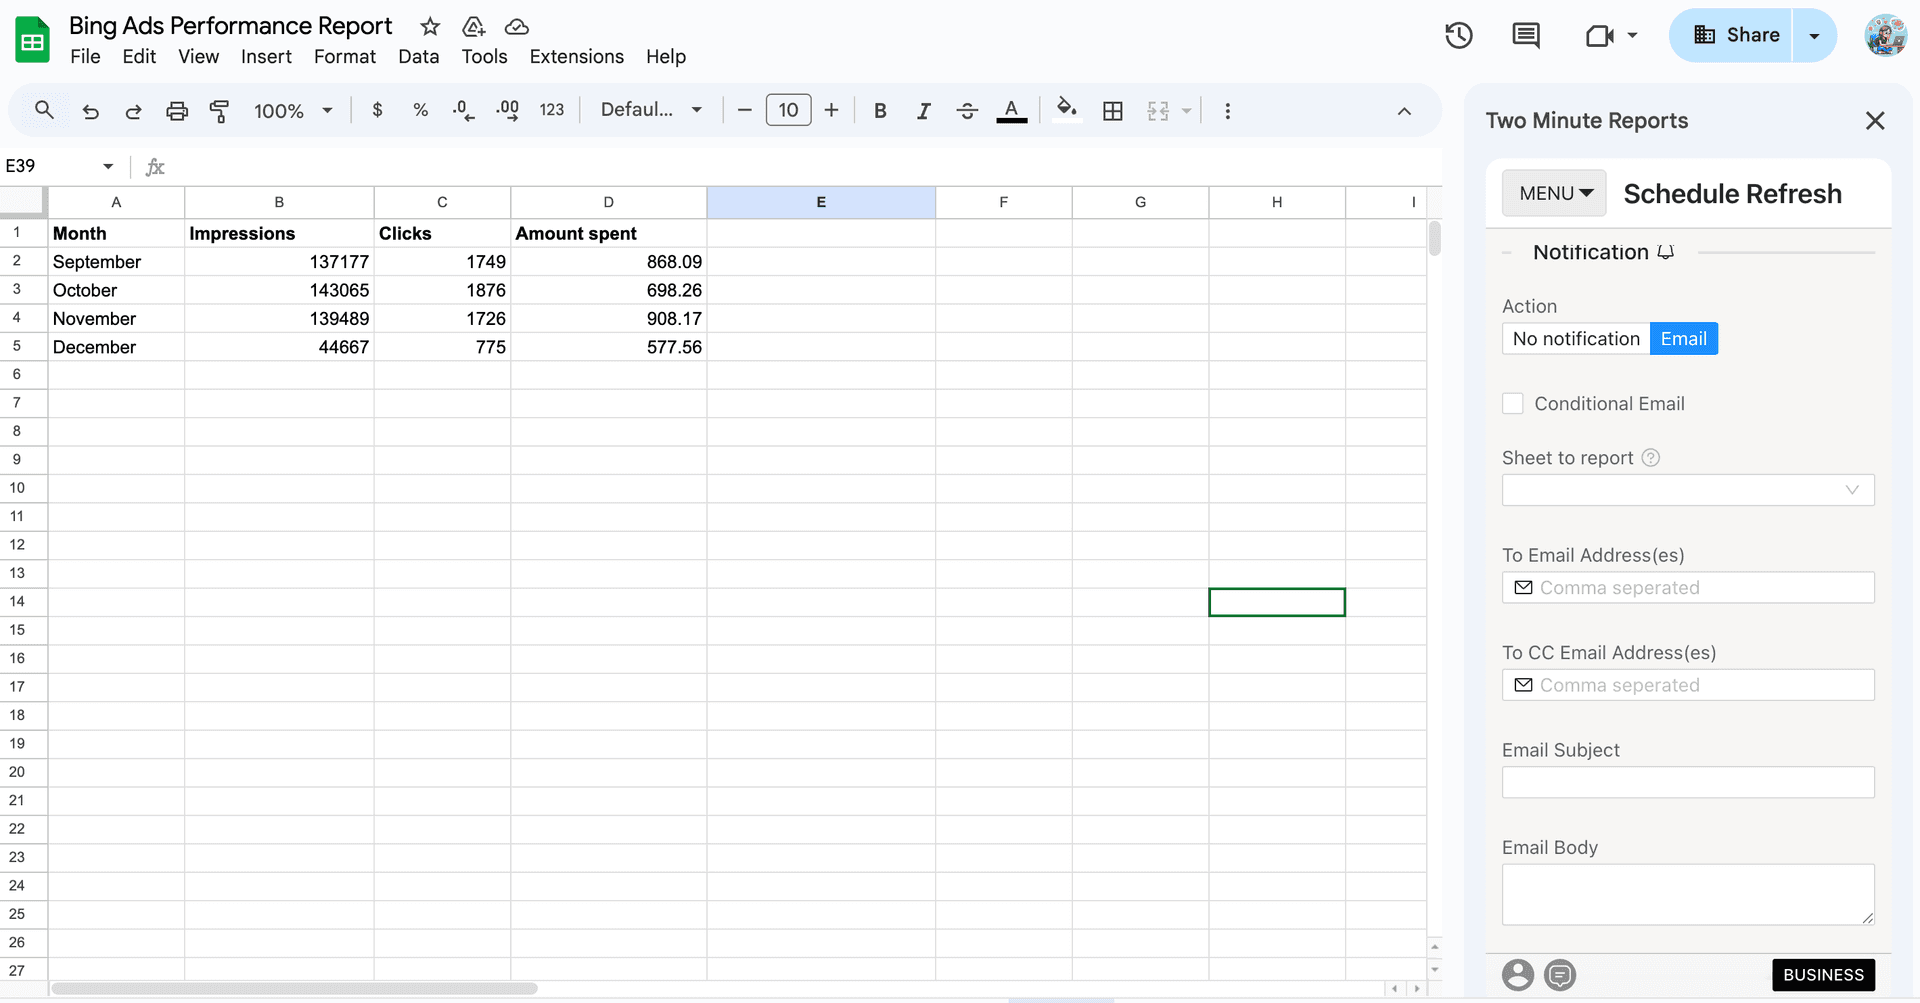
3. Now that you’ve set the schedule, you can directly send an email to clients by specifying the following fields:
- Sheet to report: The sheet you want to send as an email to your client.
- To Email Address(es): The recipient of the email. You can include one or multiple email addresses.
- To CC Email Address(es): The recipient of the copy of the email.
- Email subject: The title of the email.
- Email body: The content of the email.
4. Finally, you can insert the report into your preferred format, such as Excel, PDF, etc and click Save. Once saved, your schedule will automatically refresh at the set time. If your Schedule fails to run, you can enable the “Send email alerts if queries fail to refresh” checkbox so that you’ll be notified when something goes wrong and take immediate action to fix it.
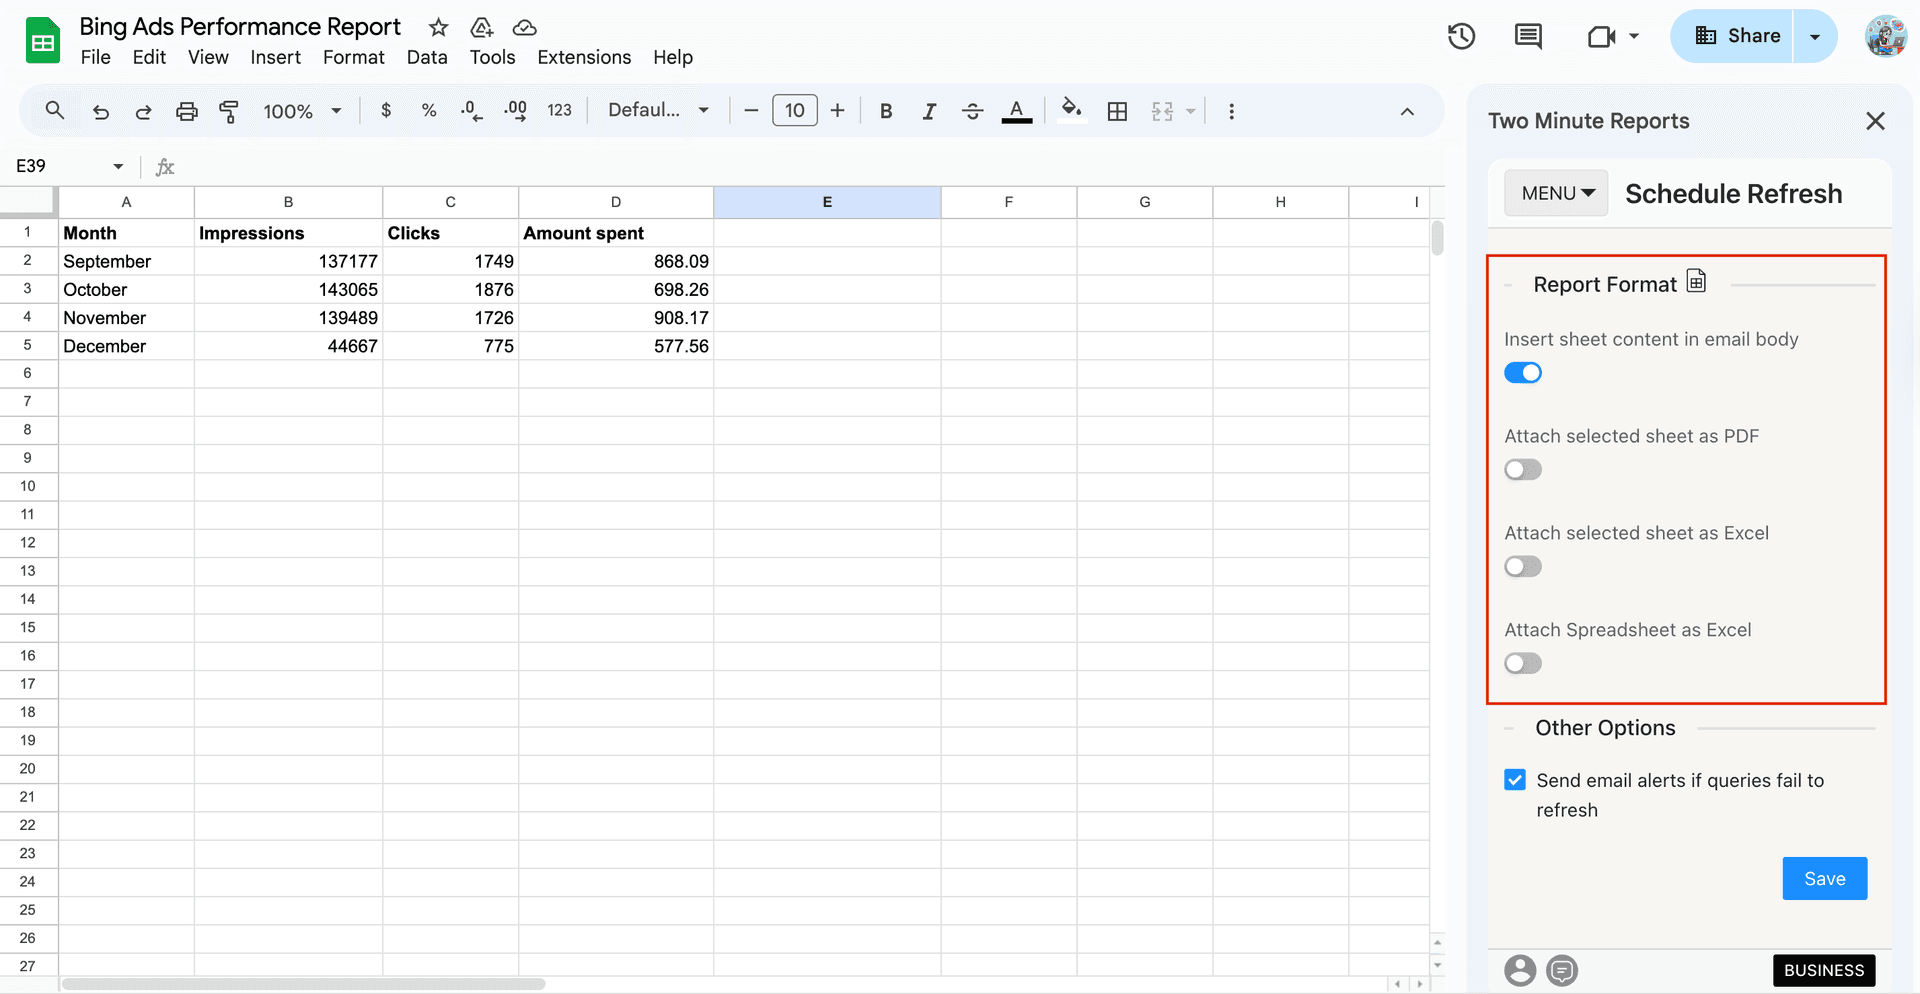
And that’s it. Within minutes, you can automate your Bing Ads reports to multiple clients across different time zones – no broken reports, no mismatched data.
Which metrics from Bing Ads analytics should you track?
Analytics is a crucial step that tells you if a platform works for marketing and business goals. Follow the steps below to build the foundation of your Bing Ads analytical strategy.
1. Understanding Bing Ads: Find out how you can leverage Bing Ads for your business. Whether you want to promote your business or run shopping campaigns, research how you can strategically plan and run your campaigns.
2. Audience targeting: Identifying the right audience lays the foundation for maximizing your campaign reach and exposure. It plays a crucial role in optimizing your budget and strategy, ensuring resources are spent efficiently. In this way, you can fine-tune your messaging, increase engagement, and drive better conversions.
3. Identifying the key metrics: Though they vary depending on your goals, the following metrics are significant to measuring your campaign performance.
Core metrics:
- Impressions
- Amount Spent
- Expected CTR
- Ad relevance
- Click share %
Shopping campaigns:
- Price
- Benchmark CTR
- Benchmark Bid
Budget:
- Average budget spent per day
- Average budget spent per month
- Amount of budget spent for the month
Conversions:
- All conversions
- All conversion rate
- Cost per conversion
- ROAS
- Revenue per all conversions
Based on your client's requirements, you can customize your Bing Ads dashboard and streamline campaign KPIs holistically.
Get Bing Ads data in Looker Studio
Connect your Bing Ads account to Looker Studio using Two Minute Reports for creating data-driven reports and visual dashboards without manual efforts. With no-code integration, comprehensive analytical capabilities, and automated workflows, strategic campaign insights from Bing Ads have become quicker and more accessible.
Connect your advertising platforms with Google Sheets
Integrate Bing Ads with other PPC platforms such as Google Ads, LinkedIn Ads, Meta, etc, in a single Google Sheets dashboard using Two Minute Reports. Blend key PPC metrics across all ad platforms, analyze cross-channel ROI and allocate optimal resources. With unlimited reporting in Google Sheets and Looker Studio, access to exclusive Speedboost technology, and real-time performance insights, stay on top of trends and accomplish your campaign ROI.
Frequently Asked Questions
Install the Two Minute Reports add-on from the Google Workspace Marketplace. Next, open your spreadsheet, launch the sidebar, connect your Microsoft/Bing Ads accounts and visualize actionable campaign performance insights within minutes without juggling spreadsheets.
With Two Minute Reports, you can set up custom refresh schedules – daily, hourly, weekly or monthly and ensure your campaign reports reflect the latest Bing Ads campaign insights. This ensures you always stay on top of what’s happening and implement proactive strategies to optimize your client’s ROI.
You can access our free, ready-to-share Microsoft Ads Google Sheets templates to streamline campaign tracking. Once you click “Use Template”, you can launch the Two Minute Reports add-on, import your client’s Bing ad accounts, run queries and auto-populate the dashboard with meaningful insights.
With data blending, you can compare Bing Ads with other advertising platforms, such as Meta, Google Ads, etc, into a single dashboard and unlock cross-channel ROI. No need to toggle between platforms or copy-paste KPIs manually.
You can select your client’s Bing Ads accounts from the Two Minute Reports sidebar and consolidate key KPIs in one place. Alternatively, you can also reuse the existing reports across multiple clients, ensuring you focus more on strategy and accomplish your campaign goals.

Meet the Author
Shalini MuruganShalini is driven by ideas that create a tangible impact. At Two Minute Reports, she specializes in content that helps marketers optimize their reporting workflows. When she's not transforming complex data into meaningful insights, you might find her lost in a book, jotting down ideas in her notebook, or connecting the dots others overlook.


