Summarize this blog post with:
Running multiple LinkedIn Ads campaigns for your clients can be exciting, but it also comes with its challenges, especially when KPIs fluctuate and reports pile up. By the time you dig into the numbers, your campaigns may have already shifted path.
Why? Because without a solid tracking and reporting system in place, you’re stuck manually building dashboards and formatting endless spreadsheets, causing ROI to slip through the cracks.
That’s where the streamlined LinkedIn Ads reporting workflow comes in. With the right PPC reporting software, such as Two Minute Reports, you can automate multi-client campaign reports – all within one workspace.
In this guide, I’ll show you two effective ways to connect your LinkedIn Ads data to Google Sheets, so you can generate reports that not only save time but also provide clear, actionable insights to steer your campaigns in the right direction.
Let’s get started.
How to connect LinkedIn Ads data to Google Sheets?
You can connect LinkedIn Ads data to Google Sheets using the following methods:
Method 1: Connecting LinkedIn Ads to Google Sheets using the sidebar.
Method 2: Connecting LinkedIn Ads to Google Sheets using pre-built templates.
Before we dive into the steps, you can watch this quick video tutorial to connect LinkedIn Ads to Google Sheets. This will help you understand clearly on how to set up the workflow.

To get started, install the Two Minute Reports add-on from the Google Workspace Marketplace. Once installed, you can proceed with the following steps explained below:
Method 1: Connecting LinkedIn Ads to Google Sheets using the sidebar
Step 1: Creating a Connection to your source
To create a Connection, you must connect your LinkedIn Ads accounts to Google Sheets.
To do this, launch the Two Minute Reports add-on from the Extensions menu in your spreadsheet. Next, open the sidebar and perform the following steps:
Go to Menu > Click Connections > Click Add to start creating a new Connection
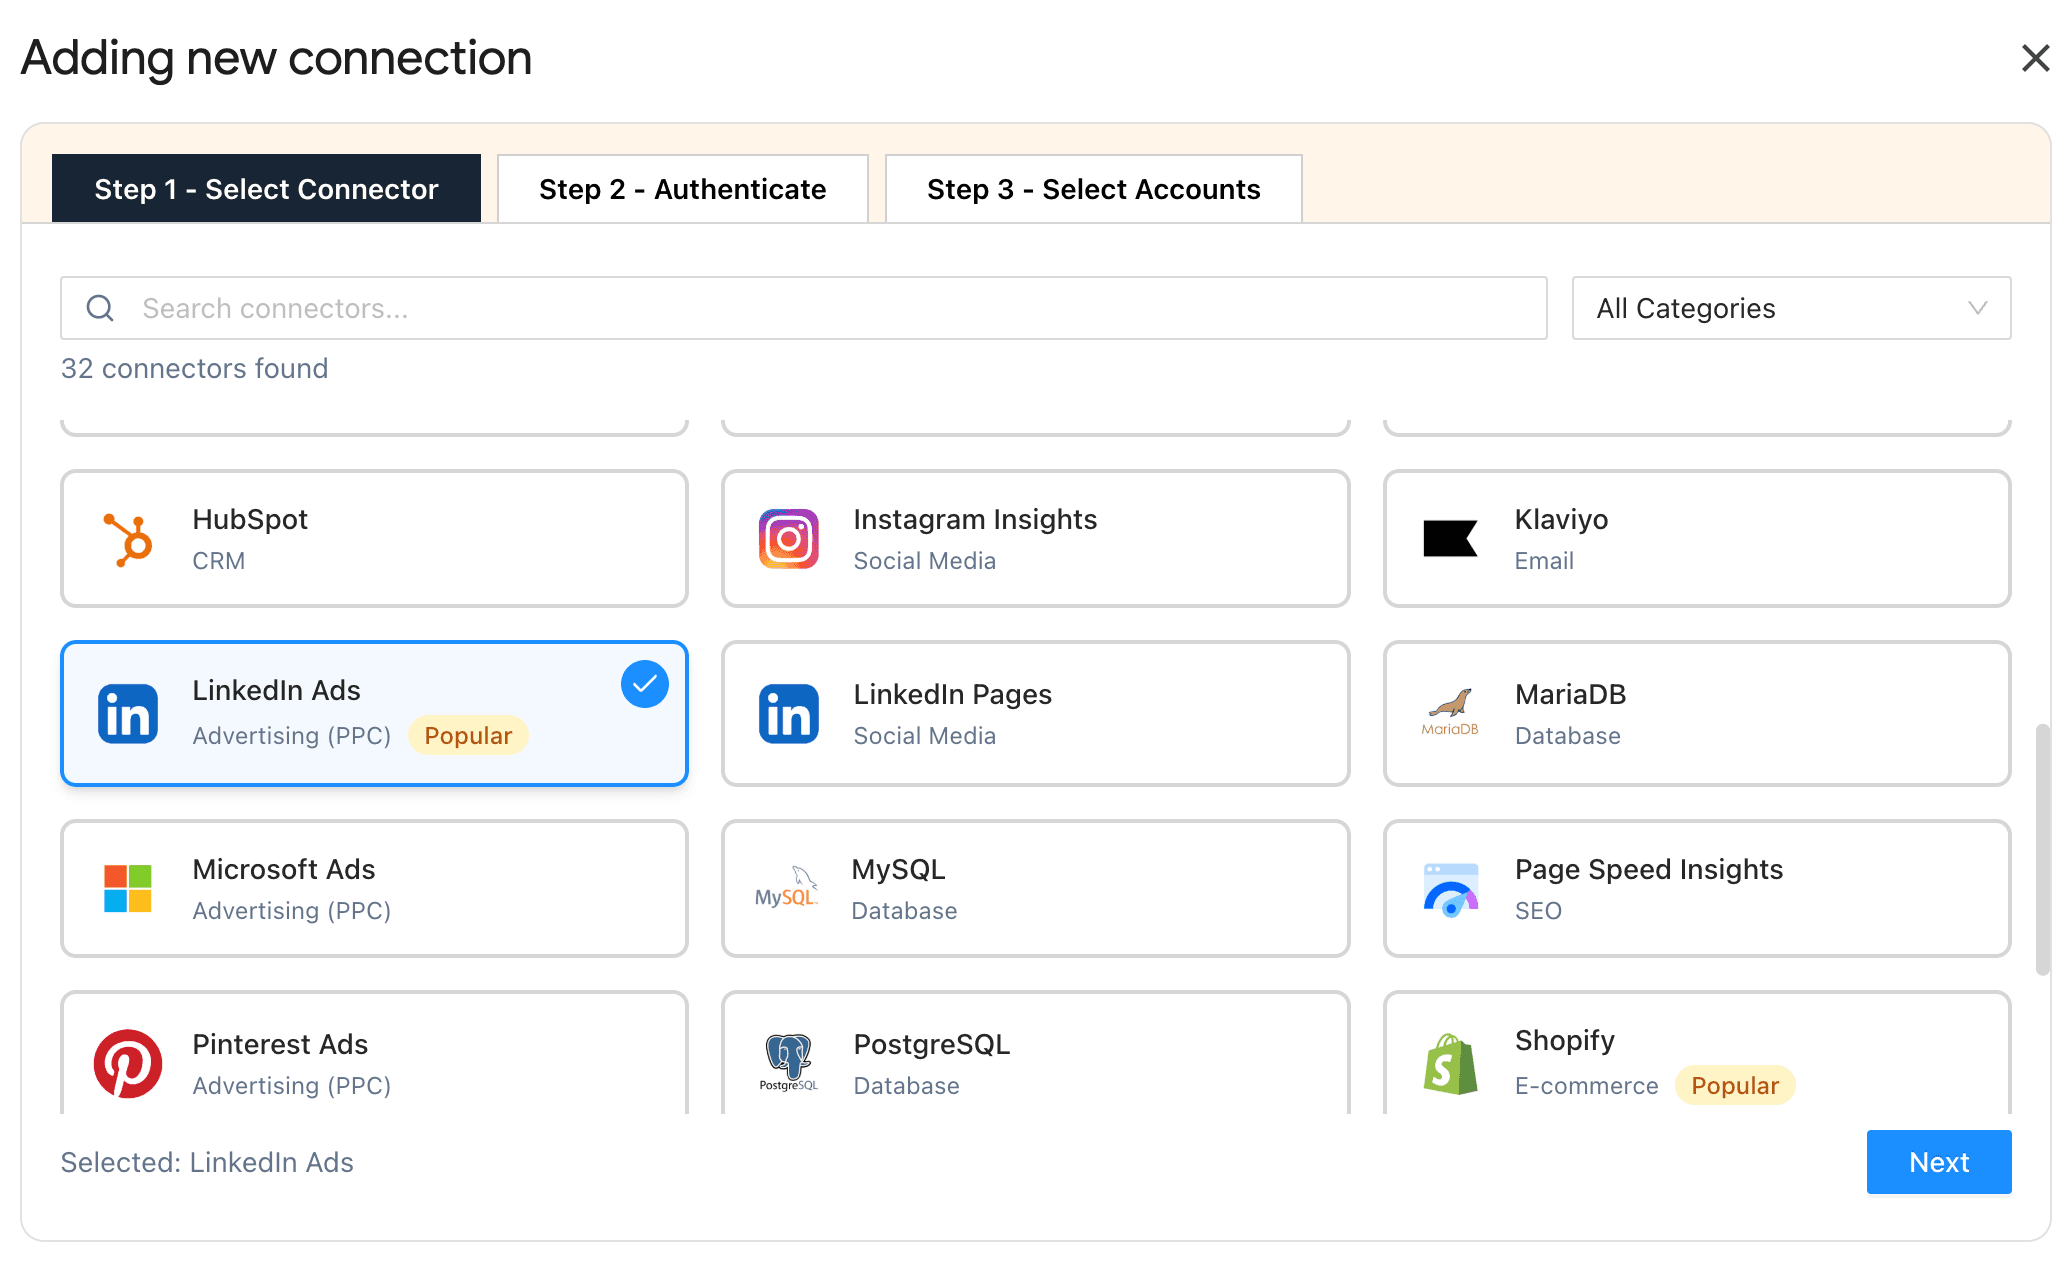
Once this is done, the “Adding new connection” dialog box appears. Next, you can follow the steps below to authenticate your LinkedIn Ads connection with Two Minute Reports.
1. Select the LinkedIn Ads connector.

2. Next, authorize your Connection by specifying the login credentials. Once you’ve authenticated, you can visualize the following fields: Name, ID, Status, Connection Name, as shown below:
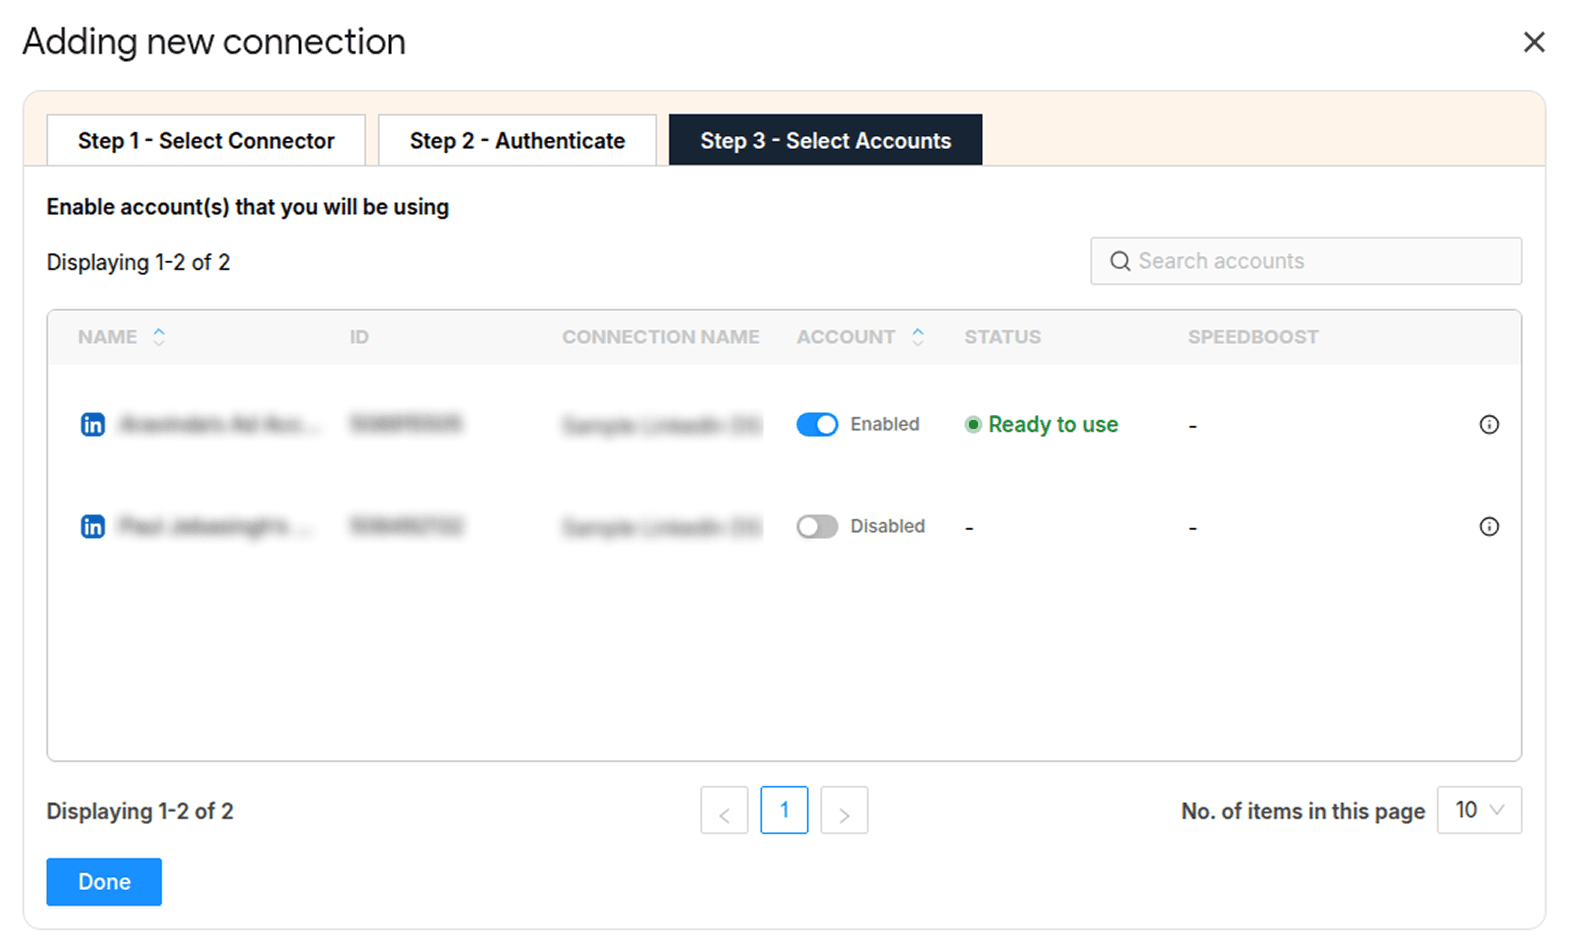

3. Enable the toggle for the accounts you want to run queries. Please note that you cannot extract data from the disabled accounts.
4. Once you’ve enabled the associated accounts, you can hit “Refresh Connections” to ensure the connected LinkedIn Ads accounts are reflected in the sidebar.
Now that you’ve created the Connection, the next step is to create a query. Let’s explore how to do that.
Step 2: Creating a query and report configuration
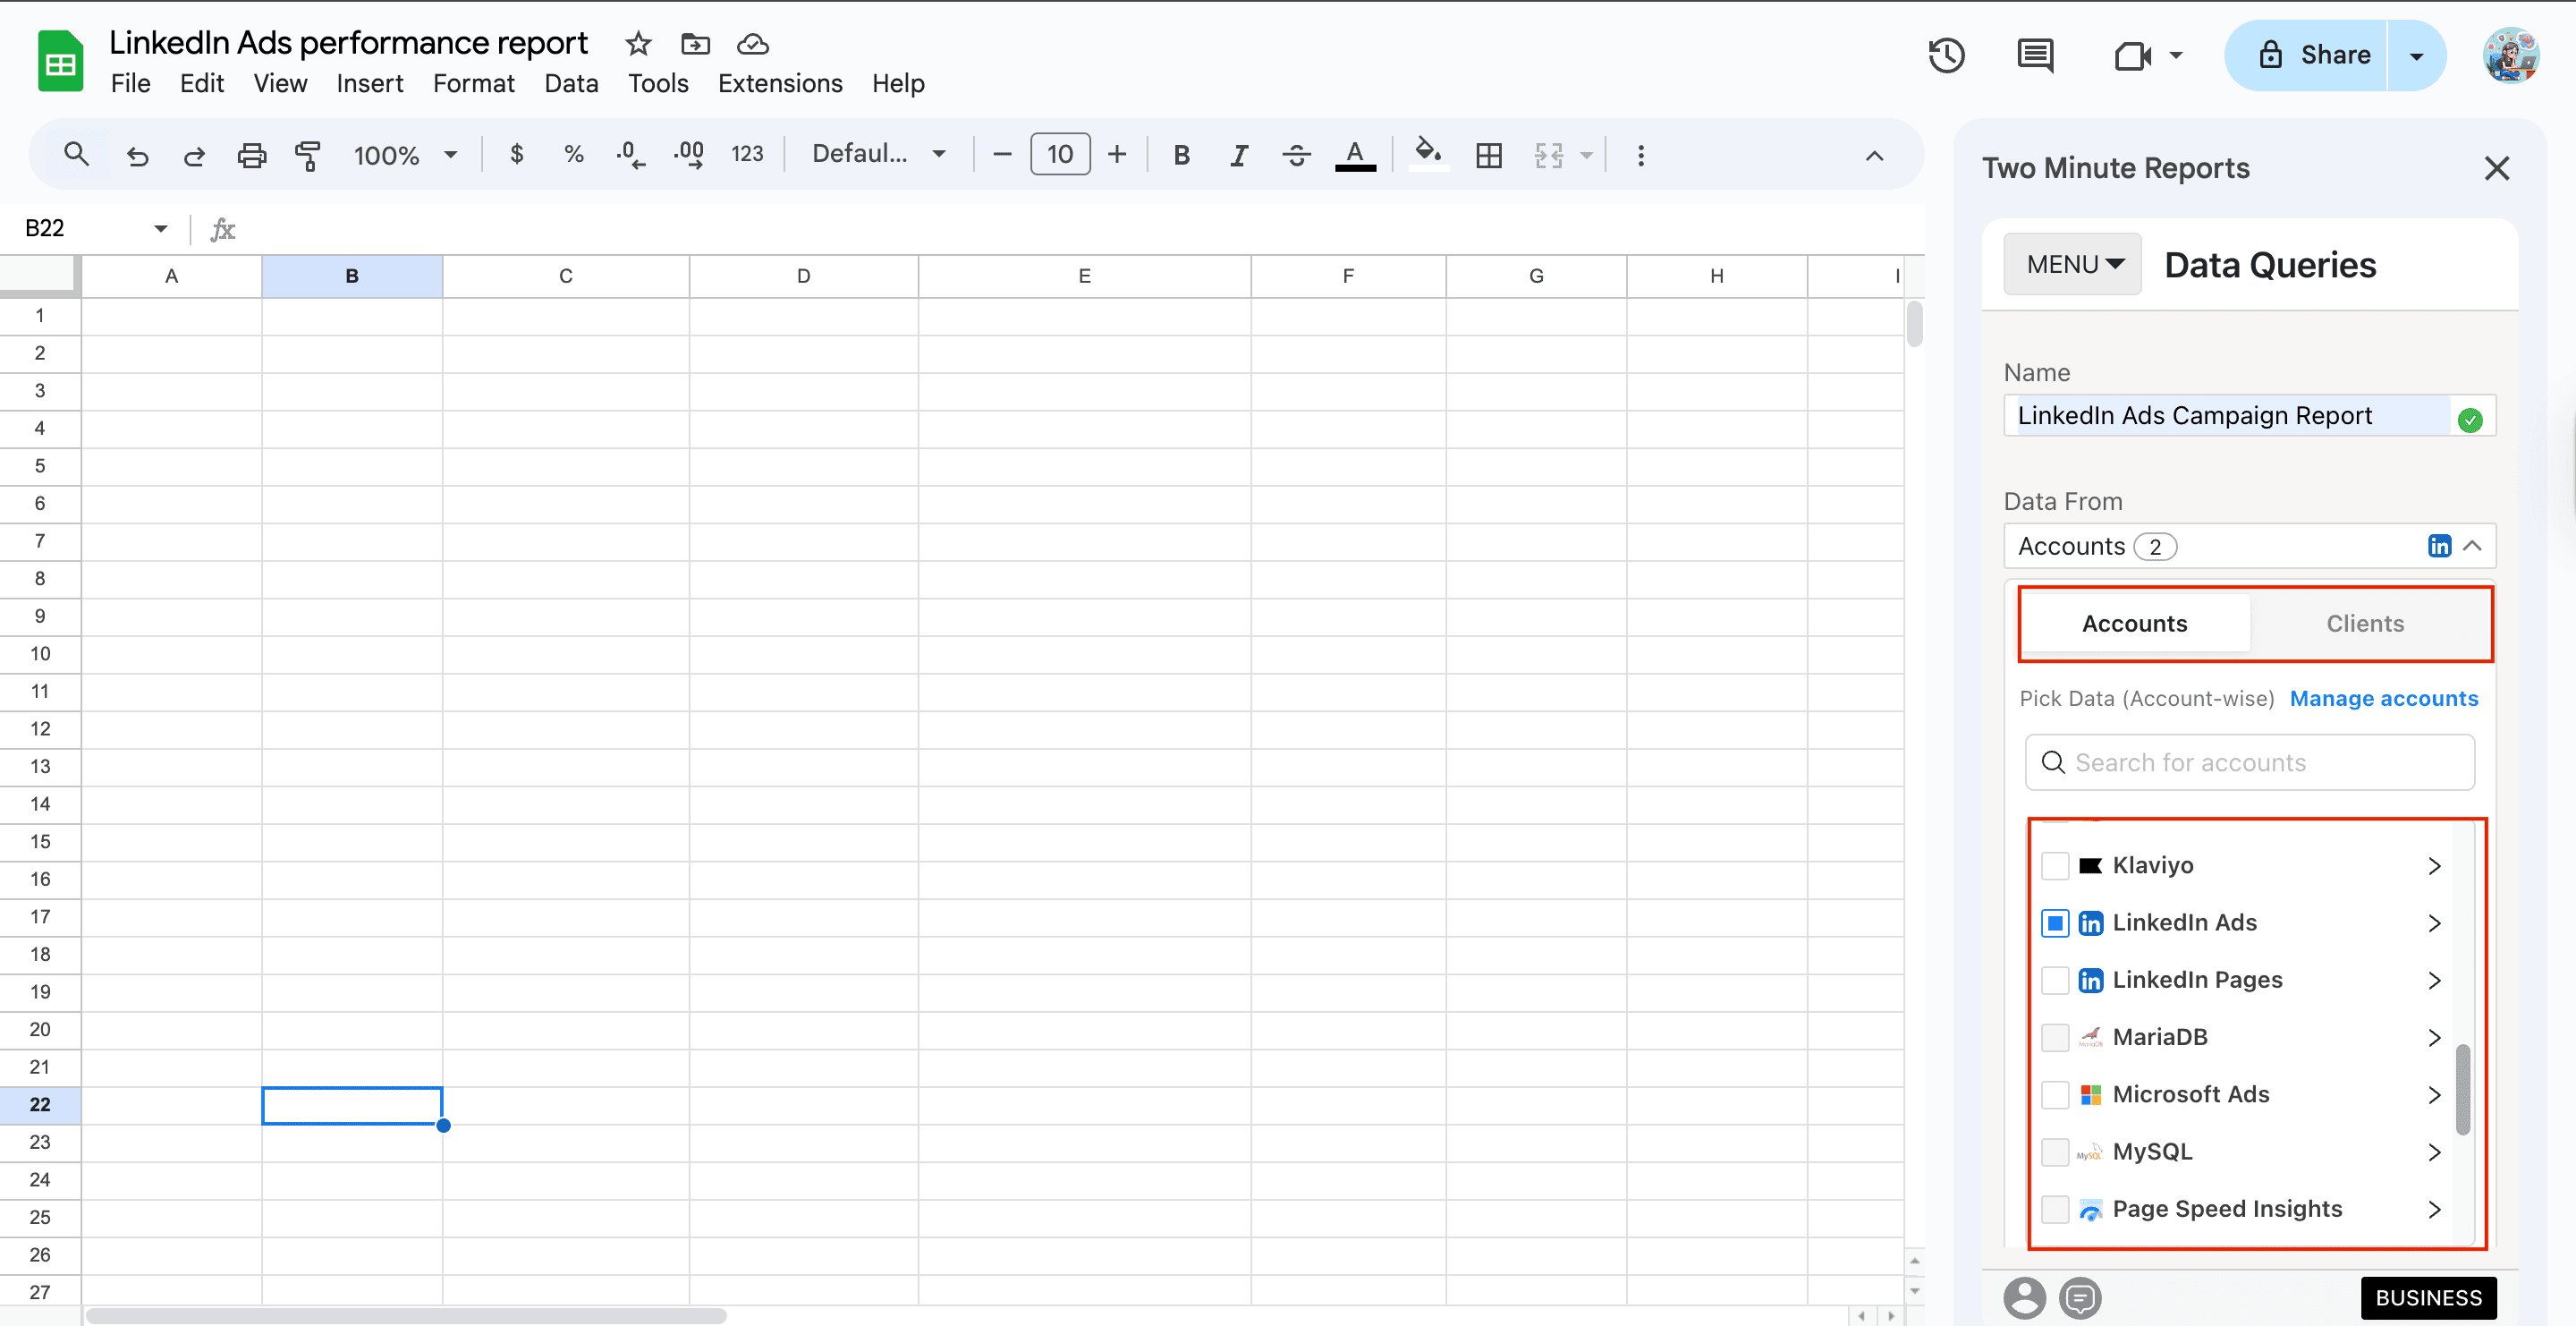
To extract your LinkedIn Ads campaign data, click Data Queries from the Menu dropdown. You can follow the steps below to create your LinkedIn Ads report.
1. Click Add and select your desired LinkedIn Ads account from the sidebar.

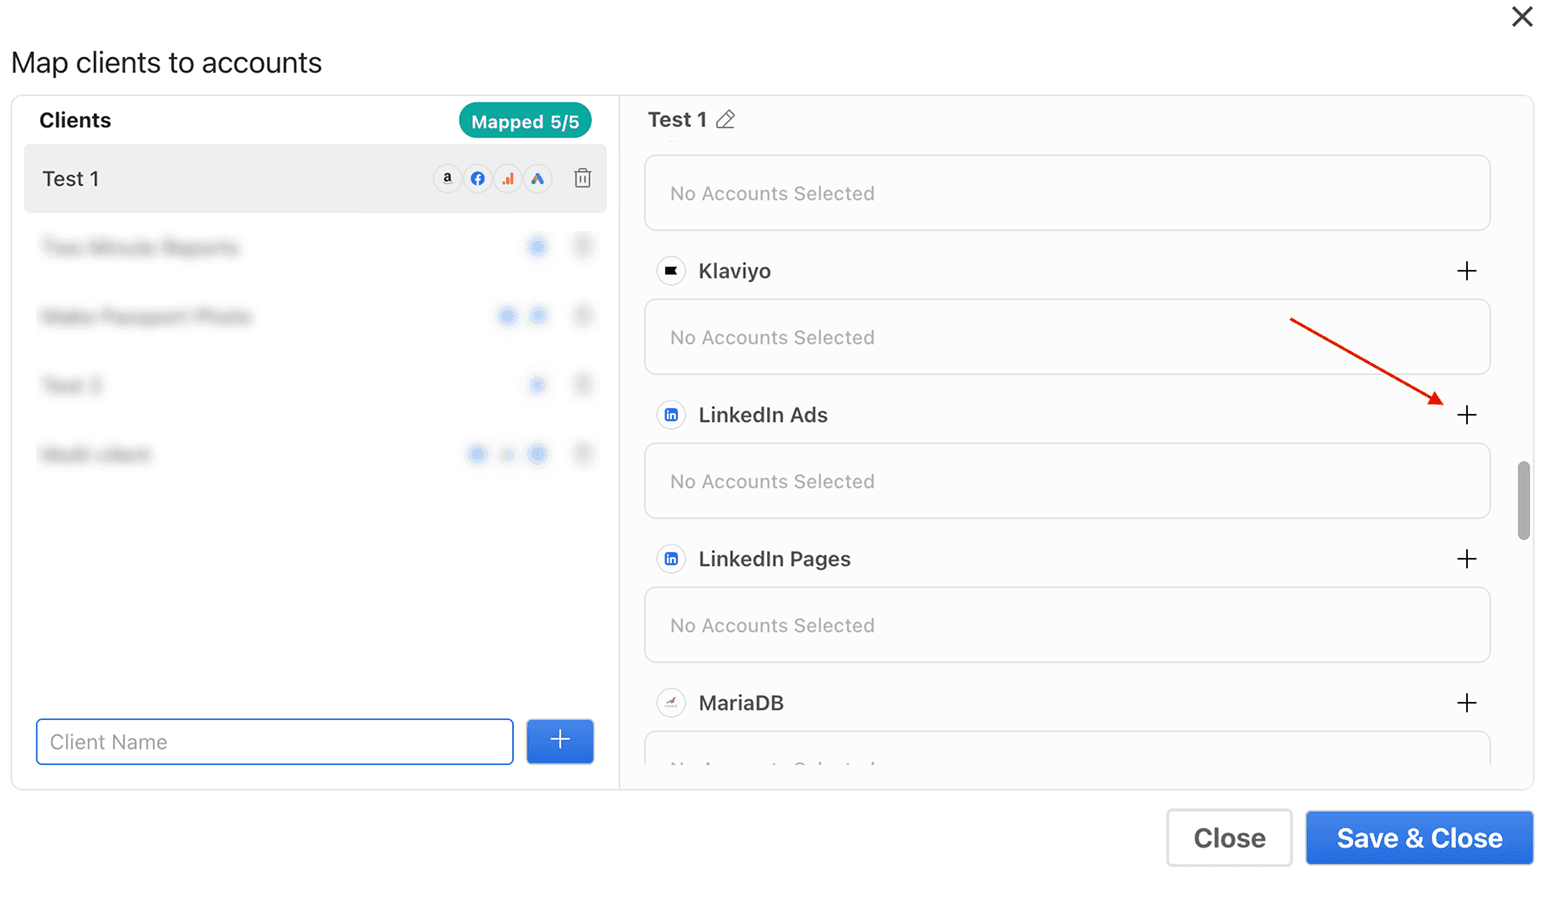
2. Alternatively, navigate to the “Clients” section. Click on “Manage clients” and map the necessary account details. Once done, click Save & Close to save your client’s details.

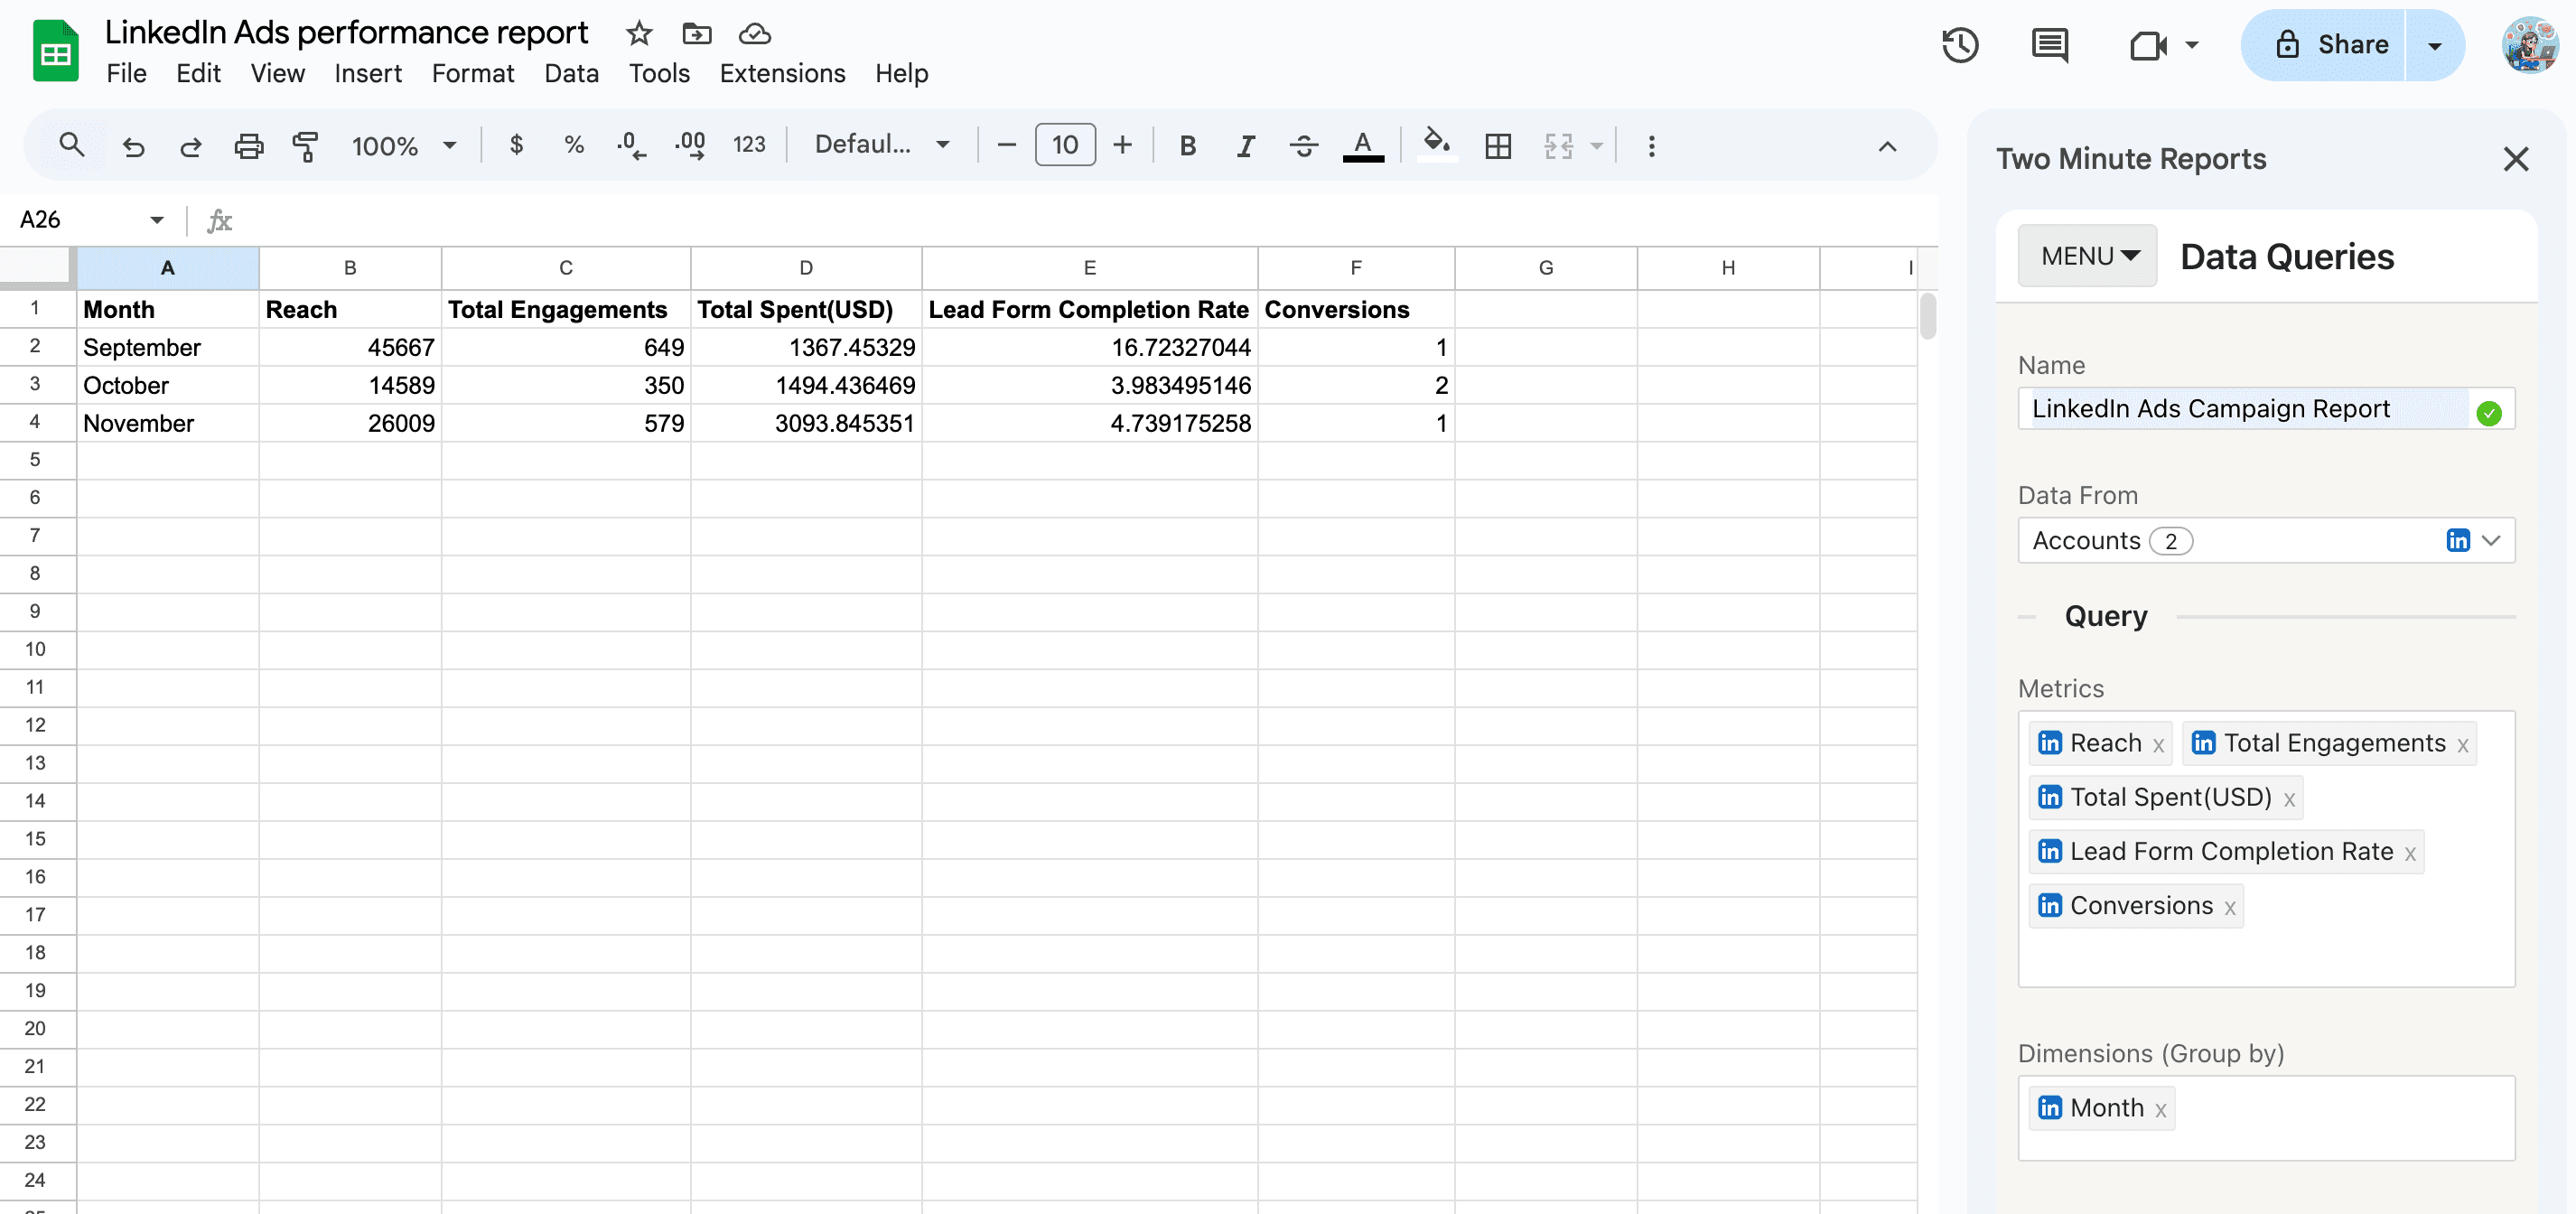
3. Next, add the required LinkedIn Ads metrics and dimensions you want to analyze. Then select the date range to track and measure campaign performance.
4. Once you finish the above steps, click Run Query to visualize the final results. This query fetches the data from your chosen LinkedIn Ads account onto the sheet and cell of your choice.

Pro tip: You can set up automated refresh schedules (daily, weekly or monthly) and keep your clients informed with real-time performance updates.
Pro TMR tip: Run all your queries directly from the Extensions menu on your Google Sheets. Go to Extension > Two Minute Reports > Choose your desired quick action.
While creating your LinkedIn Ads report through the sidebar is straightforward, there’s also another easier way to streamline your campaign performance analysis. Let’s look at leveraging LinkedIn Ads reporting via built-in templates.
Method 2: Create LinkedIn Ads report using pre-built templates
You can access the LinkedIn Ads templates for Google Sheets via: Extensions > Two Minute Reports > Templates.
- In the template gallery, you can choose your desired LinkedIn Ads template to streamline campaign performance tracking.
- Next, click Use to build your report. Your template will open in Google Sheets.
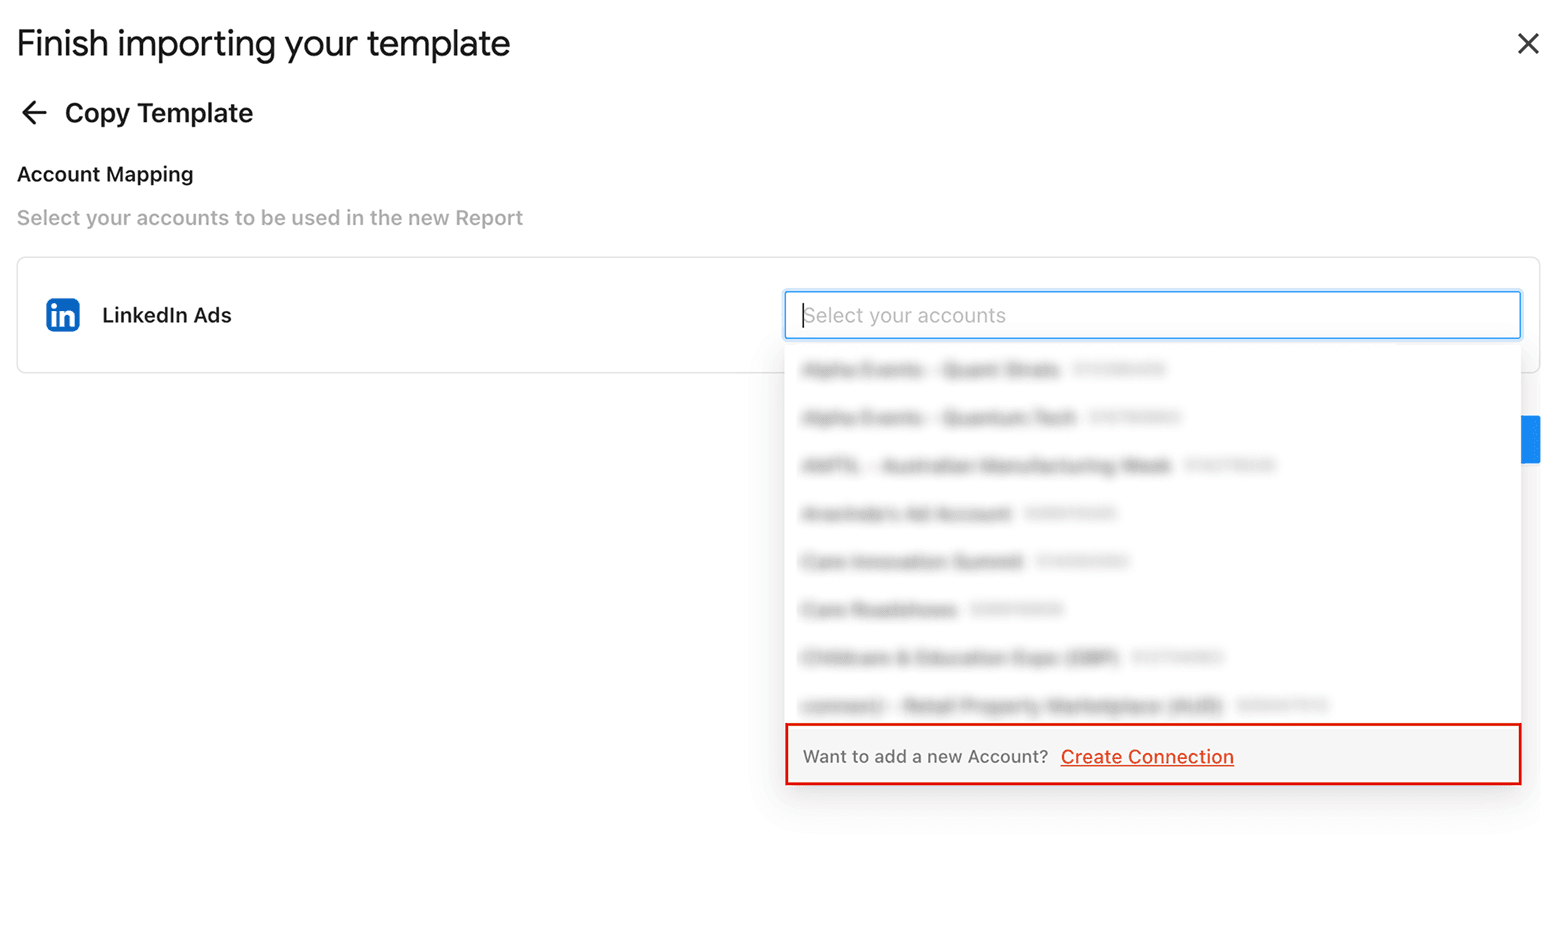
- Finish importing your template by selecting the required LinkedIn Ads accounts from the dropdown. Once done, click Submit to create your report.

- Next, click Extensions > Two Minute Reports > Run all queries to auto-populate your dashboard with actionable performance insights.
Why import LinkedIn Ads data to Google Sheets?
Here’s why importing LinkedIn Ads data to Google Sheets helps you align better reporting needs:
1. Customize reports for every campaign
Whether you’re working on an account-based marketing campaign or a lead-gen campaign, you must create personalized client reports. With Two Minute Reports’ LinkedIn Ads Google Sheets templates, you can easily map key KPIs and customize dashboards to adapt to any campaign structure, ensuring you have the data you need, in the preferred format you want.
2. Automate data workflows
Manually copying and pasting KPIs from native LinkedIn Ads dashboards is a struggle. To overcome this, you can set up custom refresh schedules to automatically import your latest LinkedIn Ads data directly into Google Sheets. This frees up your time to focus on the strategic aspects of your campaigns, such as refining creatives, audience targeting and conversion optimization.
3. Simplify multi-client reporting
By connecting LinkedIn Ads data to Google Sheets, you create a single hub for your campaign performance data. You can map required client accounts and visualize individual performance breakdown, making it easier to identify trends and spot new opportunities. You don’t have to juggle multiple spreadsheets or send mismatched reports to clients.
4. Streamline campaign adjustments
The ability to quickly assess campaign performance and make adjustments is crucial for maximizing ROI. By extracting key LinkedIn Ads metrics such as cost per lead, click-through rates, conversion rate, etc, you can spot which campaigns are performing better, and areas of improvement – whether it’s refining your targeting, adjusting your budget or creatives.
5. Ensure data consistency
To maintain data consistency across campaigns, you can use a LinkedIn Ads reporting tool to track and report up-to-date performance insights without manual effort. Accuracy in reporting is crucial for optimizing campaigns and maximizing ROI. Remember, even a small error can potentially mislead you into moving in the wrong direction.
Important metrics to measure your LinkedIn Ads campaign performance
Here are the top metrics you can track to analyze and enhance your campaign performance:
Get LinkedIn Ads data in Looker Studio
With the Two Minute Reports hub, you can easily integrate your LinkedIn Ads data to Looker Studio and create powerful campaign dashboards that reflect the effectiveness of your ad strategy. Visualize campaign performance by client, ad groups, ads and spot data-driven opportunities for increasing ROI.
Connect your PPC platforms with Google Sheets
Integrate Facebook Ads, LinkedIn Ads, Snapchat Ads, Google Ads, and other advertising platforms in a single Google Sheets dashboard using Two Minute Reports. Track key PPC metrics across all ad platforms, measure performance, and analyze cross-channel ROI. With unlimited reporting, faster data syncs, and automated workflows, stay on top of performance trends and accomplish your client’s goals.
Frequently Asked Questions
Install the Two Minute Reports add-on from the Google Workspace Marketplace. Next, open your spreadsheet, launch the sidebar, connect your LinkedIn Ads accounts and visualize actionable campaign performance insights within minutes without juggling spreadsheets.
With Two Minute Reports, you can set up custom refresh schedules – daily, hourly, weekly or monthly and ensure your campaign reports reflect the latest LinkedIn Ads campaign insights. This ensures you always stay on top of what’s happening, and implement proactive changes to optimize your client’s ROI.
You can access our free, ready-to-share LinkedIn Ads Google Sheets templates to streamline campaign tracking. Once you click “Use Template”, you can launch the Two Minute Reports add-on, import your client’s LinkedIn ad accounts, run queries and auto-populate the dashboard with meaningful insights.
With data blending, you can compare LinkedIn Ads with other advertising platforms, such as Meta, Google Ads, etc, into a single dashboard and visualize cross-channel ROI. No need to toggle between platforms or copy-paste KPIs manually.
You can select your client’s LinkedIn Ads accounts from the Two Minute Reports sidebar and consolidate key KPIs in one place. Alternatively, you can also reuse the existing reports across multiple clients, ensuring you focus more on strategy and accomplish your campaign goals.

Meet the Author
Shalini MuruganShalini is driven by ideas that create a tangible impact. At Two Minute Reports, she specializes in content that helps marketers optimize their reporting workflows. When she's not transforming complex data into meaningful insights, you might find her lost in a book, jotting down ideas in her notebook, or connecting the dots others overlook.