Summarize this blog post with:
Connect Google Analytics 4 to Google Sheets
With Two Minute Reports, an intuitive Google Sheets add-on, you can create actionable GA4 reports without hassle. Here is a step-by-step guide to getting Google Analytics 4 data to your Google Sheets.
To export GA4 data onto your Google spreadsheet, you need to install the Two Minute Reports add-on from the Google Workspace Marketplace.
Once installed, you can start creating your GA4 report in Google Sheets in two ways:
Method 1: Connect Google Analytics 4 to Google Sheets using the TMR Sidebar.
Method 2: Connect Google Analytics 4 to Google Sheets using the TMR's built-in templates.
Method 1: Connect GA4 data to Google Sheets using the TMR Sidebar
Step 1: Creating a Connection to your source
- Open a new Google Sheet and launch TMR from the Extensions menu. The TMR Sidebar will appear on the right side.
Note: The sidebar serves as the primary interface for TMR with all of its features.
- Go to the dropdown menu in the TMR sidebar and click Connections. Next, click Add to create a new Connection.
- The "Adding new connection" dialog box appears. Here, we will perform 3 key steps to establish a Connection in Google Sheets, which takes less than 2 minutes:
- Selecting the GA4 Connector
- Authentication
- Mapping your GA4 account with the respective Connector
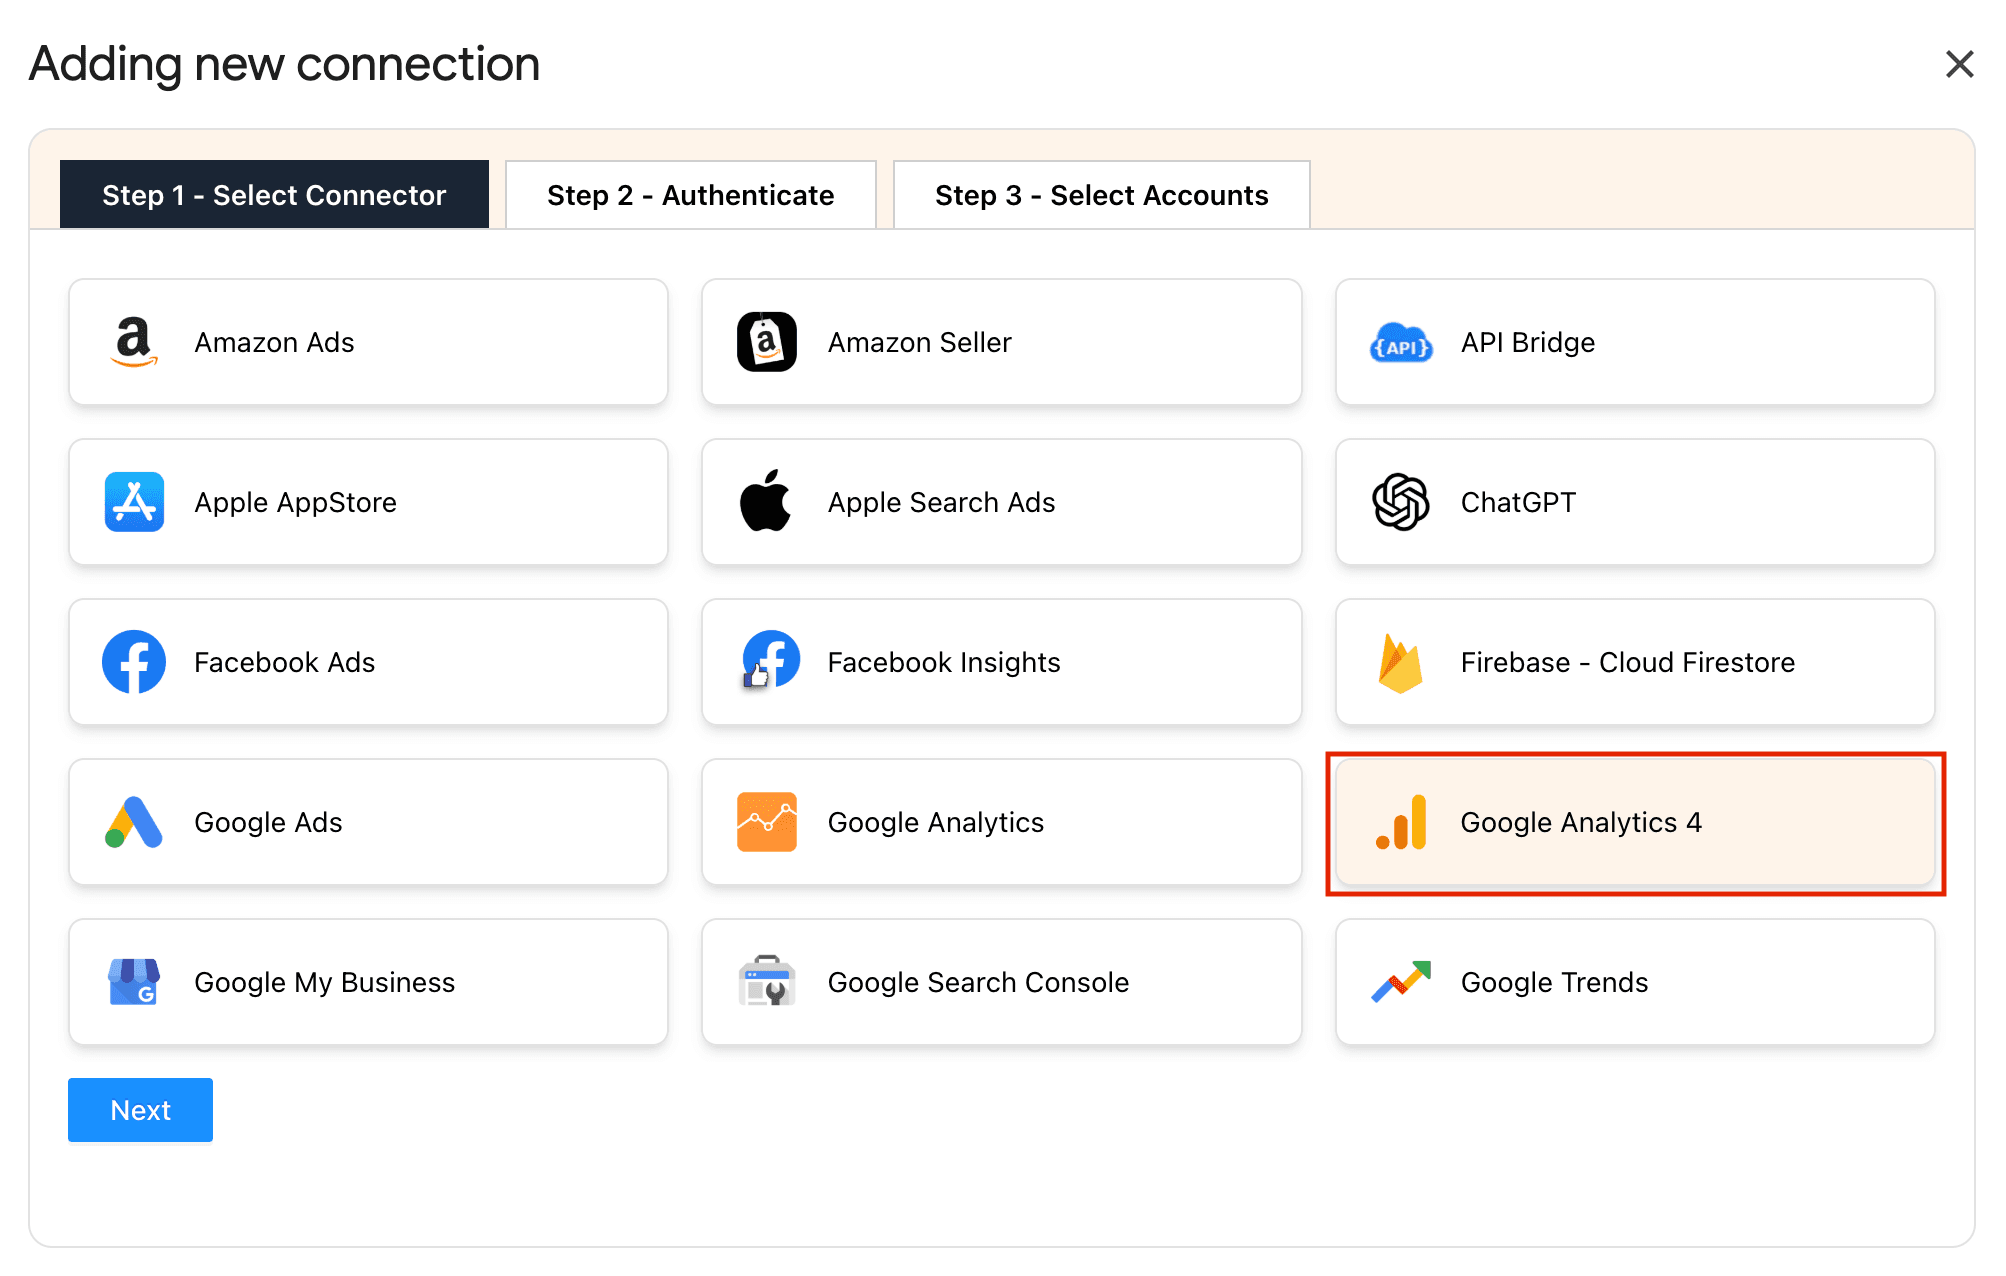

- Select GA4 Connector from the list of options. Next, authorize your Connection by specifying the login credentials.
- Once, you've successfully authenticated, you'll see a screen displaying Account name, ID, Connection name, and Status, as shown below:

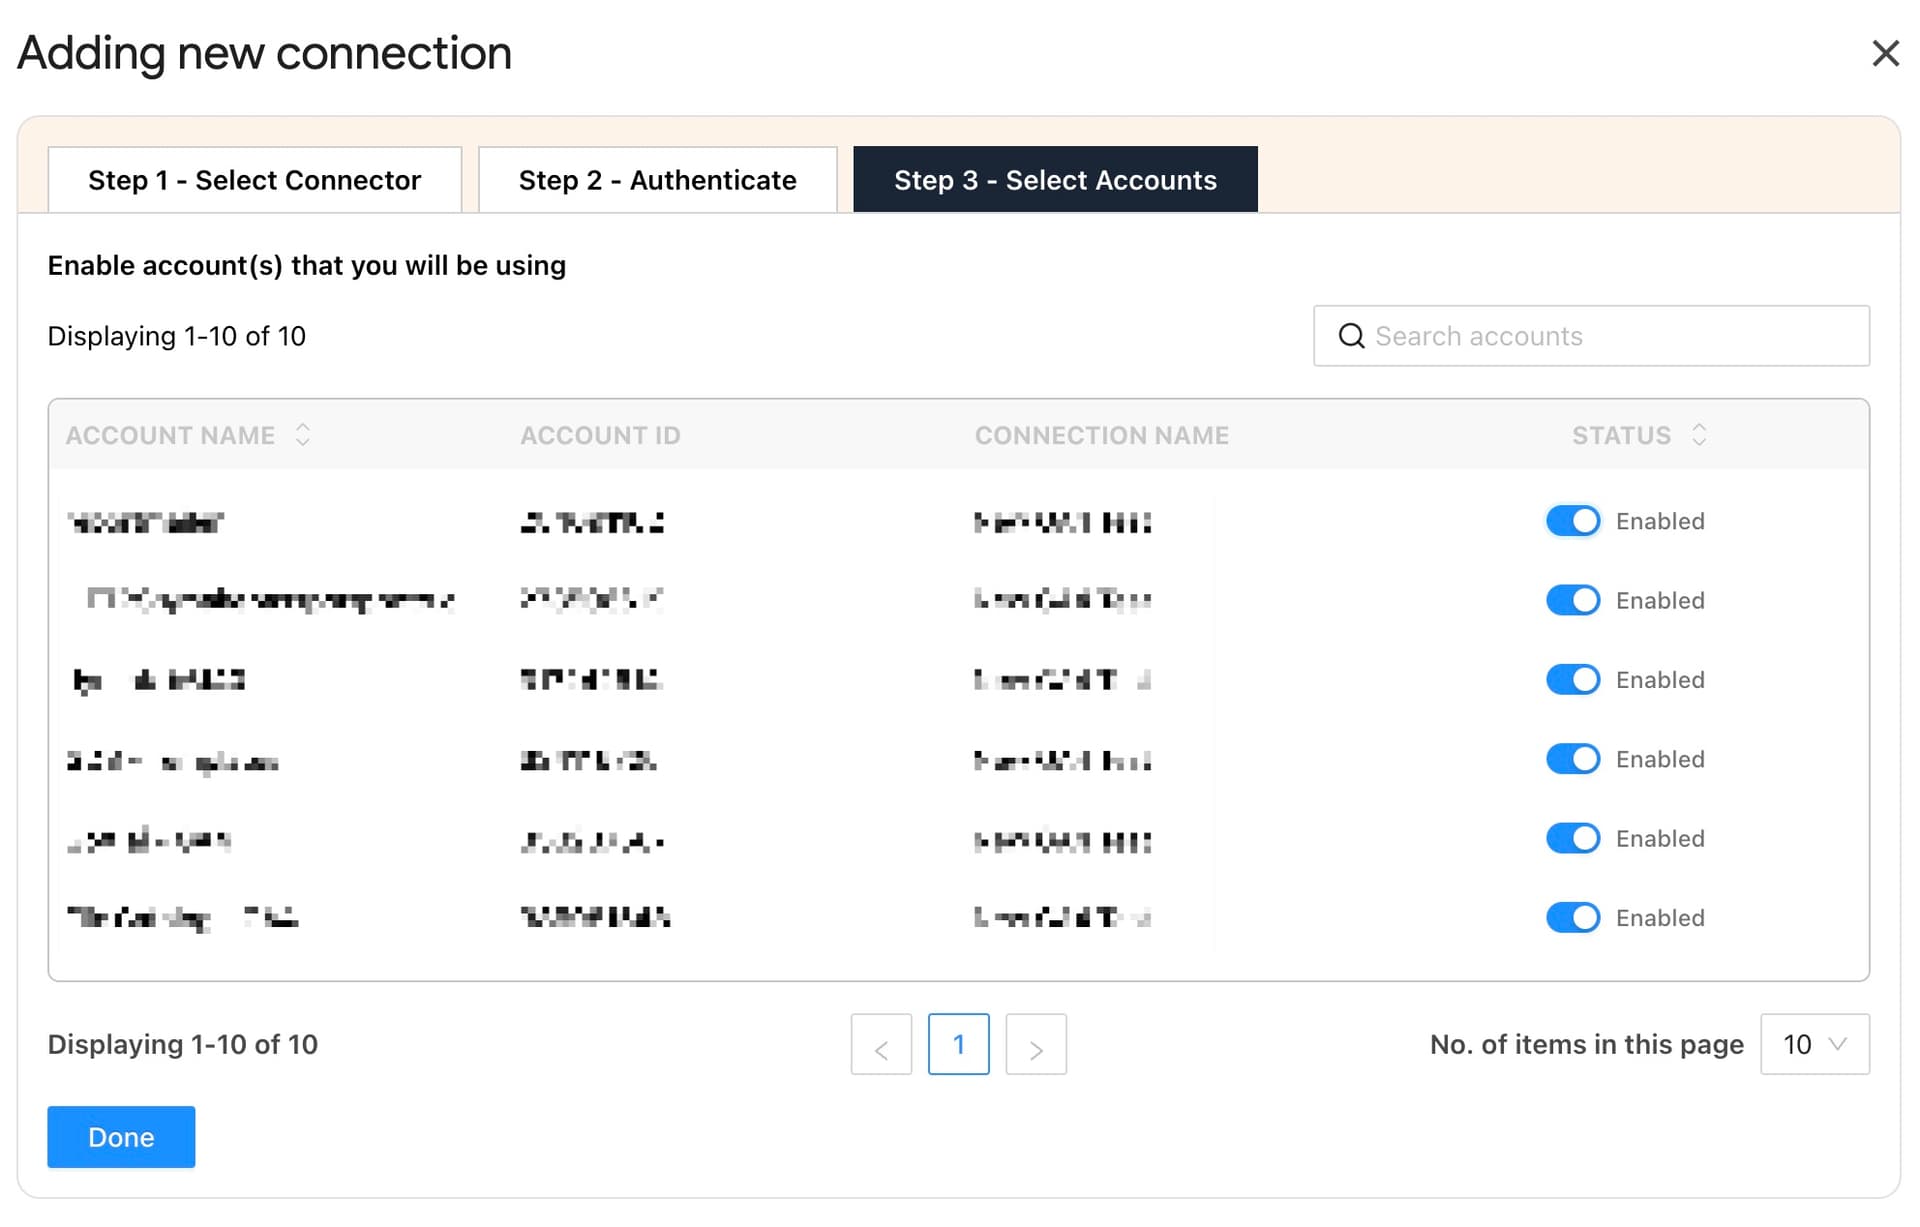
- Enable the toggle for the accounts you want to run queries. Please note that you cannot extract data for disabled accounts.
Note: Once you've enabled the associated accounts, you can hit "Refresh Connections" to ensure the connected accounts are reflected in the TMR Sidebar.
Now that the Connection is established, the next crucial step is to create a query. Let's explore how to do that.
Step 2: Creating a Query and Report Configuration
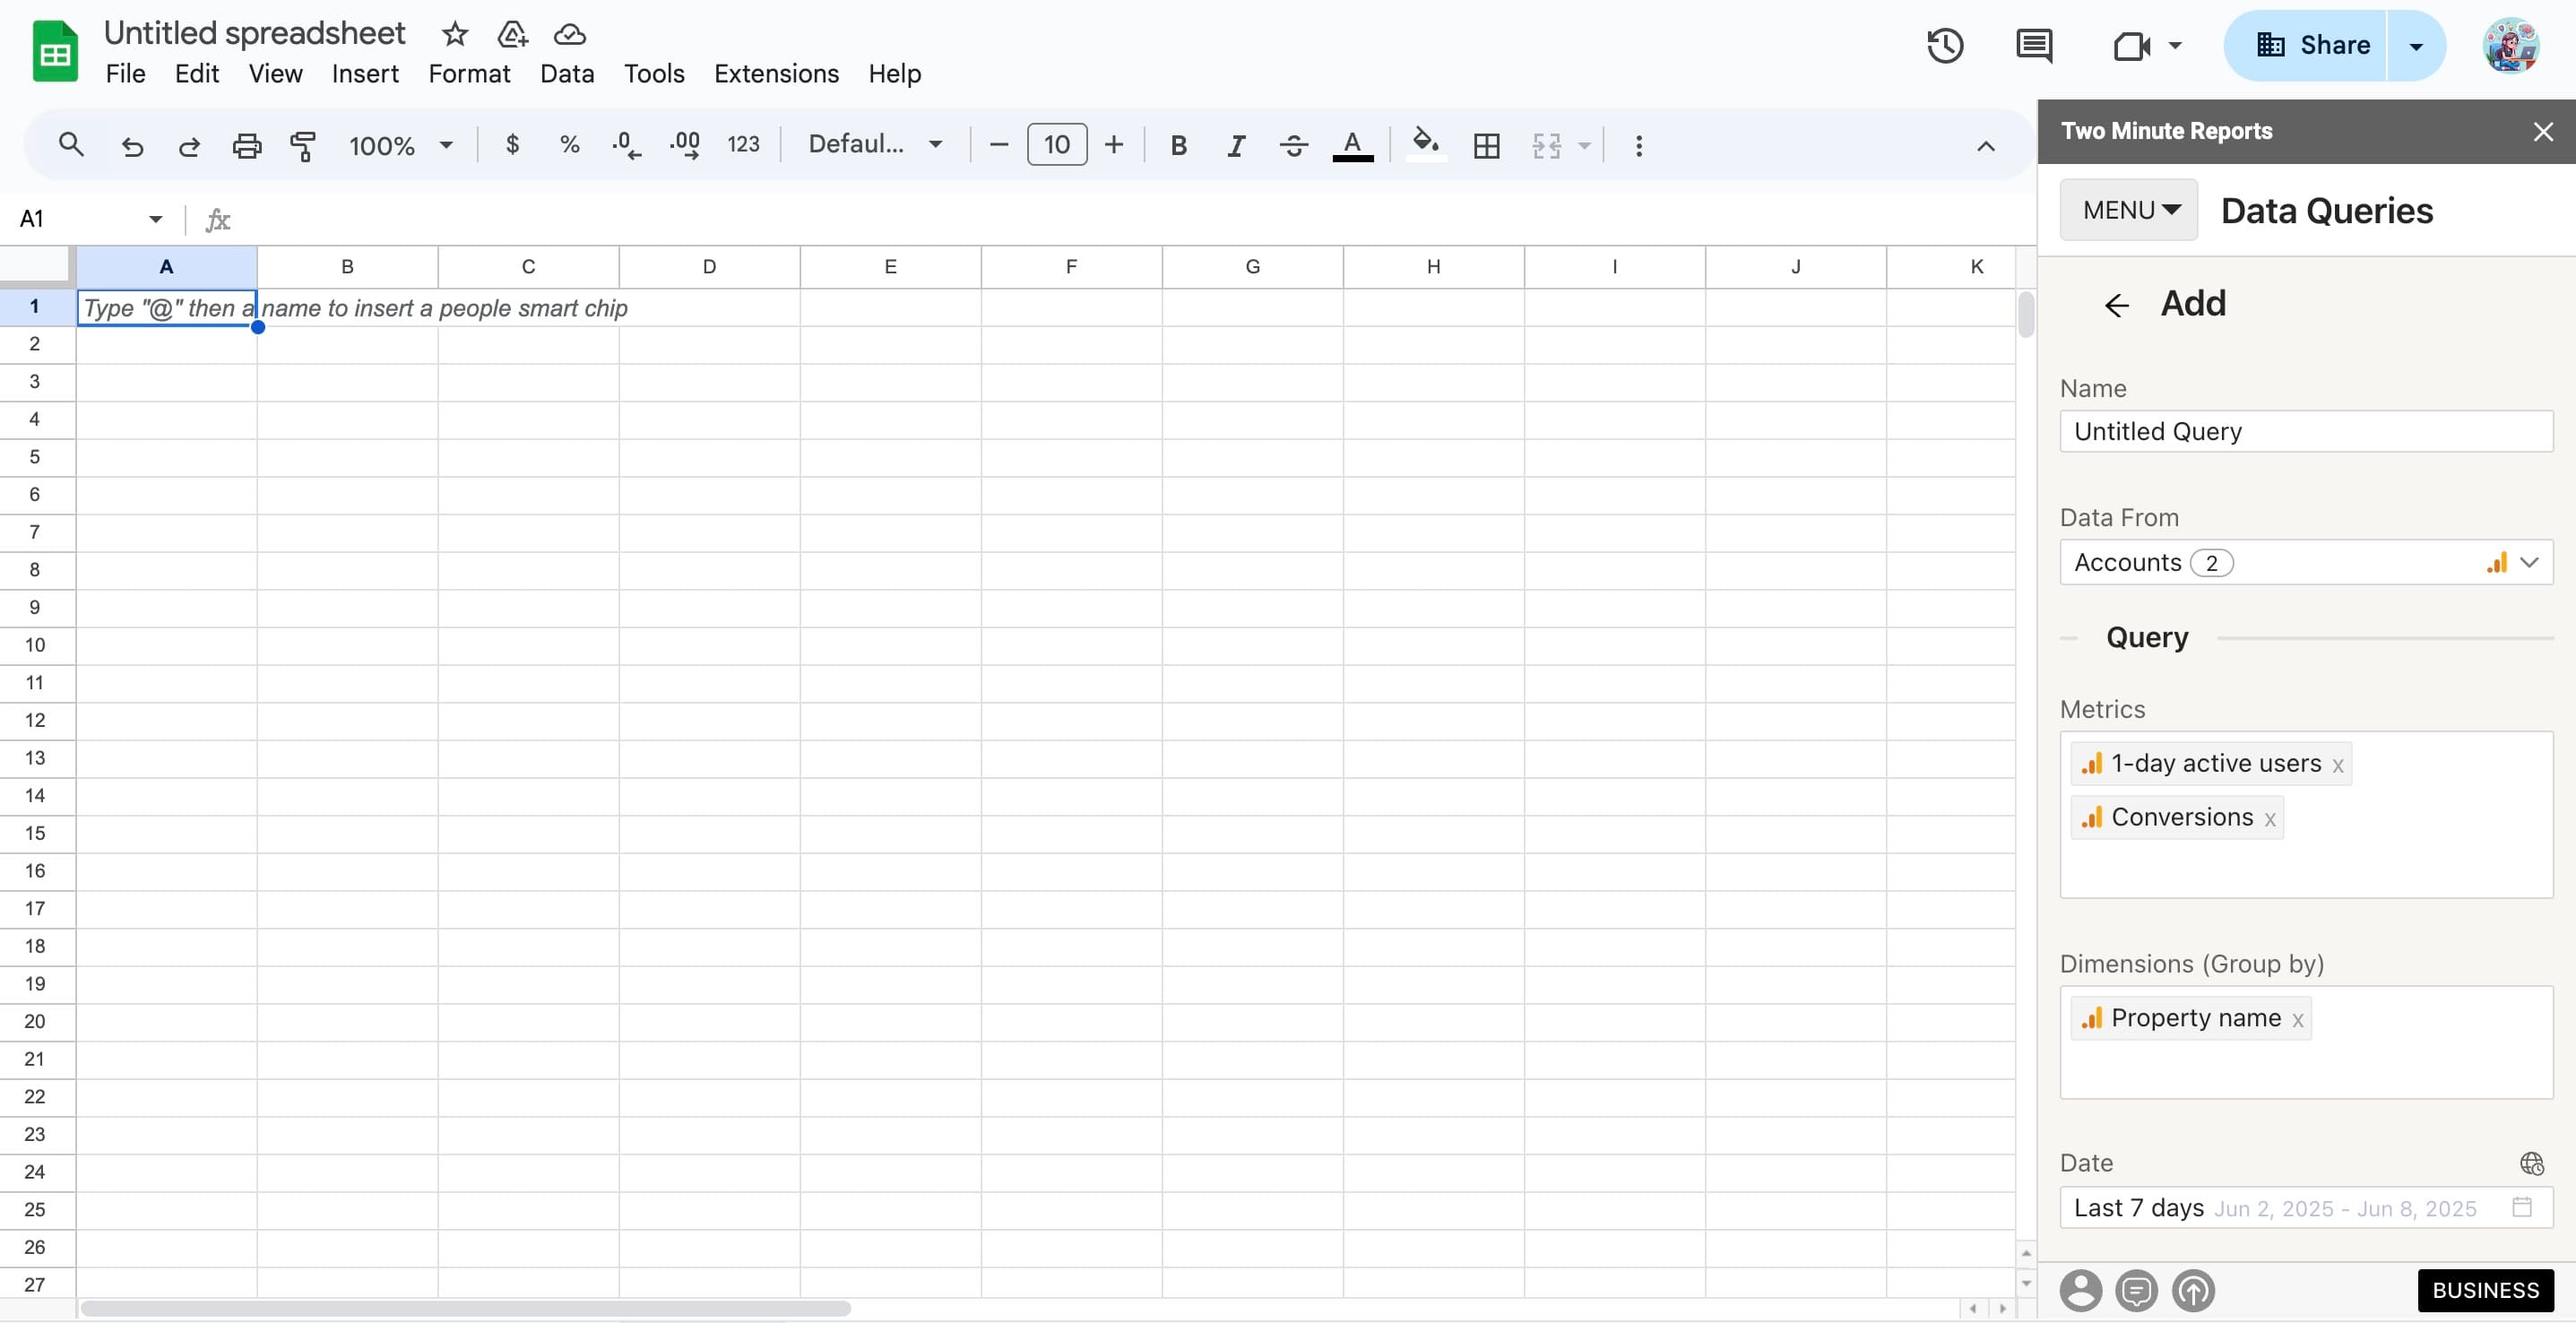
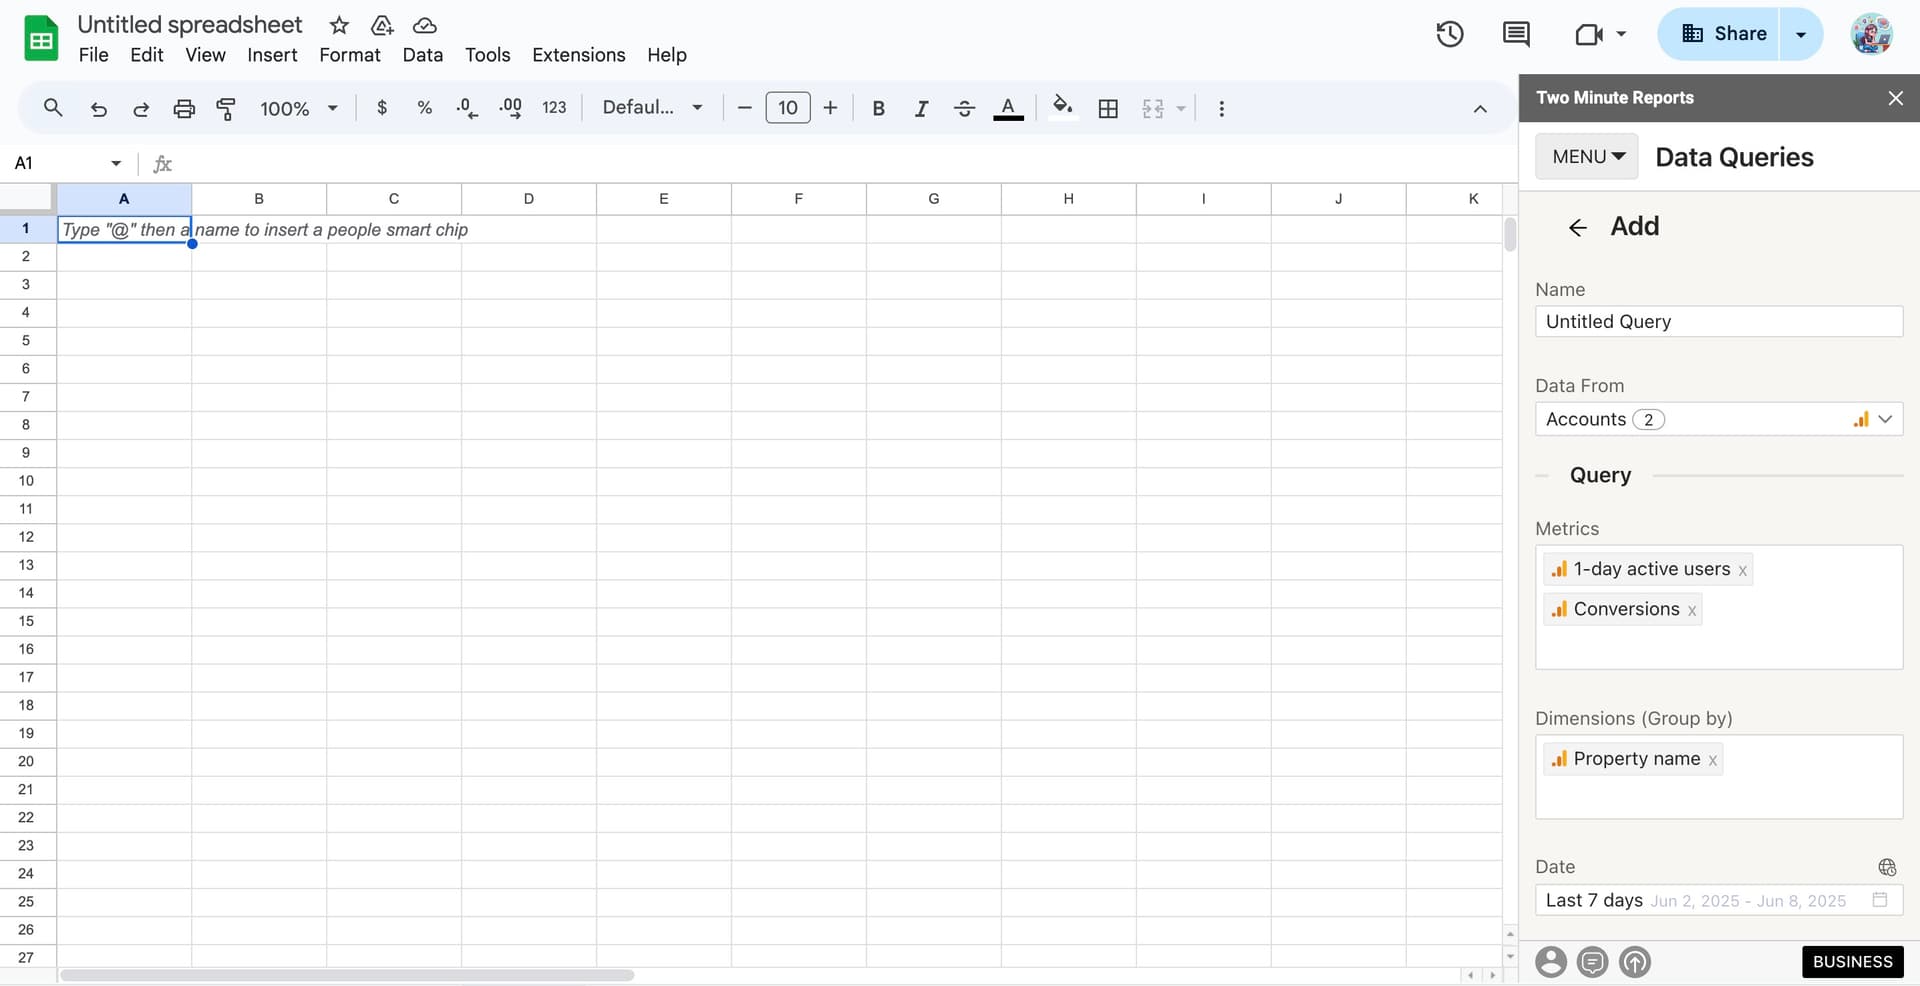
To pull your Google Analytics 4 data, navigate to the Data Queries section and create a new query.
- Click Add and choose the respective GA4 accounts to analyze your website or app performance.
Note: You can manage multiple client accounts under one roof. Simply select one or more accounts to measure and gather insights.
- Alternatively, navigate to the Clients section. Add your client and map their corresponding GA4 account.
- Click on "Manage Clients" and map the necessary account details. Once done, click Save & Close to save your client's details for future reference.
- Next, add the GA4 metrics and dimensions you want to analyze. Once done, select the date range to track your website performance.
- Next, you must configure your data reporting by choosing how to customize it. You can filter and organize your data directly from the sidebar.
- Once you have finished the above steps, click 'Run Query' to visualize the output. This query fetches the data from the data source onto the sheet and the cell of your choice.
Pro TMR Tip: Run all your queries directly from the Extensions menu on your Google Sheets. Go to Extensions > Two Minute Reports > choose your desired quick action.
While creating your report through the sidebar is straightforward, there's another easy option to streamline GA4 reporting in Google Sheets. Let's look at how to leverage built-in templates for GA4.
Method 2: Get GA4 data to Google Sheets using Templates
To use TMR templates, create a Connection and authorize it from Step 1 in the previous method.
- Once the Connection is created and authorized, you can access the Templates Gallery from the Two Minute Reports sidebar menu.
Note: You can also open the Templates Gallery directly from Extensions > Two Minute Reports > Templates.
- In the Template Gallery, you can filter the templates based on your needs via category or data source.
- Once you find the right GA4 template, click "Use" to build your template. Then, choose your preferred data source and the relevant Accounts.
- Name your report and click "Submit" to create the report.
Note: Your report will be created in the new Google Spreadsheet.
- Once done, click View Report to open your template in Google Sheets.
- Your new report opens up. Next, click Extensions > Two Minute Reports > Run all queries to update your template with data within the date range.
- Once the queries are complete, the GA4 template will be updated with your data.
Scheduling data refresh and emails
With the Schedule Refresh feature, TMR automatically refreshes your queries to the desired date, time, and duration. This feature is convenient for sending emails or refreshing your spreadsheets with live data and using them as a dashboard.
Here's how you set this feature up:
- Click on the menu and then on the Schedule Reports to open the section. From this section, you can create a "Schedule" that instructs TMR to run the query automatically.
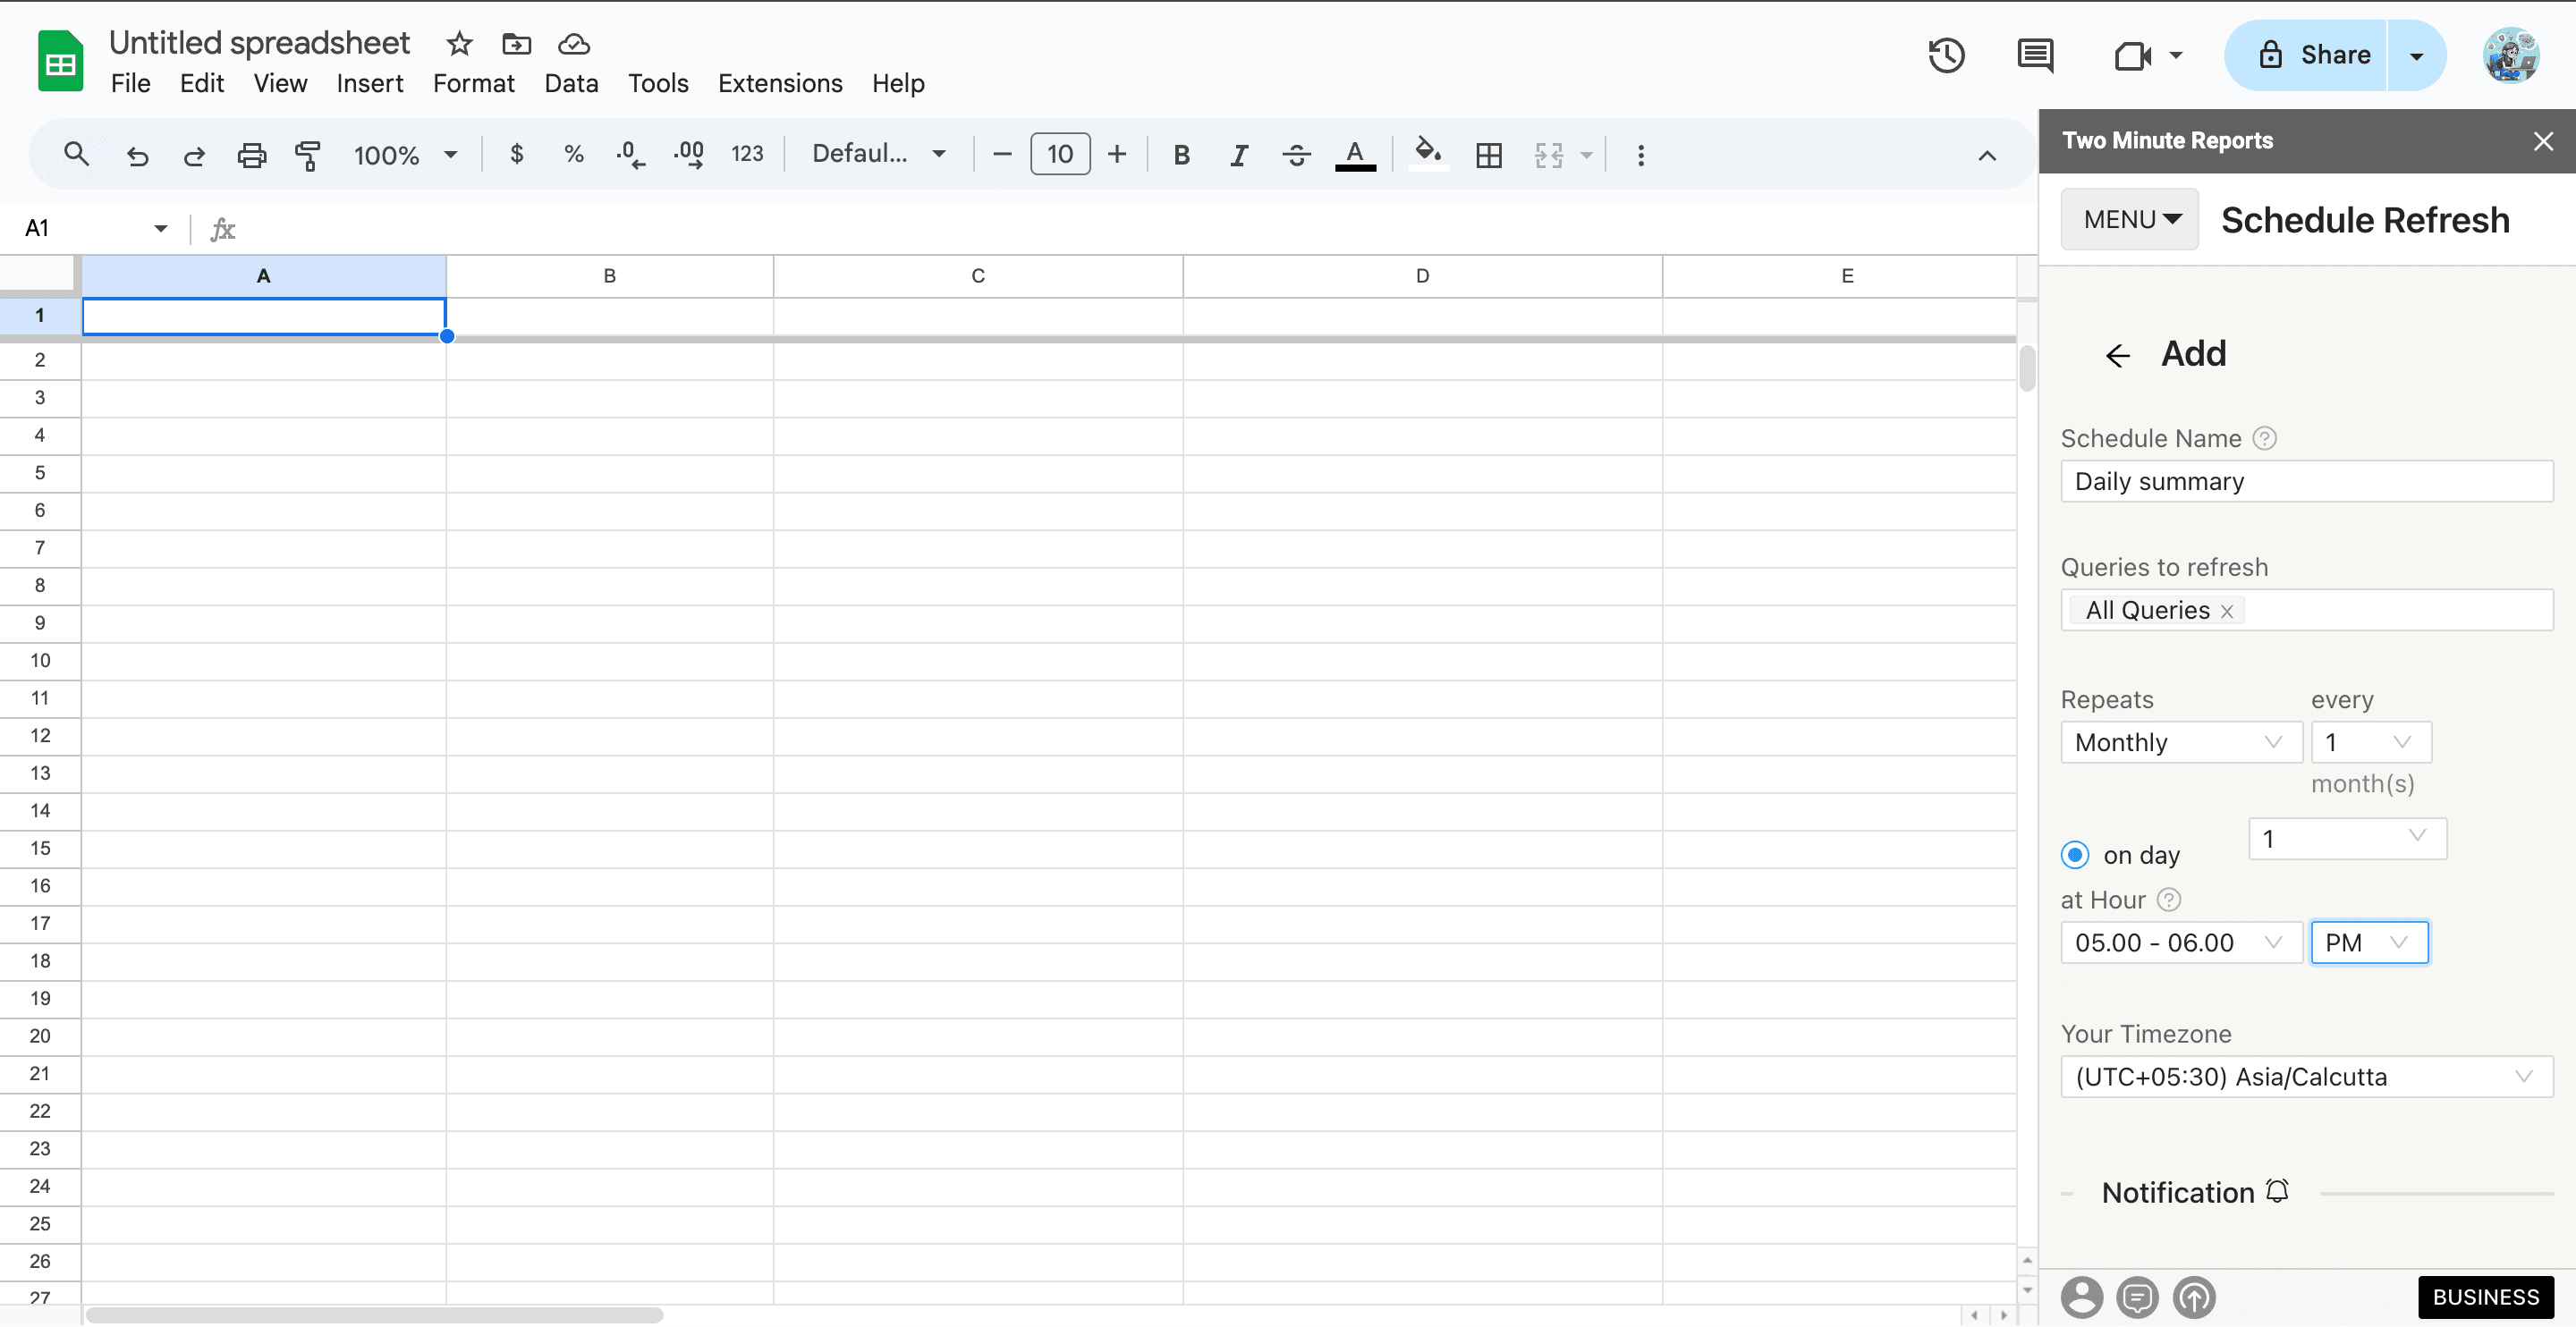

- Name the Schedule and choose the time interval between the data refreshes. From this section, you can choose the refreshing frequency, the designated day for refresh, and the time for refresh.
- Choose the Action for every data refresh - choose whether you need an email notification for every refresh.
- Then choose the relevant sheet for the refresh and type in your email. Finally, choose the reporting format based on your requirements.
- Save the refresh and ensure that TMR will refresh your data at the desired intervals.
Continue reading about this feature - "How to Refresh Data Automatically in Google Sheets?"

Why import Google Analytics 4 Data in Google Sheets?
Google Sheets has been a popular option for all report creation, including Google Analytics 4, Google Ads, and Facebook (Meta) Ads: all for the best reasons.
Add-ons and Extensions
Google Sheets have the ability to integrate several key functions through add ons. For example, with an add on like Two Minute Reports, you can extract data, manage data, create reports, and even schedule reports.
Optimized Data Management
By constantly integrating your Google Analytics data to Google Sheets, you can get rid of downloading CSV files, analysing, and creating reports manually. Real-time data is fresh, and actionable, and ensures that you’re always working with the most current information.
Comprehensive Data Analysis
Insightful Metrics and Collaborative Accessibility are key benefits when using Google Sheets to manage your website/app’s performance. With a Google Analytics add on, you can dissect and analyze data, compare them, and create custom metrics that align with your business goals.
Collaborative Access
Building a Google Analytics spreadsheet also allows for seamless collaboration between functions in your organisation. The ease of data accessibility allows teams to work together with real-time data, fostering a highly collaborative environment.
Customization and Flexibility:
Importing Google Analytics 4 data into Google Sheets allows you to customize your reports according to your specific needs. Google Sheets allows proper arrangement of the metrics and dimensions that are most relevant to your business goal for effective analysis.
Workflow Efficiency
Setting up automated workflows to channel data from Google Analytics 4 to Google Sheets, effectively streamlines the data journey from source to analysis. This process ensures seamless synchronization when you connect Google Analytics to Google Sheets, enabling consistent workflow management by keeping your datasets always synchronized.
Marketing Strategy Enhancement
When you export Google Analytics 4 data into Google Sheets, you can conduct multi-channel analyses to simultaneously evaluate performance across multiple channels. This approach enables you to make data-driven decisions that enhance the effectiveness of your marketing strategy.
Top KPIs to export in GA4 Google Sheets Reports
Basic
Google Analytics data can provide basic information about your application or website which helps you understand the users from your website. Add these information to your data report to optimize your website/app’s operations, improve engagement, and experience.
TMR’s add on can fetch several important metrics like:
- Number of Sessions
- Total Users
- Views
- New Users
- Engaged Sessions
- Engagement Rate
- Active Users
- Total User Engagement Duration
- Average Session Duration
- 7-day active users
Performance
Google Analytics data under this category can help you determine the performance to increase engagement and optimize your website/app:
Some important metrics in our add on include:
- Popular Pages/Screens
- First-Time Visitors
- Engaged Sessions and Users
- Engagement Rate
- Active Users
- User Engagement Duration
Event
The Google Analytics data under this category helps you analyze the most popular events on your website/app, and their frequency. These insights can help improve events and improve revenue with increased ARPU(Average revenue per user).
- Conversion rates
- Event Counts
- Revenue
- Transactions
This category also helps you learn about your users’ behavior with metrics such as:
- Events per Session
- Events Count per User
Time
Analyzing the date of the event with Google Analytics 4 helps you identify patterns in user behavior, compare data points across months, and identify trends to optimize operational strategy.
Some metrics that are covered in our add on include the Month, Year, or even the Week number of the Event, in both Saturday-to-Monday or Monday-to-Sunday formats. TMR also allows you to use the Year-Month format to create concise and reader-friendly reports.
Session Source
Identify where your site visitors originate from the Session Source metrics to optimize your marketing campaigns, analyze user behavior, and track your site’s growth.
Some important metrics from our add on include:
- Source
- Medium
- Channel Grouping
- Campaign Name
- Keyword(s)
- Group Name
Content
This Google Analytics data can be prominent indicators of your website/app’s performance. Optimizing content can help improve content operations, and make data-driven decisions.
Some actionable metrics in our add on include:
- Page Path, Title, and Location from Frequent User Visits
- Landing page from Frequent User Visits
- Page Path, Query String, and Screen Class to understand User Interaction
Geo
Discover where your audience is from with Google Analytics 4’s Geo Metrics. This information can help target marketing efforts and improve User Experience for the corresponding locations. This data can also help you identify potential regions to target first.
Some popular metrics in our add on include:
- Country
- City
- Region
Property
These specific data are focussed on user behavior across different platforms. These insights will help you improve User Experience, and monitor which versions of your website/app perform the best.
Some important metrics include:
- Source of Traffic
- Host Name
- Stream Name
- Stream ID
Device
These Google Analytics data can help you track the devices your users use to visit your website/app. Use these insights to improve design, optimize User Experience, and optimize language code for content targeting. Some effective metrics include:
- Type of Device
- Operating System
- Language Setting
- Screen Resolution
- Browser
- Device Model and Manufacturer
E-commerce Metrics
The Website/App is the largest asset in the e-commerce biz. Identifying the top-selling products, the effectiveness of functions, product categories, and the checkout process are crucial to improving experience and increasing conversions. If you’re in the e-commerce biz, add these Google Analytics data to your data report.
- Purchases
- Item Revenue
- Item Name
- Item Brand
- Item Category 3
- Add to carts
Get Google Analytics data in Looker Studio
Two Minute Reports can be installed as an add on to integrate Google Analytics 4 data with Looker Studio (formerly Google Data Studio) as well, enabling advanced data analysis and visualization.
This Google analytics add on allows the creation of detailed reports and dashboards using insights from Google Analytics 4 insights without the complexity of manual data entry. Looker Studio’s customisation capabilities also lets users craft custom formulae in a user-friendly interface.
With seamless integration, comprehensive analytical capabilities, and automated workflows, strategic business intelligence from Google Analytics 4 has just become quicker and accessible.
Frequently Asked Questions
You can use our Google Sheets add on Two Minute Reports to get google analytics data in google sheets. Please go through the method 1 and method 2 mentioned in this article.
You can use our feature Schedule Reports to schedule the queries automatically at your preferred time to automate the whole process without manual intervention.
Google Sheets, paired with Two Minute Reports, streamlines data analytics by importing LinkedIn ads data directly into the sheets