TMR’s Microsoft (Bing) Ads Connector easily extracts relevant metrics for you and creates client-specific reports directly from Google Sheets with encrypted security. Before connecting Bing Ads data to Google Sheets, ensure you have the following permissions:
Required permissions
To connect your Microsoft Advertising account with Two Minute Reports, ensure you have the following:
- A Microsoft user account with at least Advertiser Campaign Manager access to the ad account. You can learn how to grant access to Microsoft Advertising accounts by following this quick guide.
- Your Microsoft account must have multi-factor authentication (MFA) enabled, which is required for API access. For more details, refer to Microsoft’s account security information.
Once you confirm these prerequisites, follow the steps below to connect your Bing Ads data to Google Sheets via TMR.
Step 1: Install and Launch Two Minute Reports
Here’s a step-by-step tutorial on how to install TMR in Google Sheets: How to install TMR in Google Sheets?
Once installed, connect your Microsoft (Bing) Ads account with Two Minute Reports to extract your campaign performance data.
Step 2: Create a new Connection to streamline Microsoft (Bing) accounts
| A Connection is a link between the data source and the Connector. To fetch data from Bing Ads, use the Bing Ads Connector to create a new Connection with your Bing Ads account. |
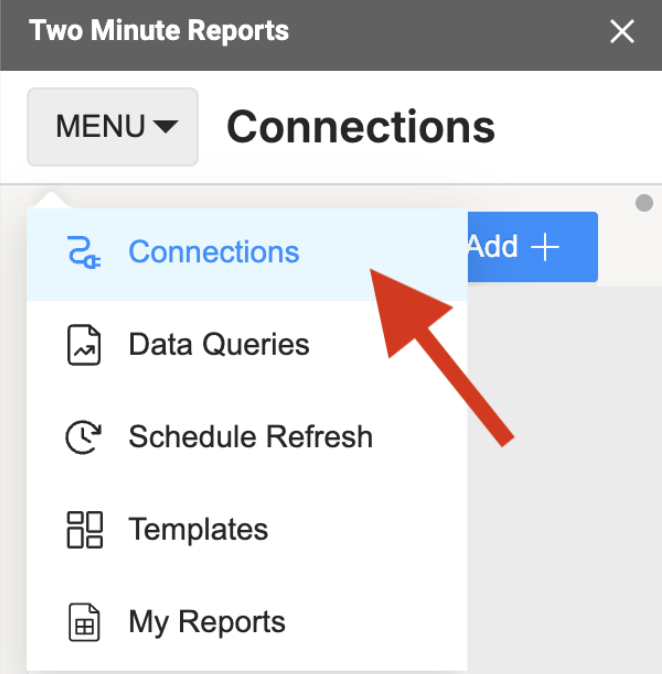
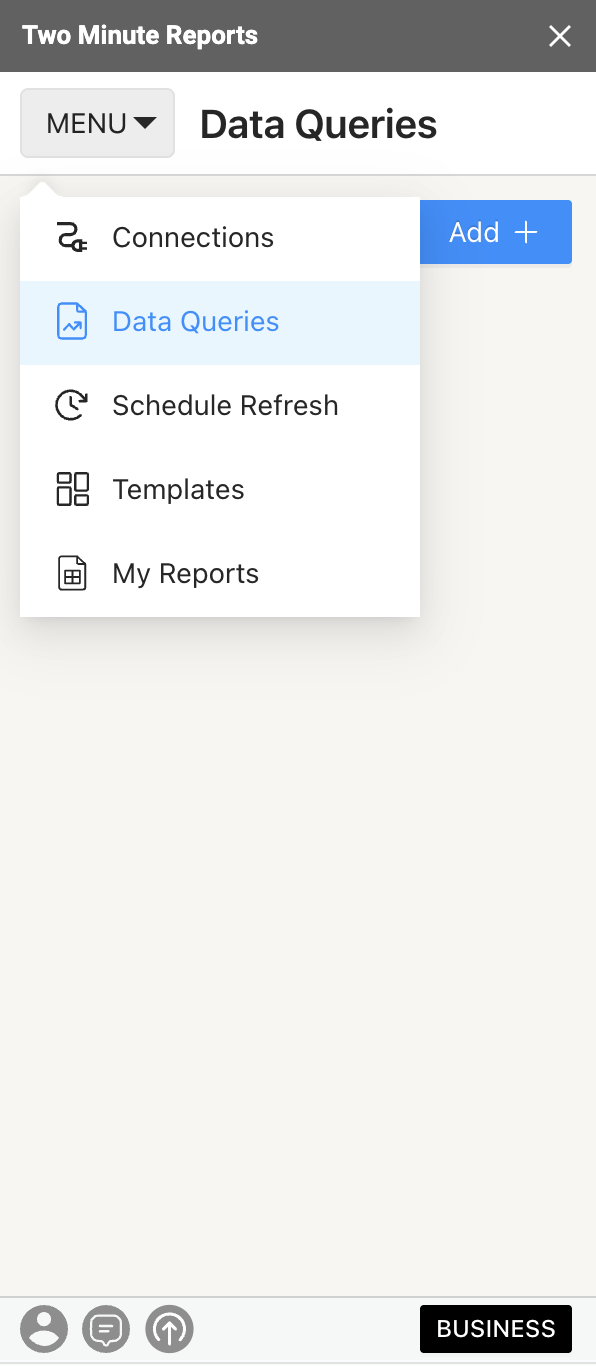
Step 1: Click the Menu at the top left of the sidebar and navigate to the Connections section. Then, click Add to create a new Connection.
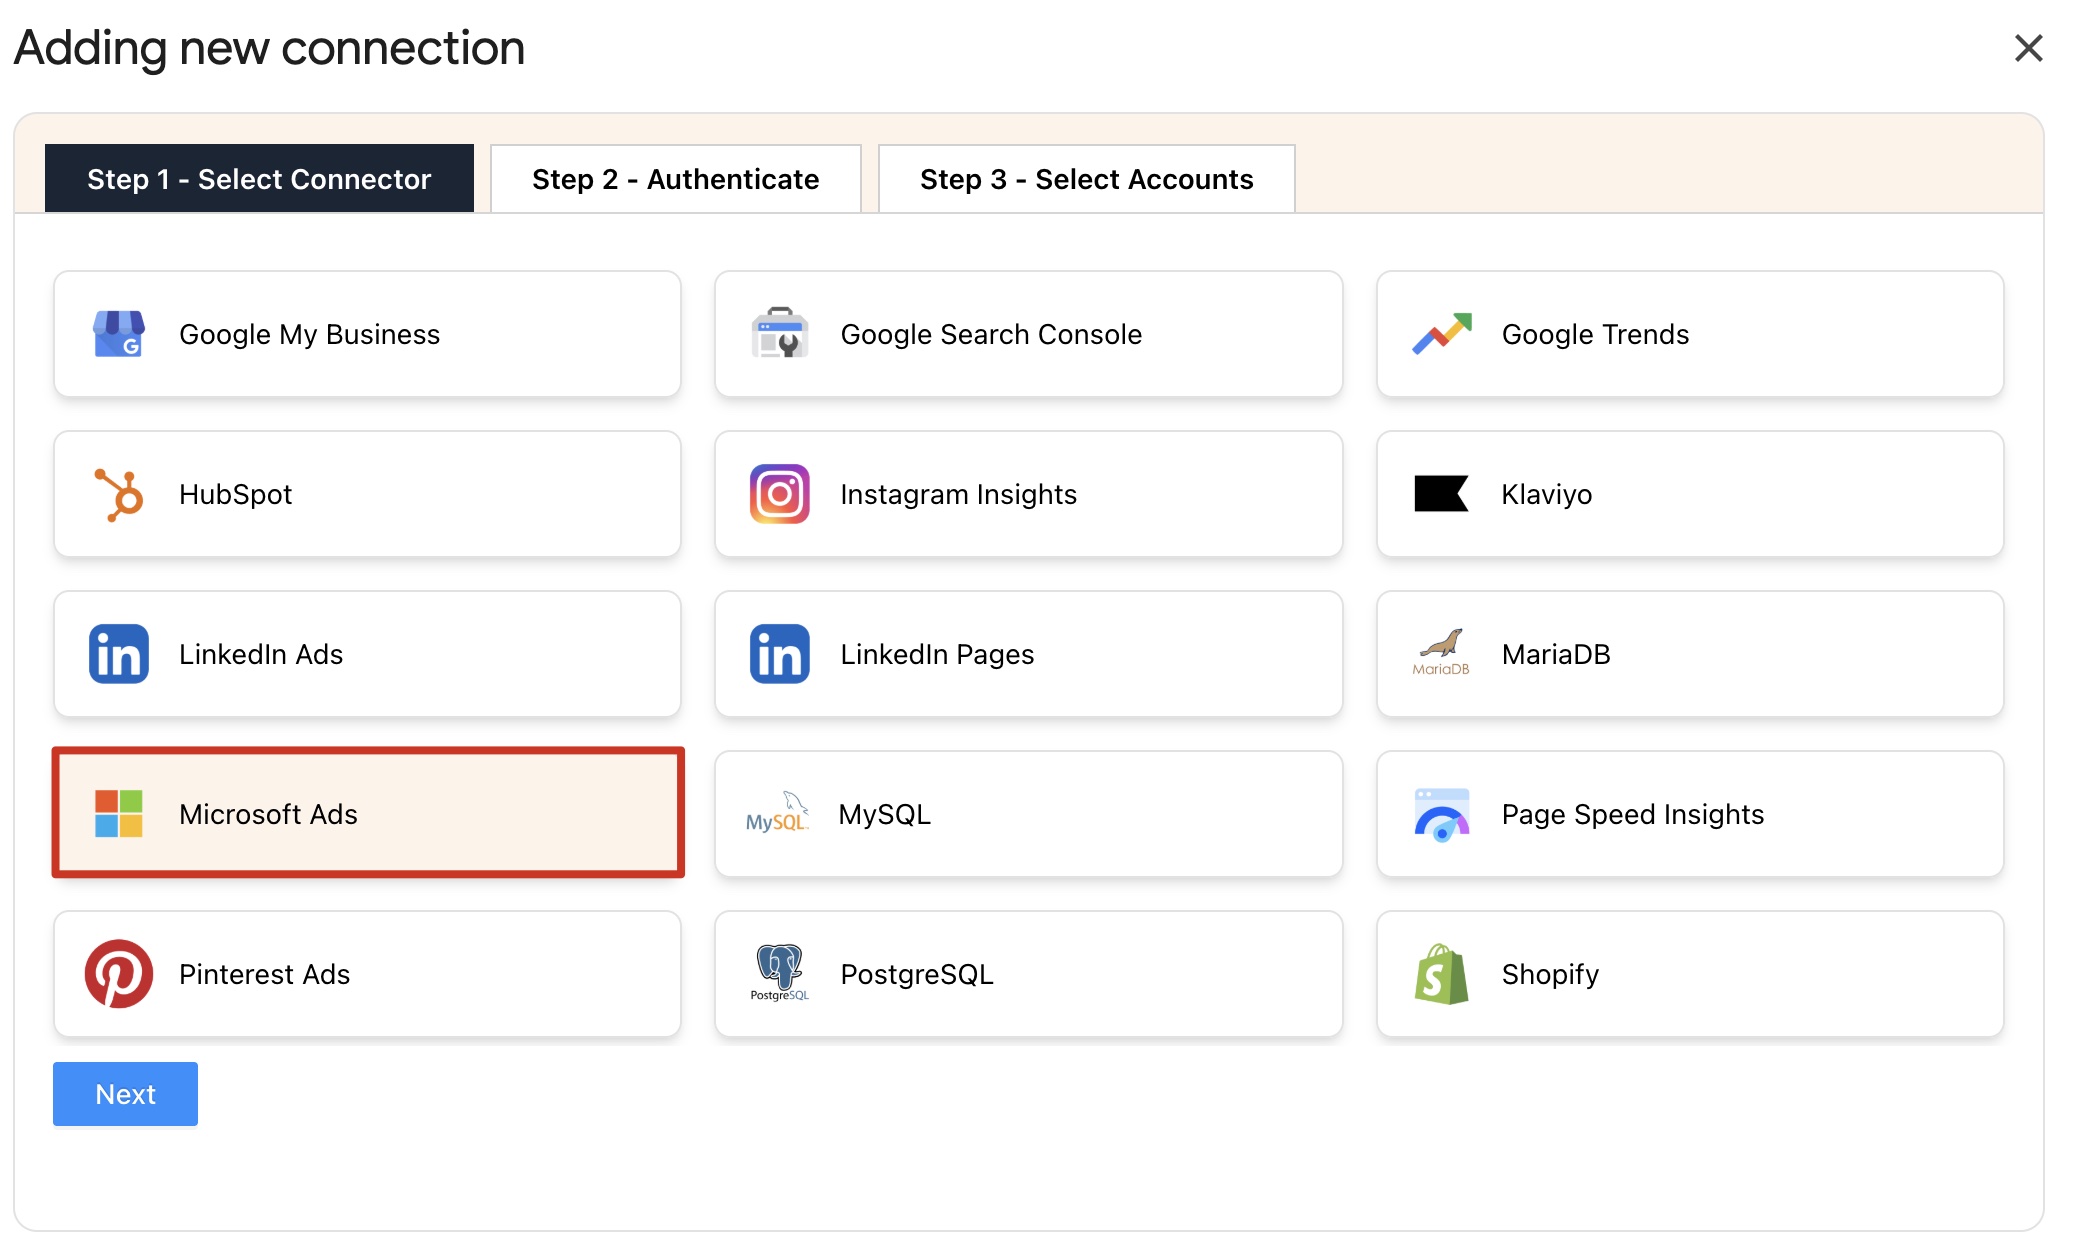
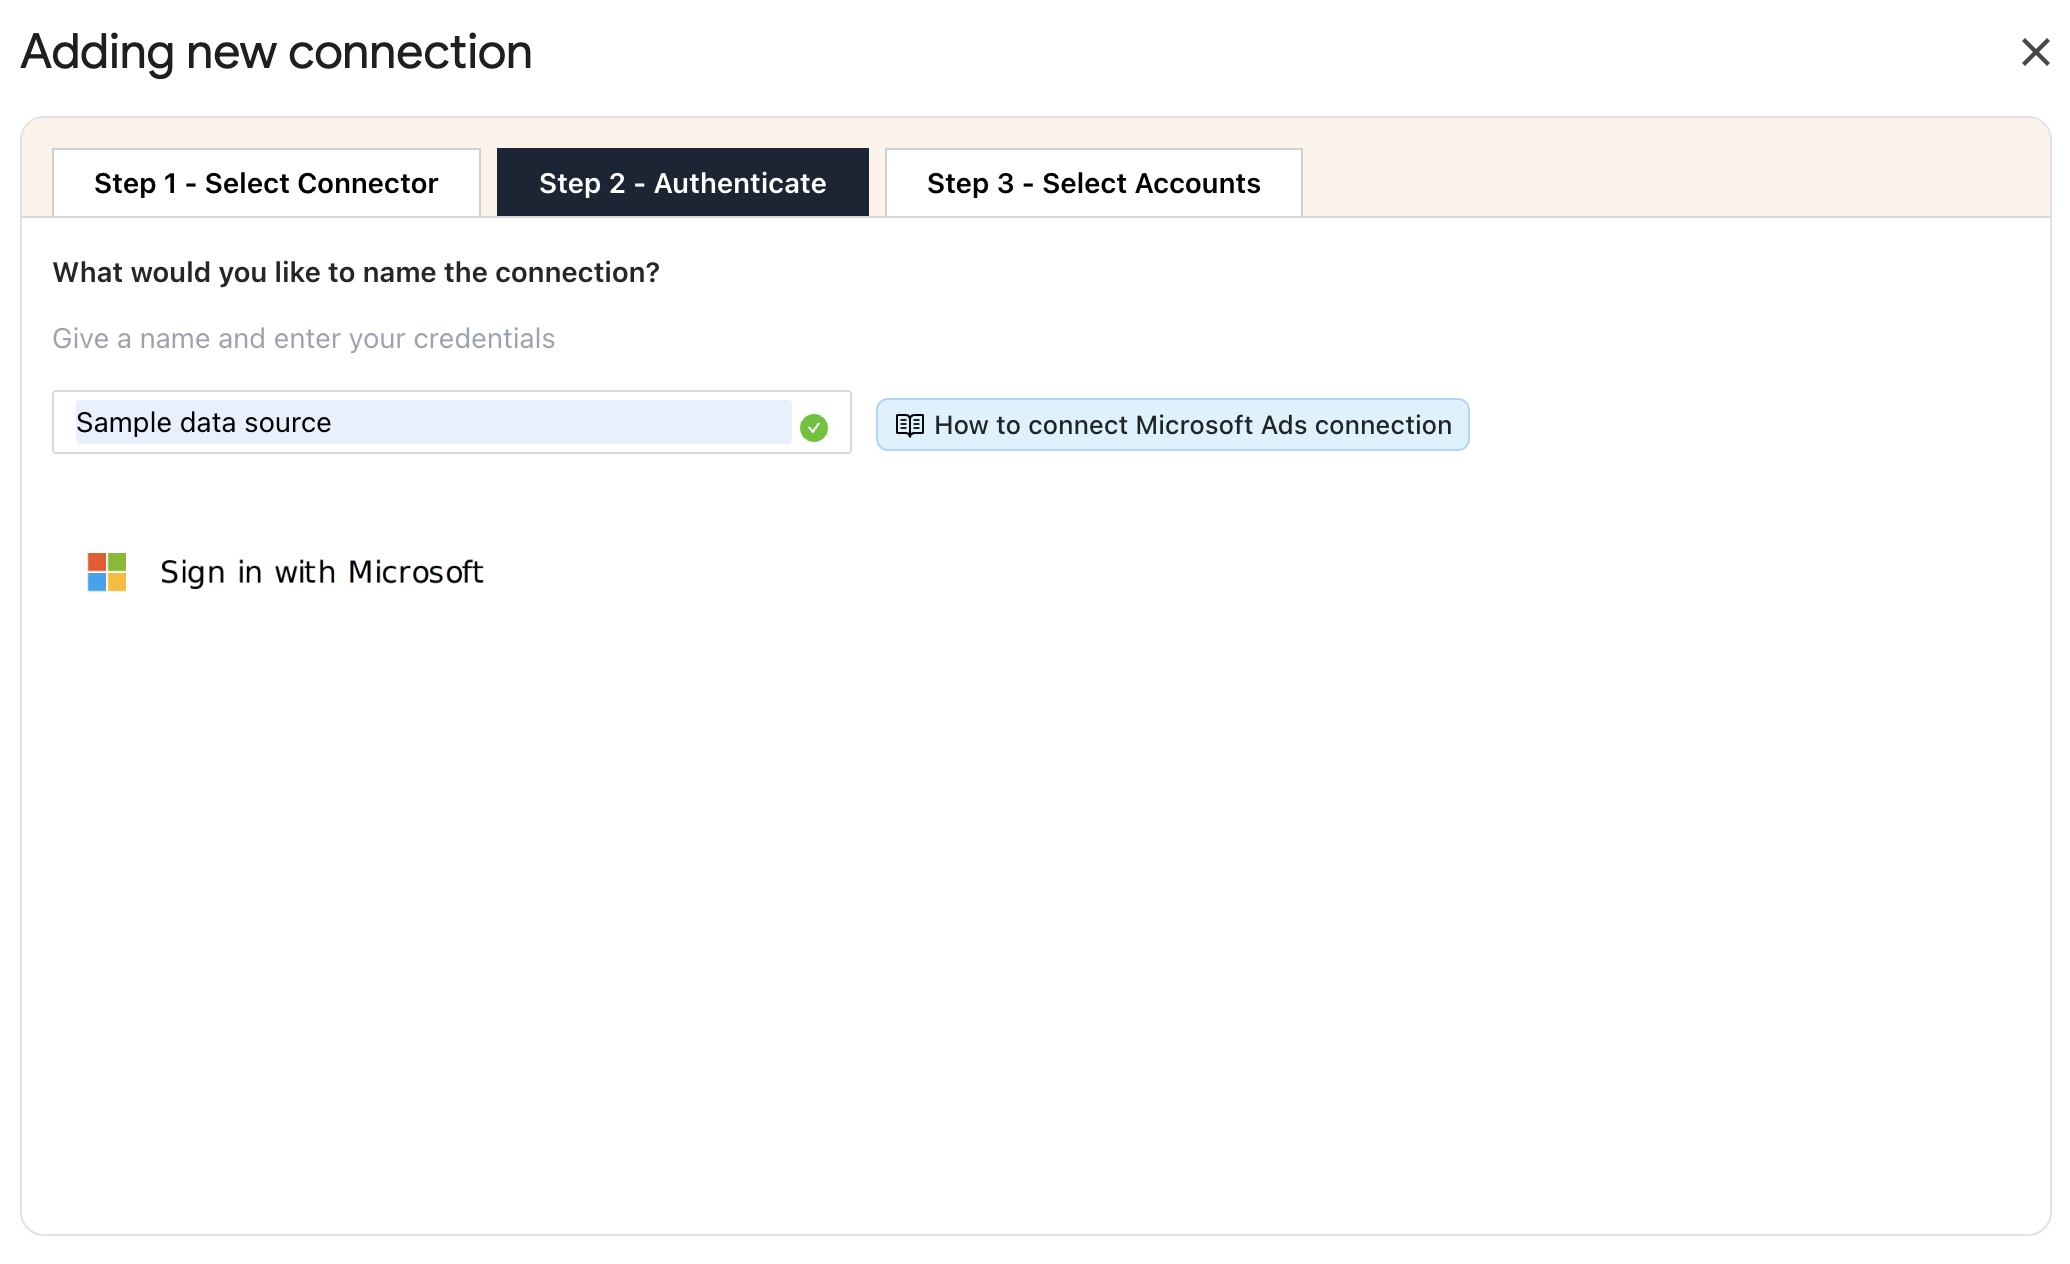
Step 2: The “Adding new connection” dialog box will appear. Here, you will perform three key steps to access your client’s Bing Ads accounts.
- Select the Microsoft (Bing) Ads Connector.
- Authenticate by providing your login credentials.
- Enable the respective accounts using TMR’s Bing Ads Connector.
Step 3: Once you have successfully authenticated, a screen will display your Account name, ID, Connection name, and Status, as shown below:
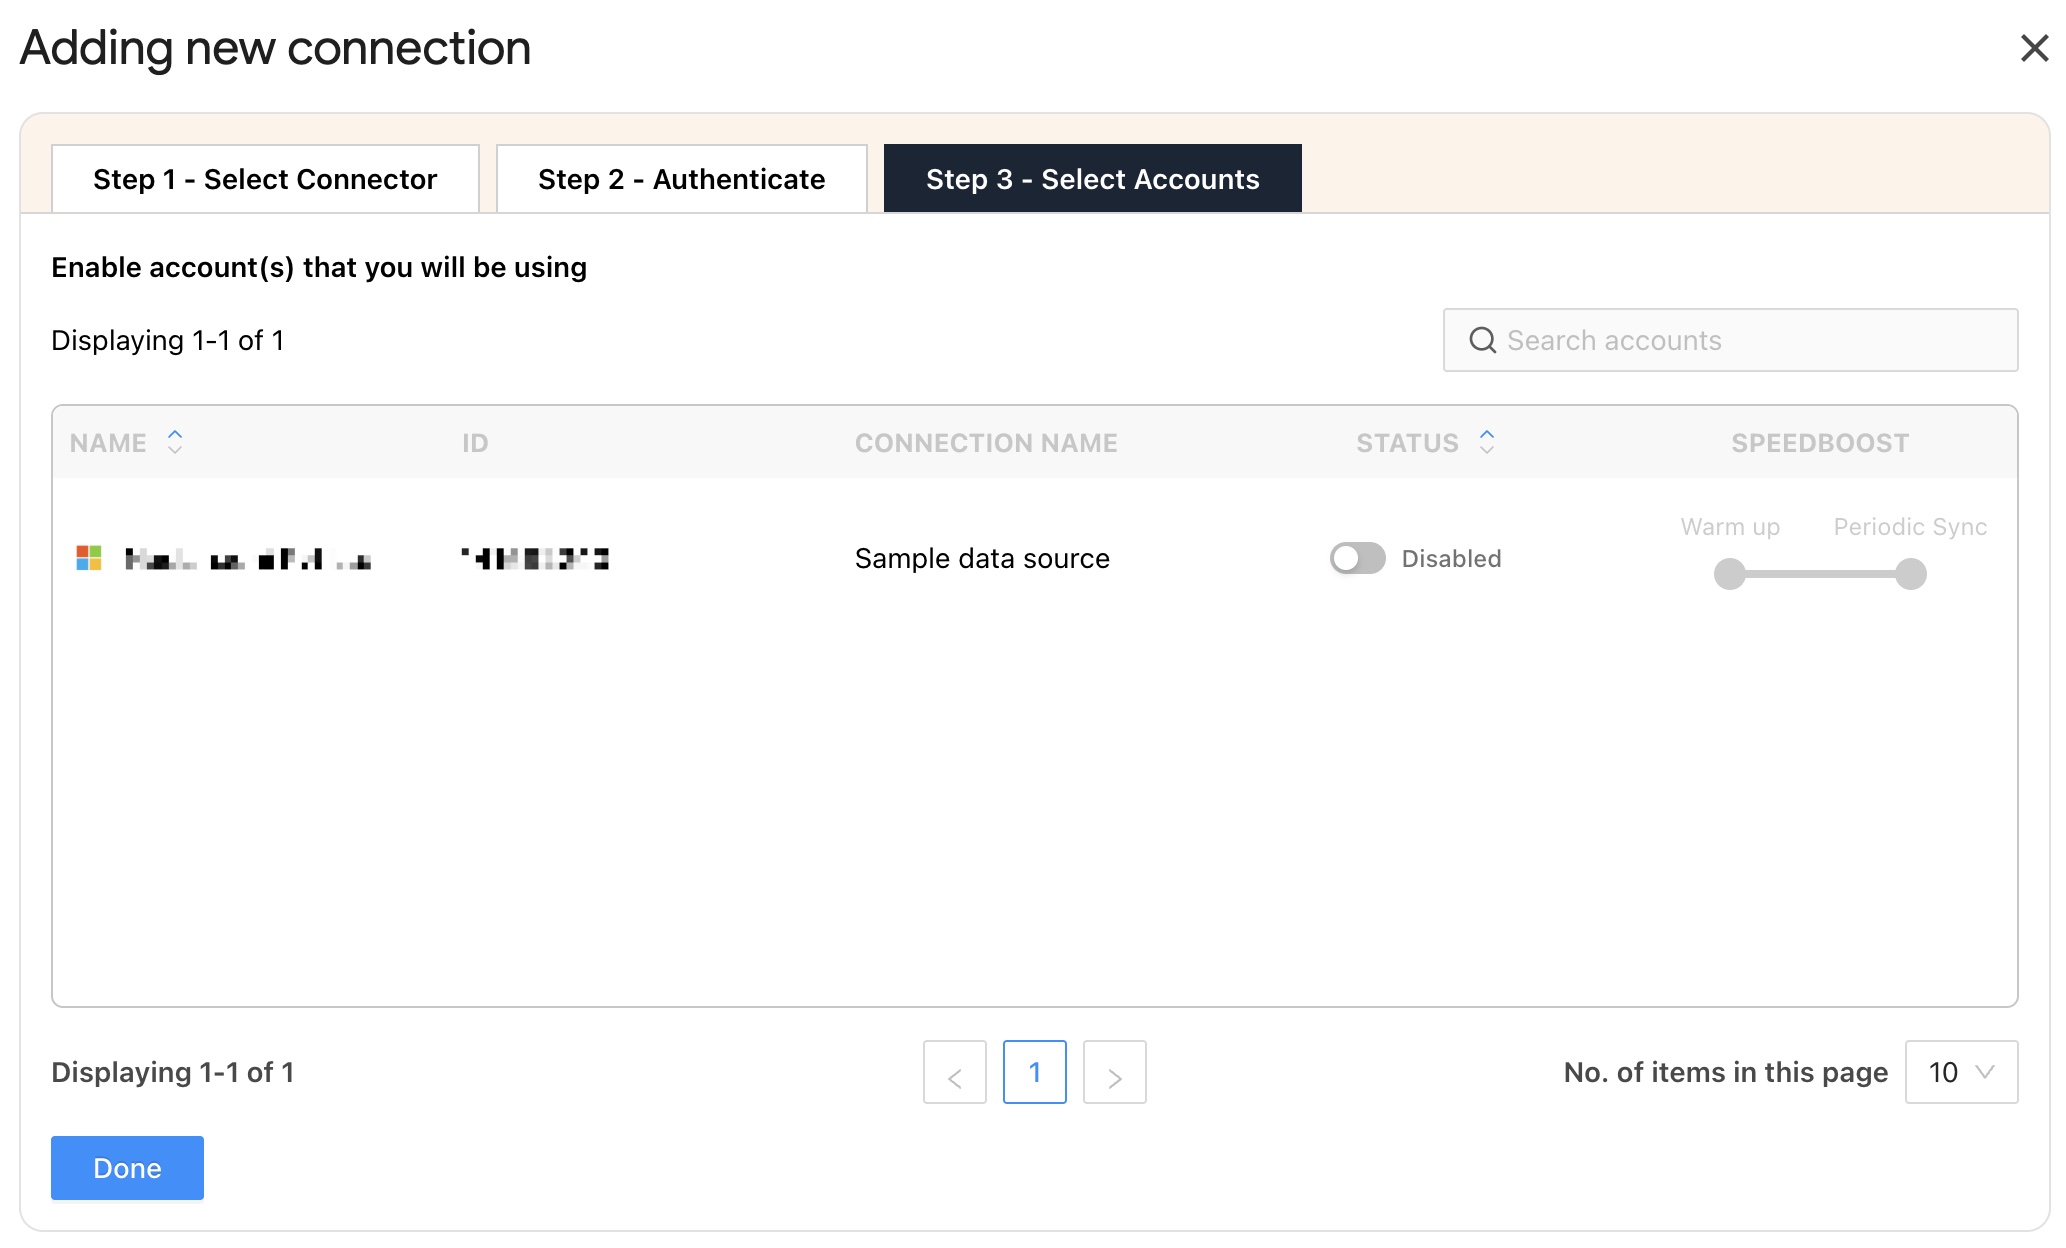
Step 4: Enable the toggle for the accounts you want to run queries. Please note that you cannot extract data from disabled accounts.
| After enabling the associated accounts, click “Refresh Connections” to ensure the connected accounts appear in the TMR sidebar. |
Now, you can extract Bing Ads KPIs in Google Sheets for actionable insights.
Step 3: Fetching Microsoft (Bing) Ads data to Google Sheets
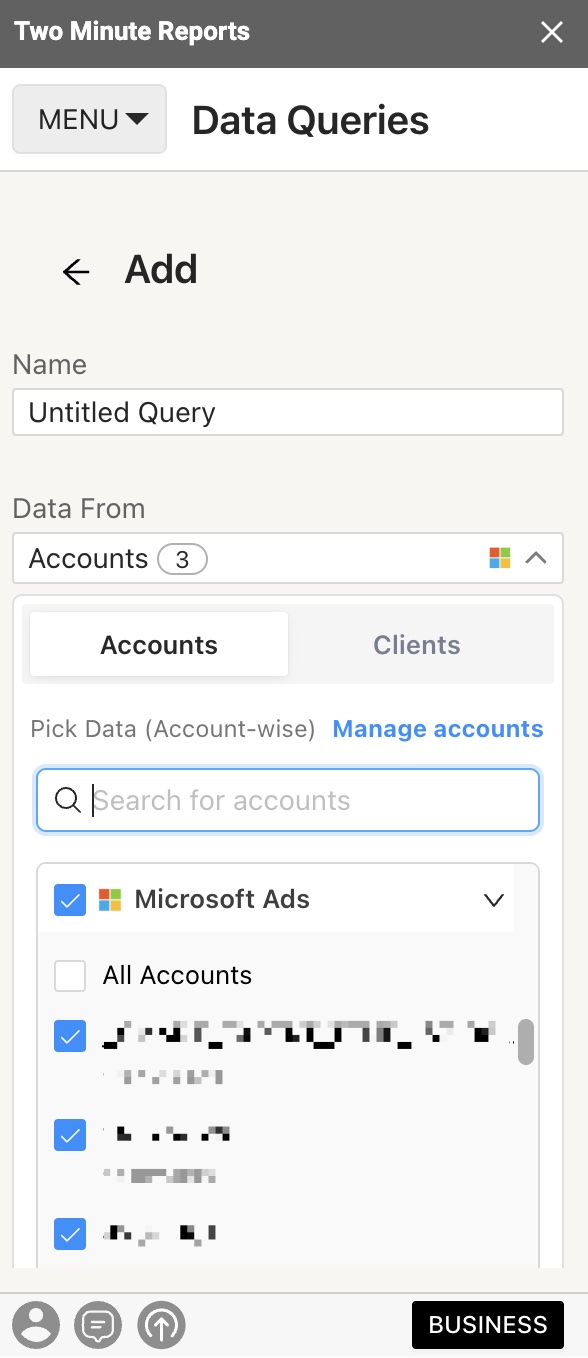
To pull performance data from Bing Ads, create a new query by navigating to the Data Queries section.
Click Add and choose the respective Bing Ads accounts you want to analyze for campaign performance. By selecting one or more accounts to analyze and gather comprehensive insights, you can manage multiple clients’ accounts under one roof.
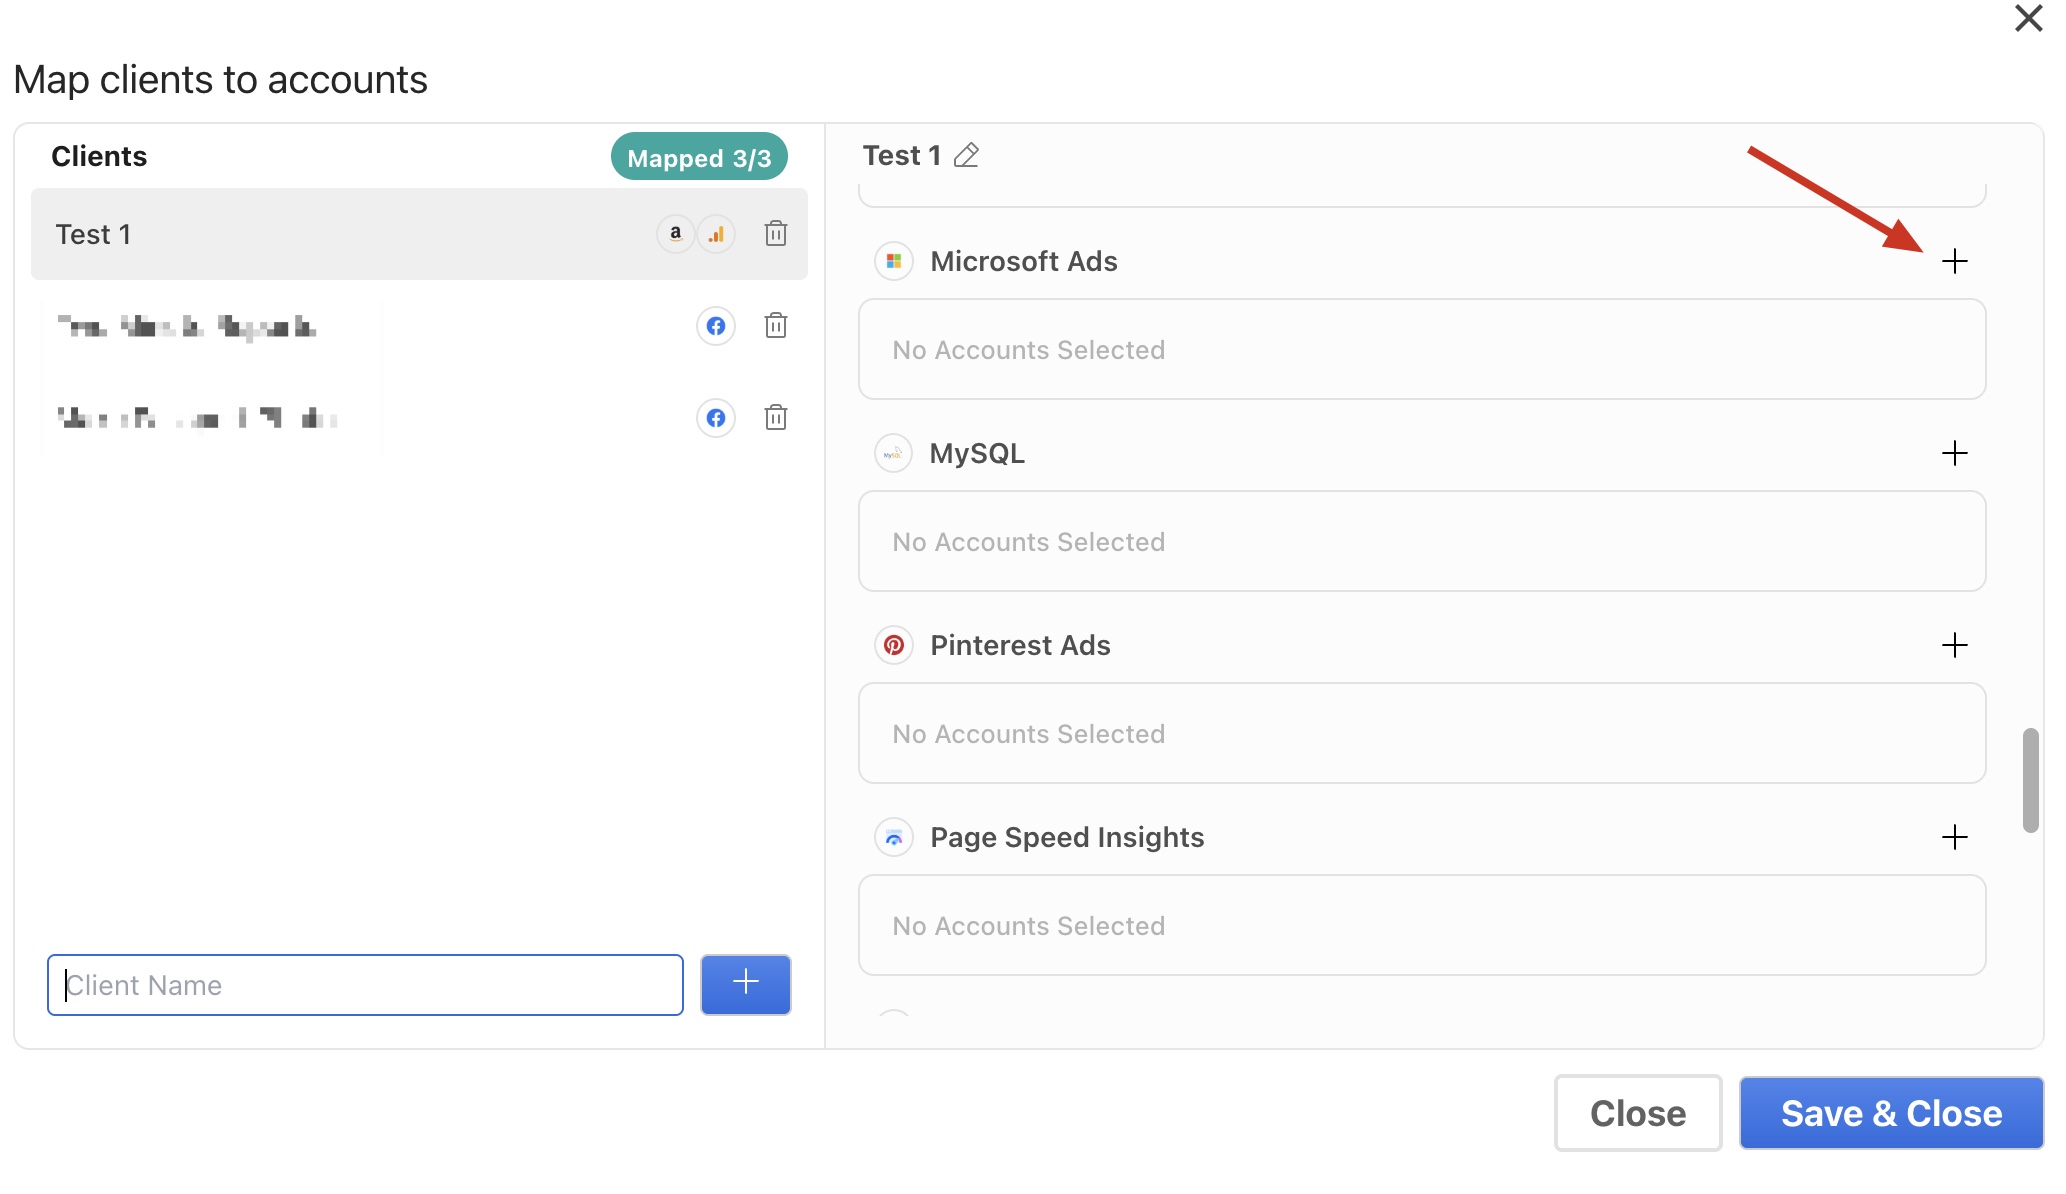
Alternatively, add your clients and map their corresponding Bing Ads accounts using the Clients section. Click “Manage Clients” and map the necessary account details. Once complete, click “Save & Close” to save your clients’ information for future use.
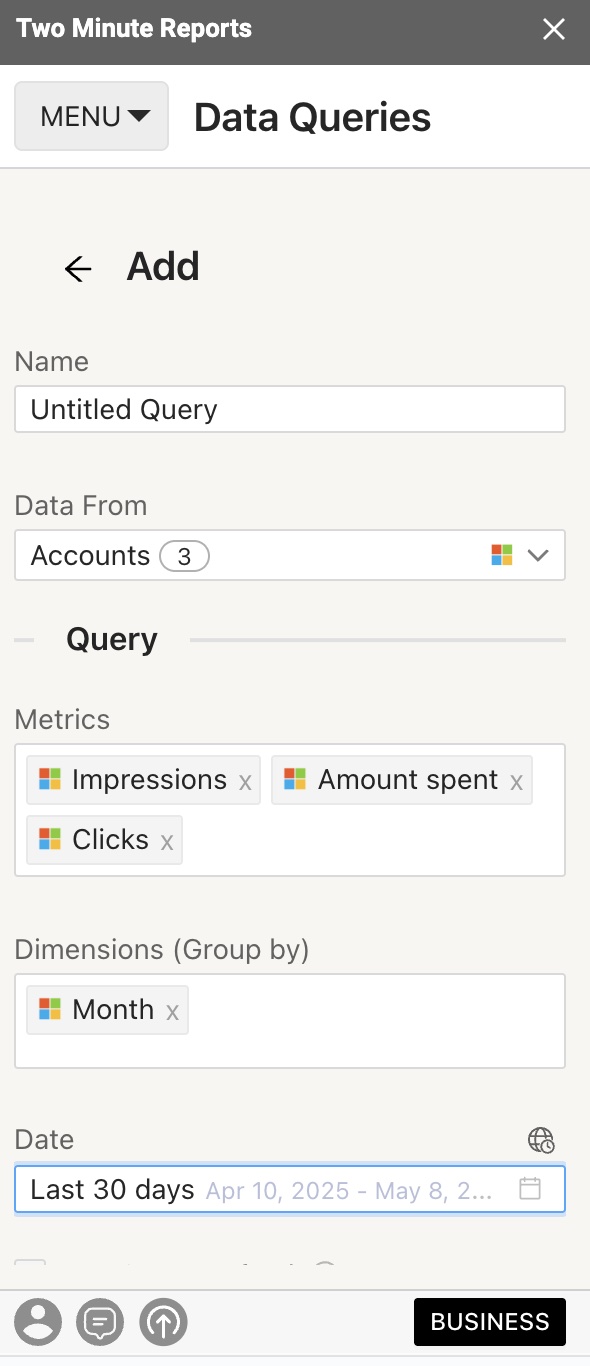
After this, add the Bing Ads metrics and dimensions you want to analyze and select the date range for your campaign performance analysis.
Customize your data reporting by selecting the relevant fields and deciding whether to sort data in ascending or descending order. You can also apply custom filters to display only the necessary information.
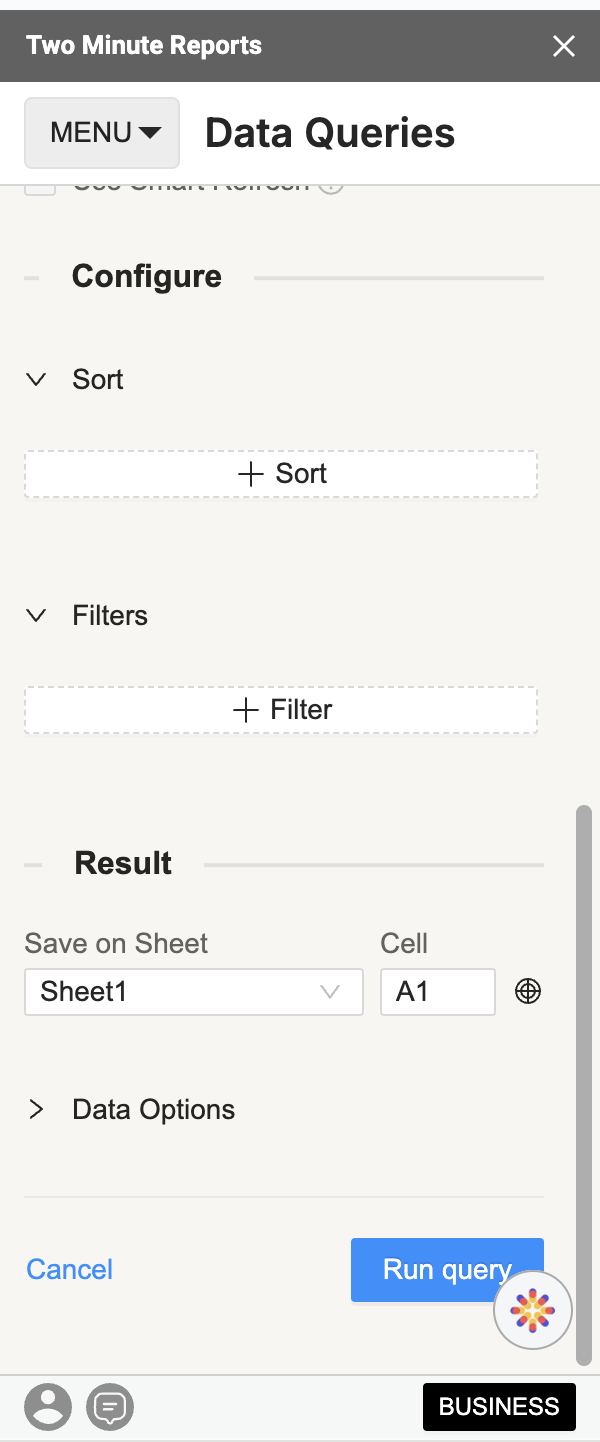
After going through these steps, click Run Query to visualize the output.
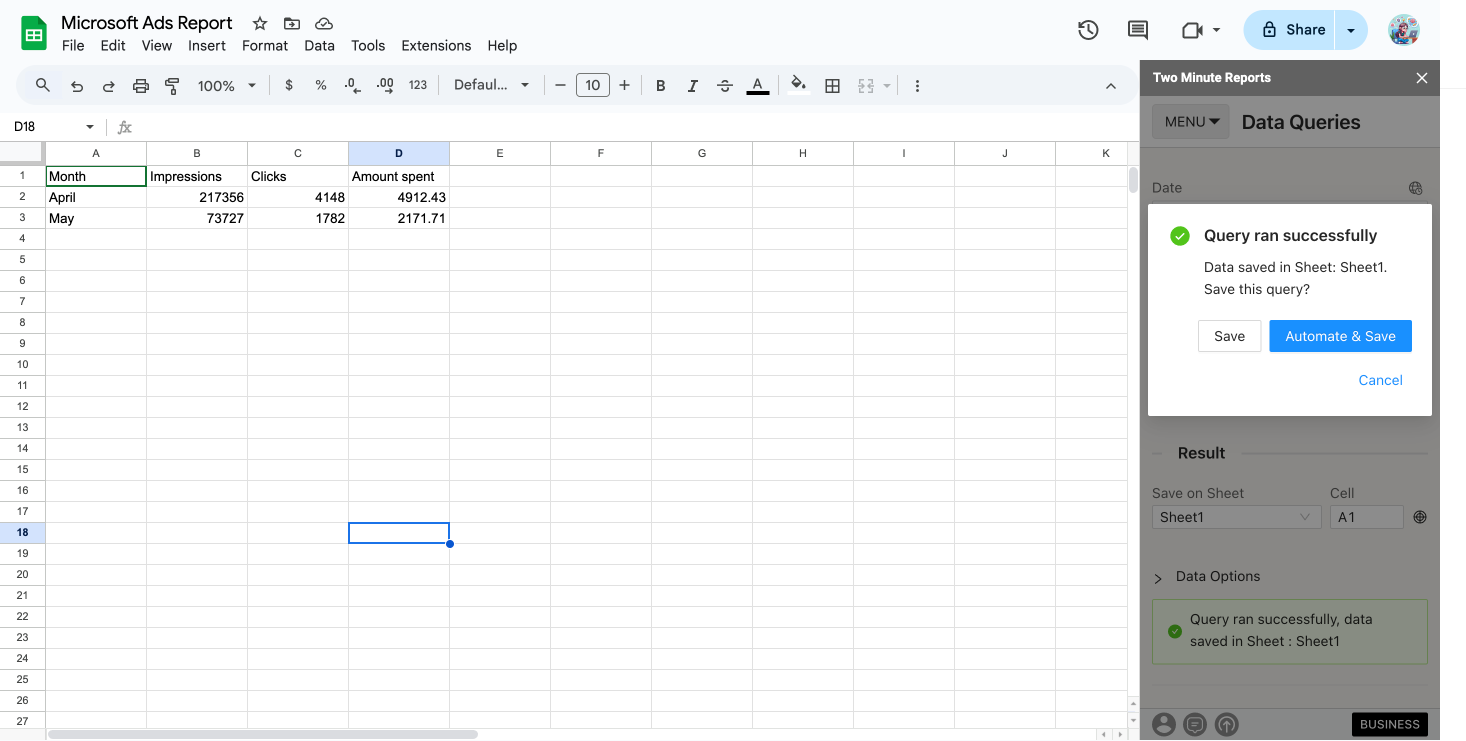
You can now use various Google Sheets features, such as pivot tables and the VLOOKUP() function, to extract critical insights and create charts to visualize your Bing Ads performance.
| Pro TMR Tip: Run all your queries directly from the Extensions menu on your Google Sheets. Go to Extensions > Two Minute Reports > choose your desired quick action. |
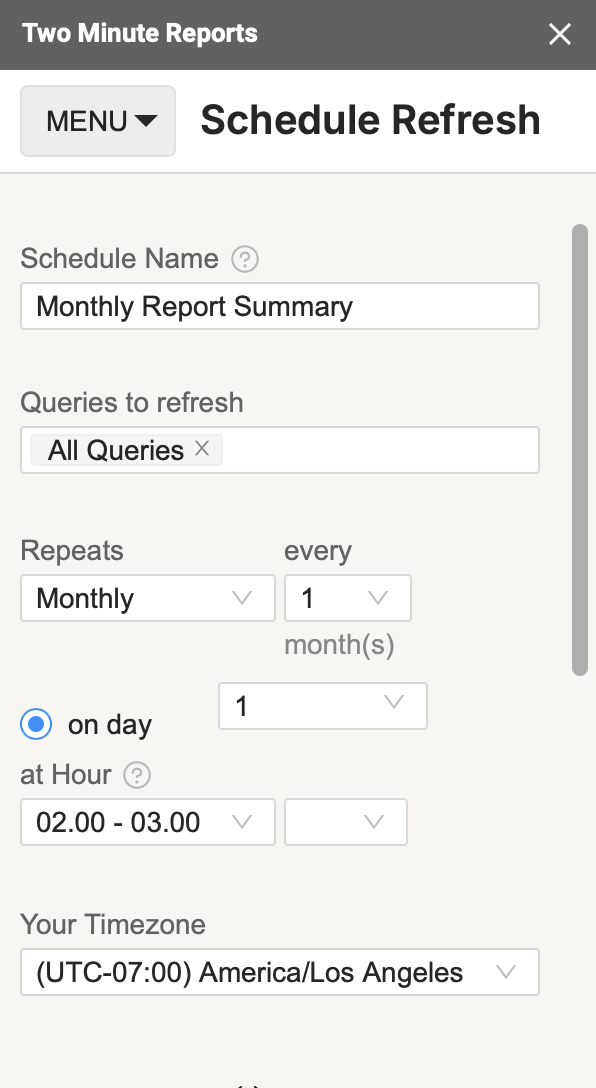
Step 4: (Optional) Get automatic data updates via Schedule Refresh
After creating a report in Google Sheets, you can schedule automatic updates to ensure your data remains updated. This feature is convenient for emailing reports or refreshing your spreadsheets with live data, allowing them to function as dashboards.
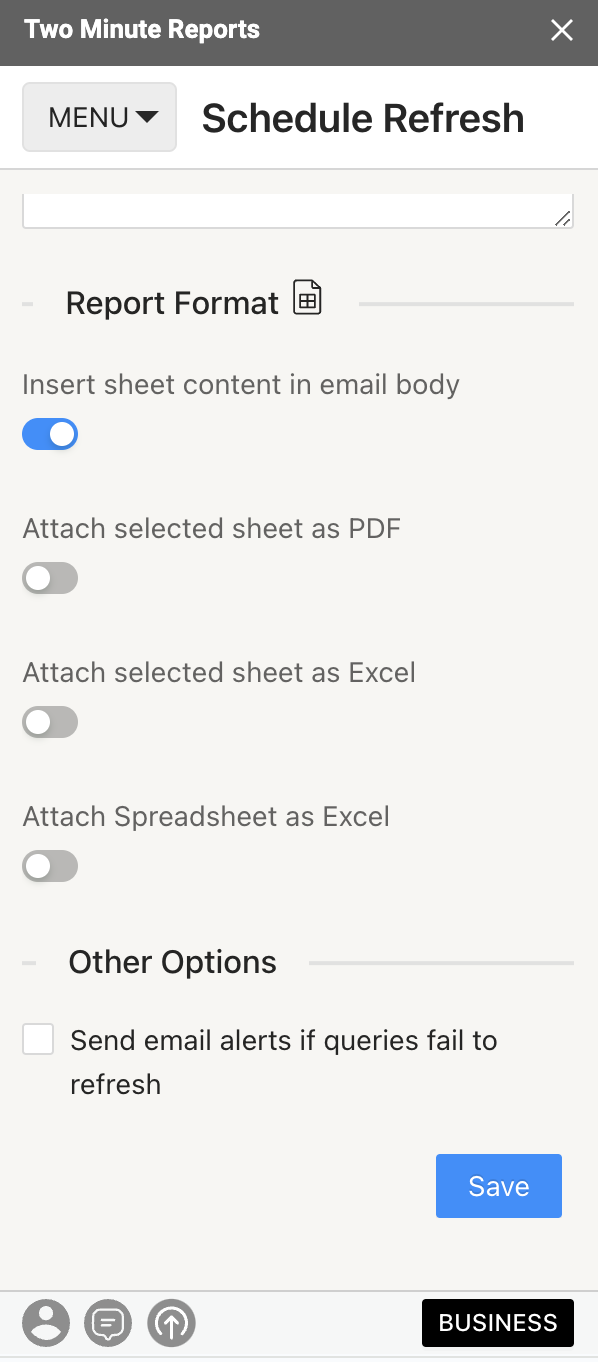
Enter the recipient’s email address in the email section and save the new schedule.
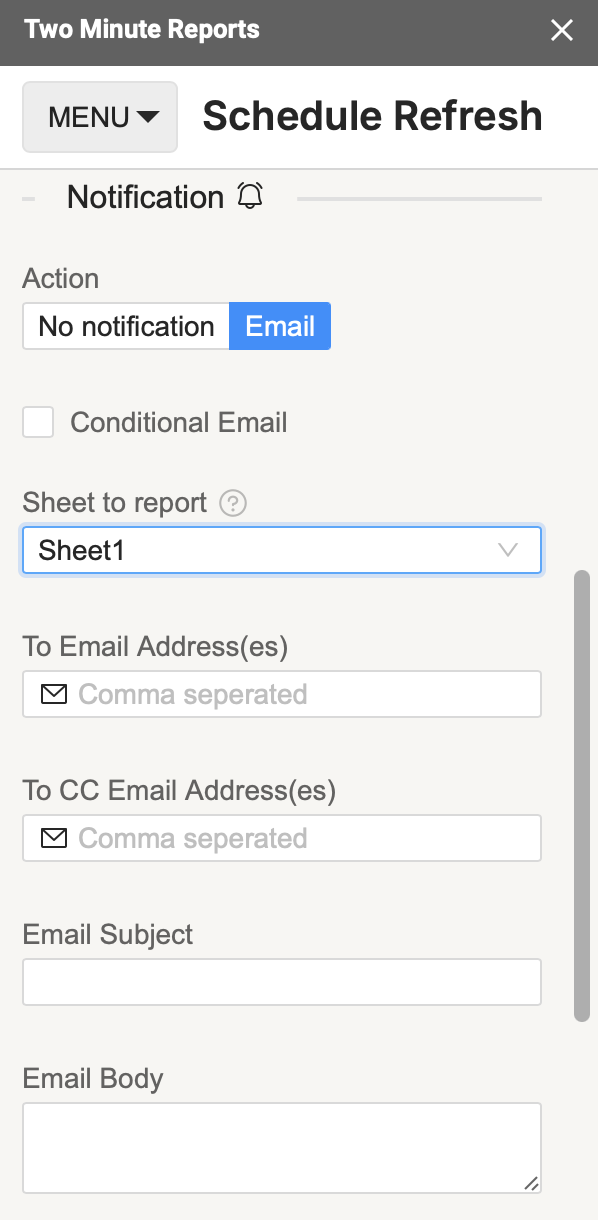
You can also choose the reporting format, including inserting the selected sheet content in the email body, attaching the sheet chosen as a PDF or Excel file, or attaching the spreadsheet as an Excel document.
Two Minute Reports’ Schedule Refresh feature has further capabilities. Continue reading about this feature: “How to Refresh Data Automatically in Google Sheets.”
We hope you found this guide helpful. If you have any questions, please contact our support team at [email protected].