Connectors
Instagram Insights
Connect Instagram Insights to Google Sheets or Looker Studio

Two Minute Reports' Instagram Insights connector lets you access and analyze your data directly in Google Sheets or Looker Studio. Build custom reports, monitor key metrics, and make data-driven decisions - all without writing any code.
What you can report on
- Follower growth and audience demographics
- Post reach, impressions, likes, and comments
- Story views, exits, and tap-through rates
- Reel plays and engagement metrics
- Profile visits and website link clicks
Prerequisites
- An Instagram Business or Creator account
- The Instagram account must be connected to a Facebook Page
- At least Analyst access on the linked Facebook Page
How to create a connection
- Go to https://hub.twominutereports.com/connections
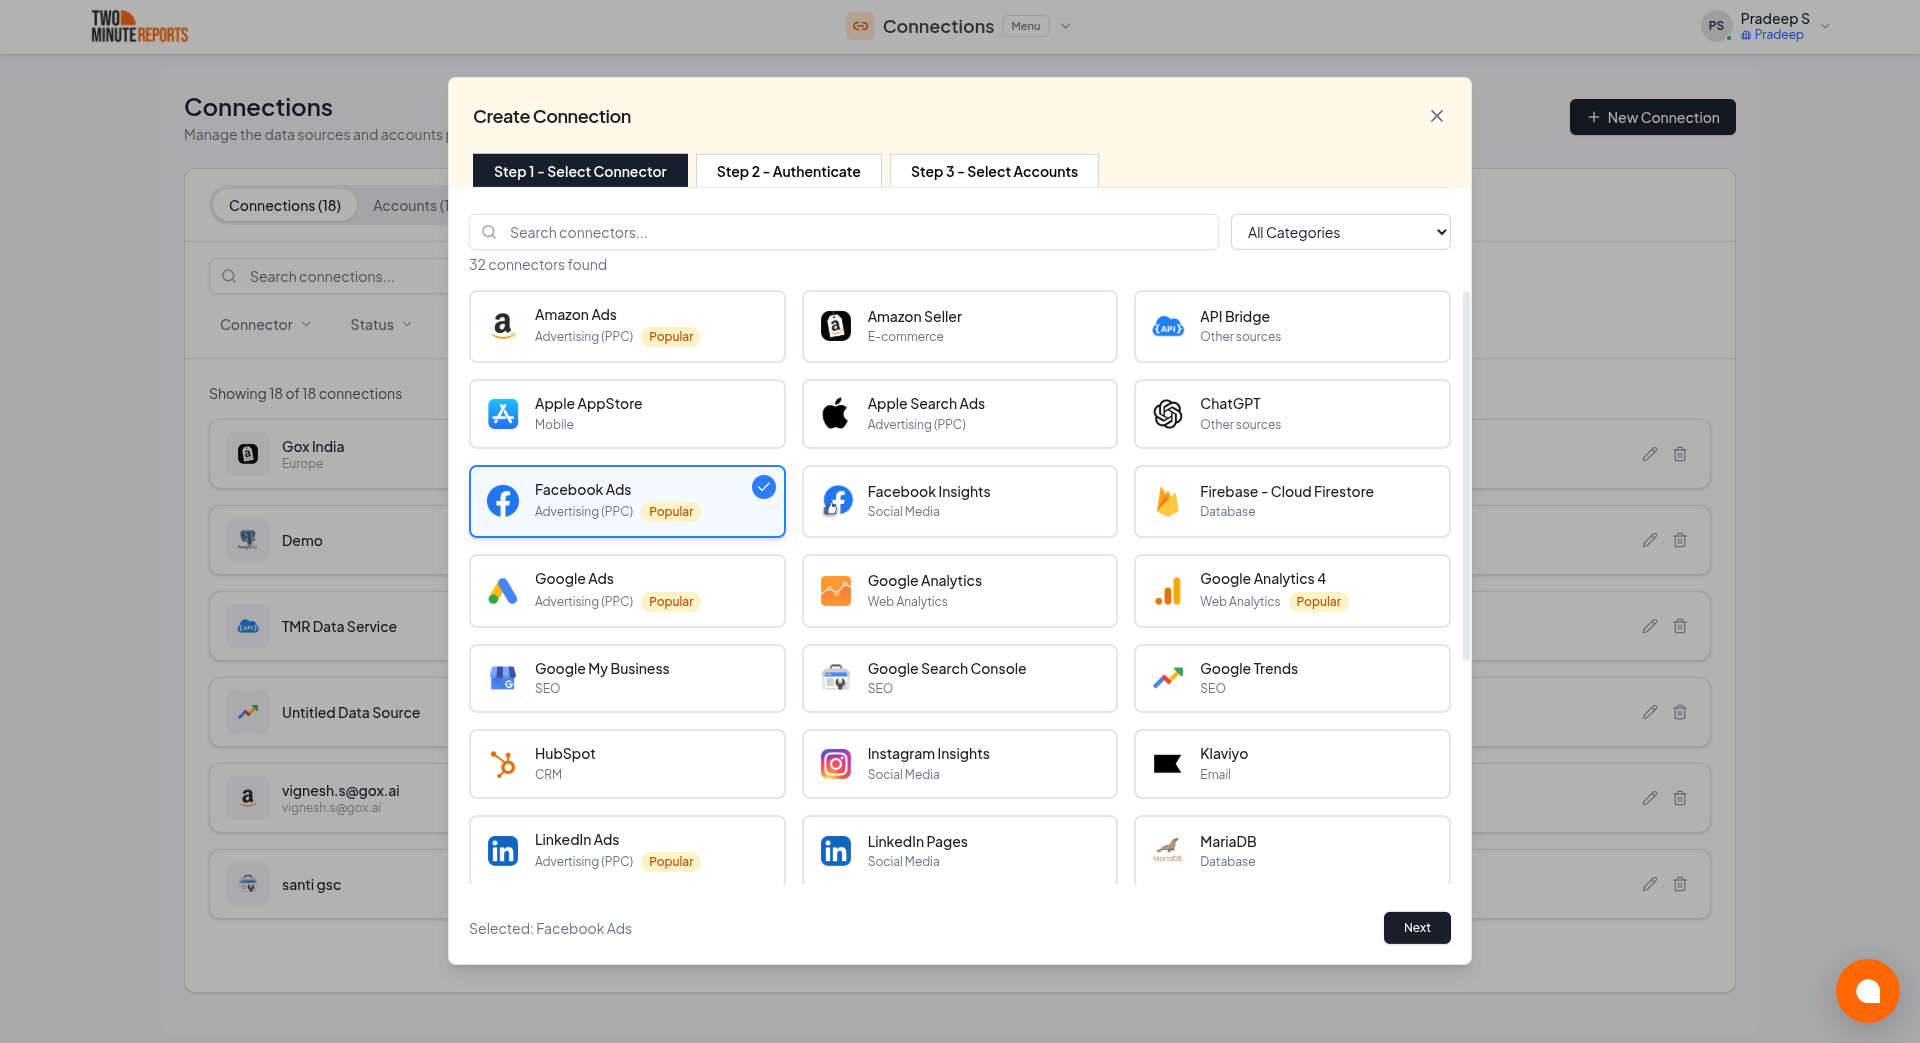
- Click New Connection to create a connection
- Select Instagram Insights from the list of available connectors
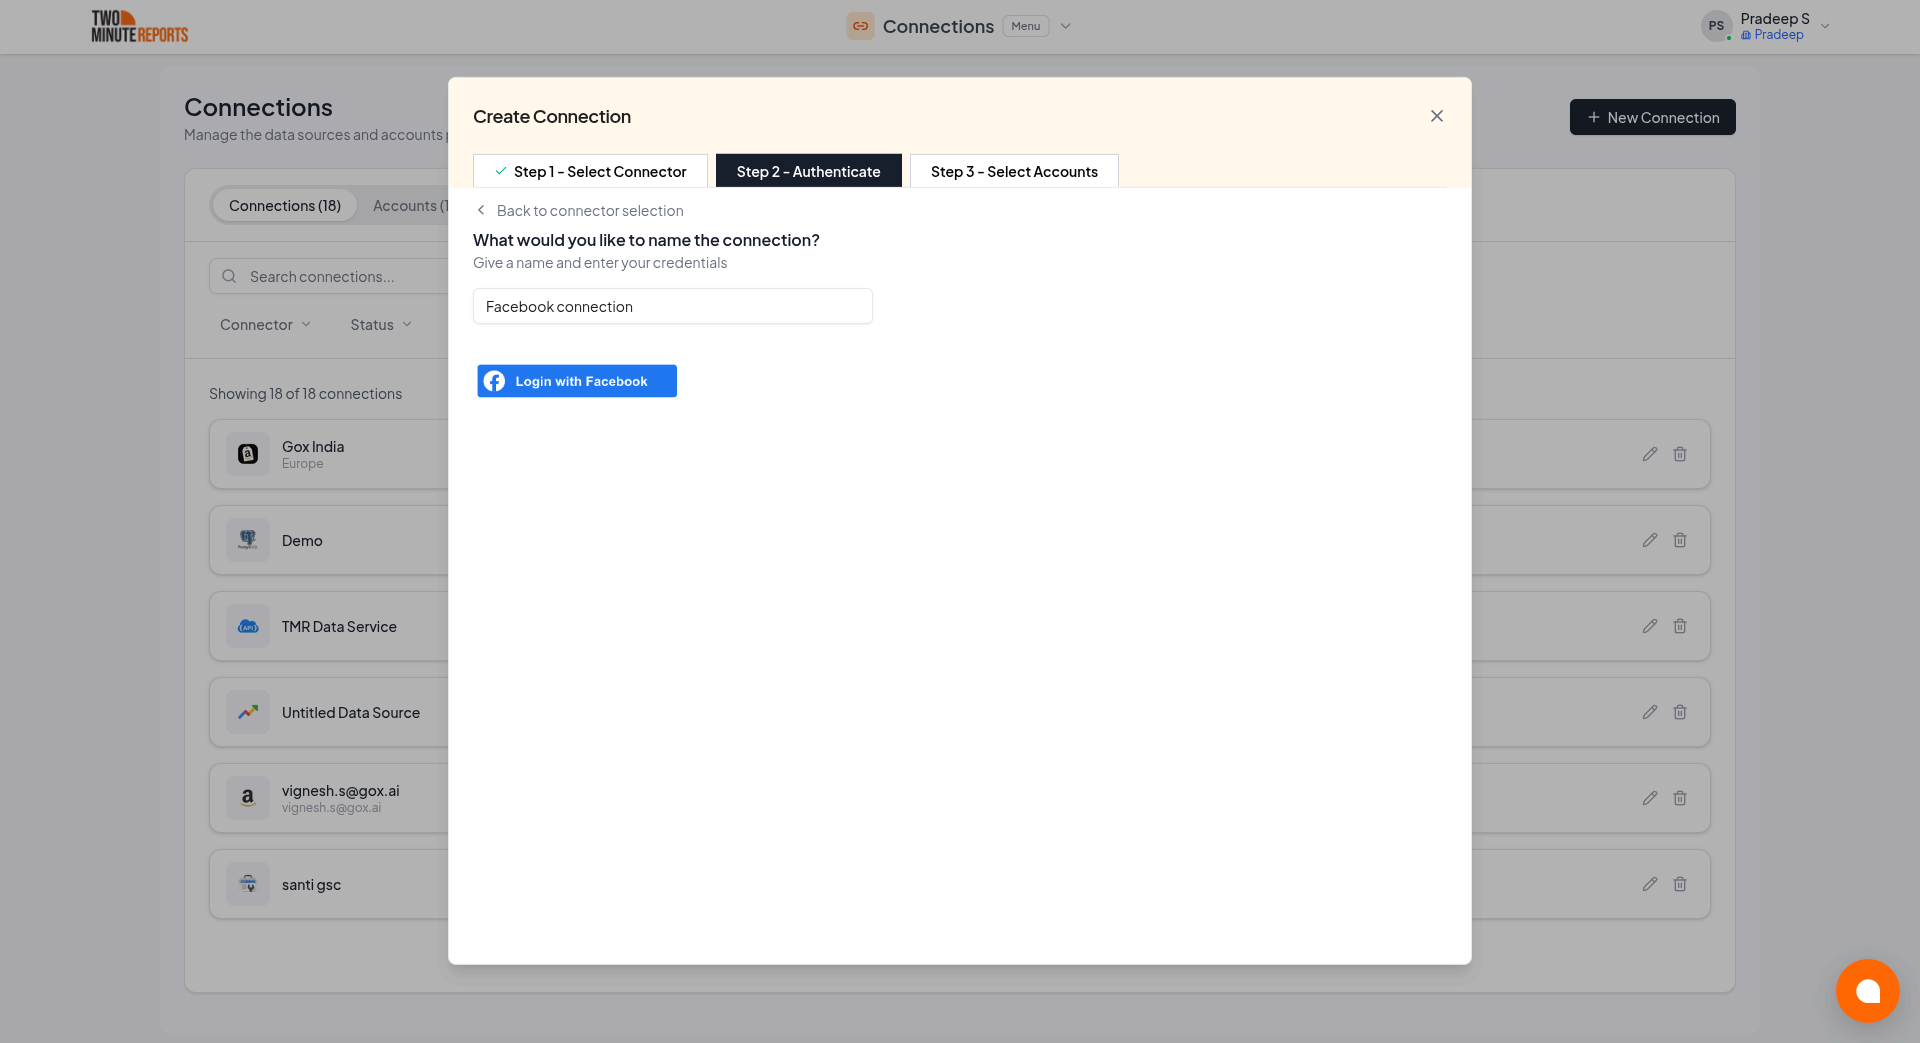
- Name the connection and authorize with your account credentials
After creating a connection:
- Enable the accounts you want to use from the available options
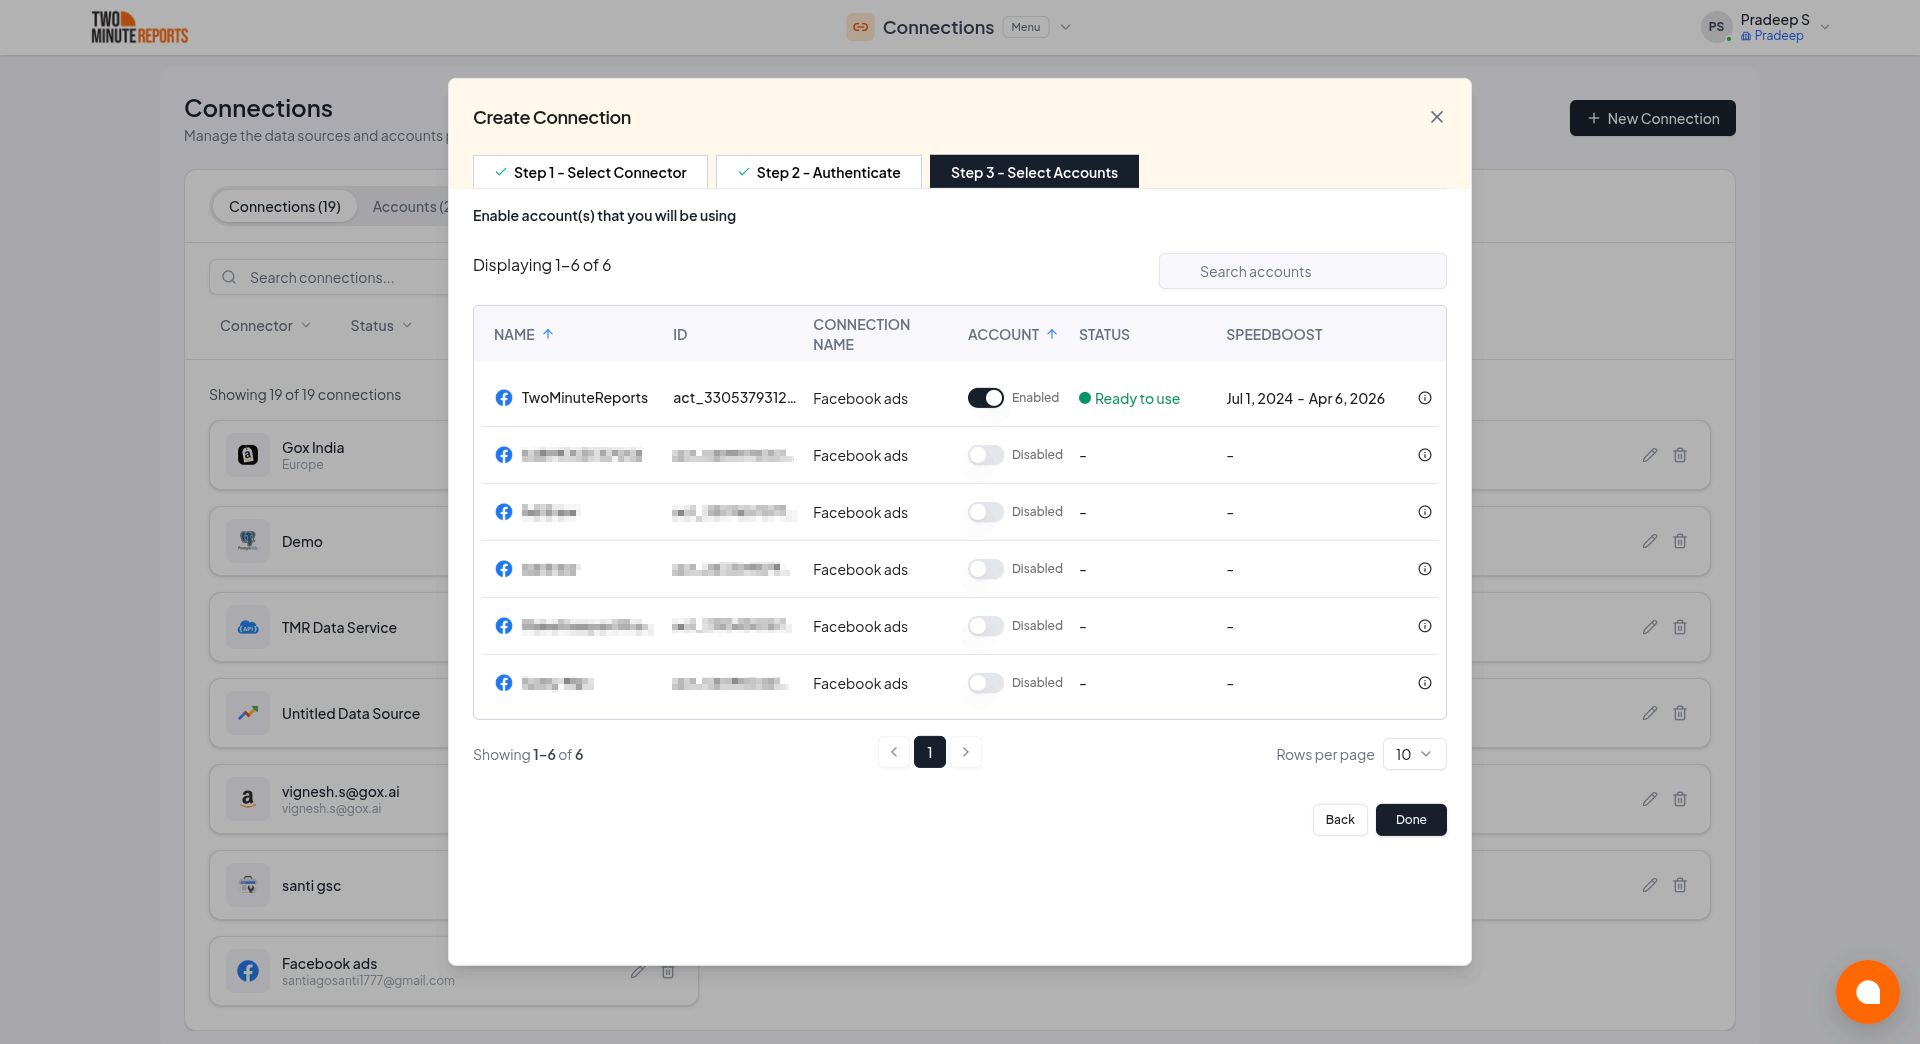
Important: Only enabled accounts can fetch data and count toward your plan usage. You can enable or disable accounts at any time in the hub to manage your plan usage efficiently.
How to get Instagram Insights data into your reports
To pull Instagram Insights data into Google Sheets:
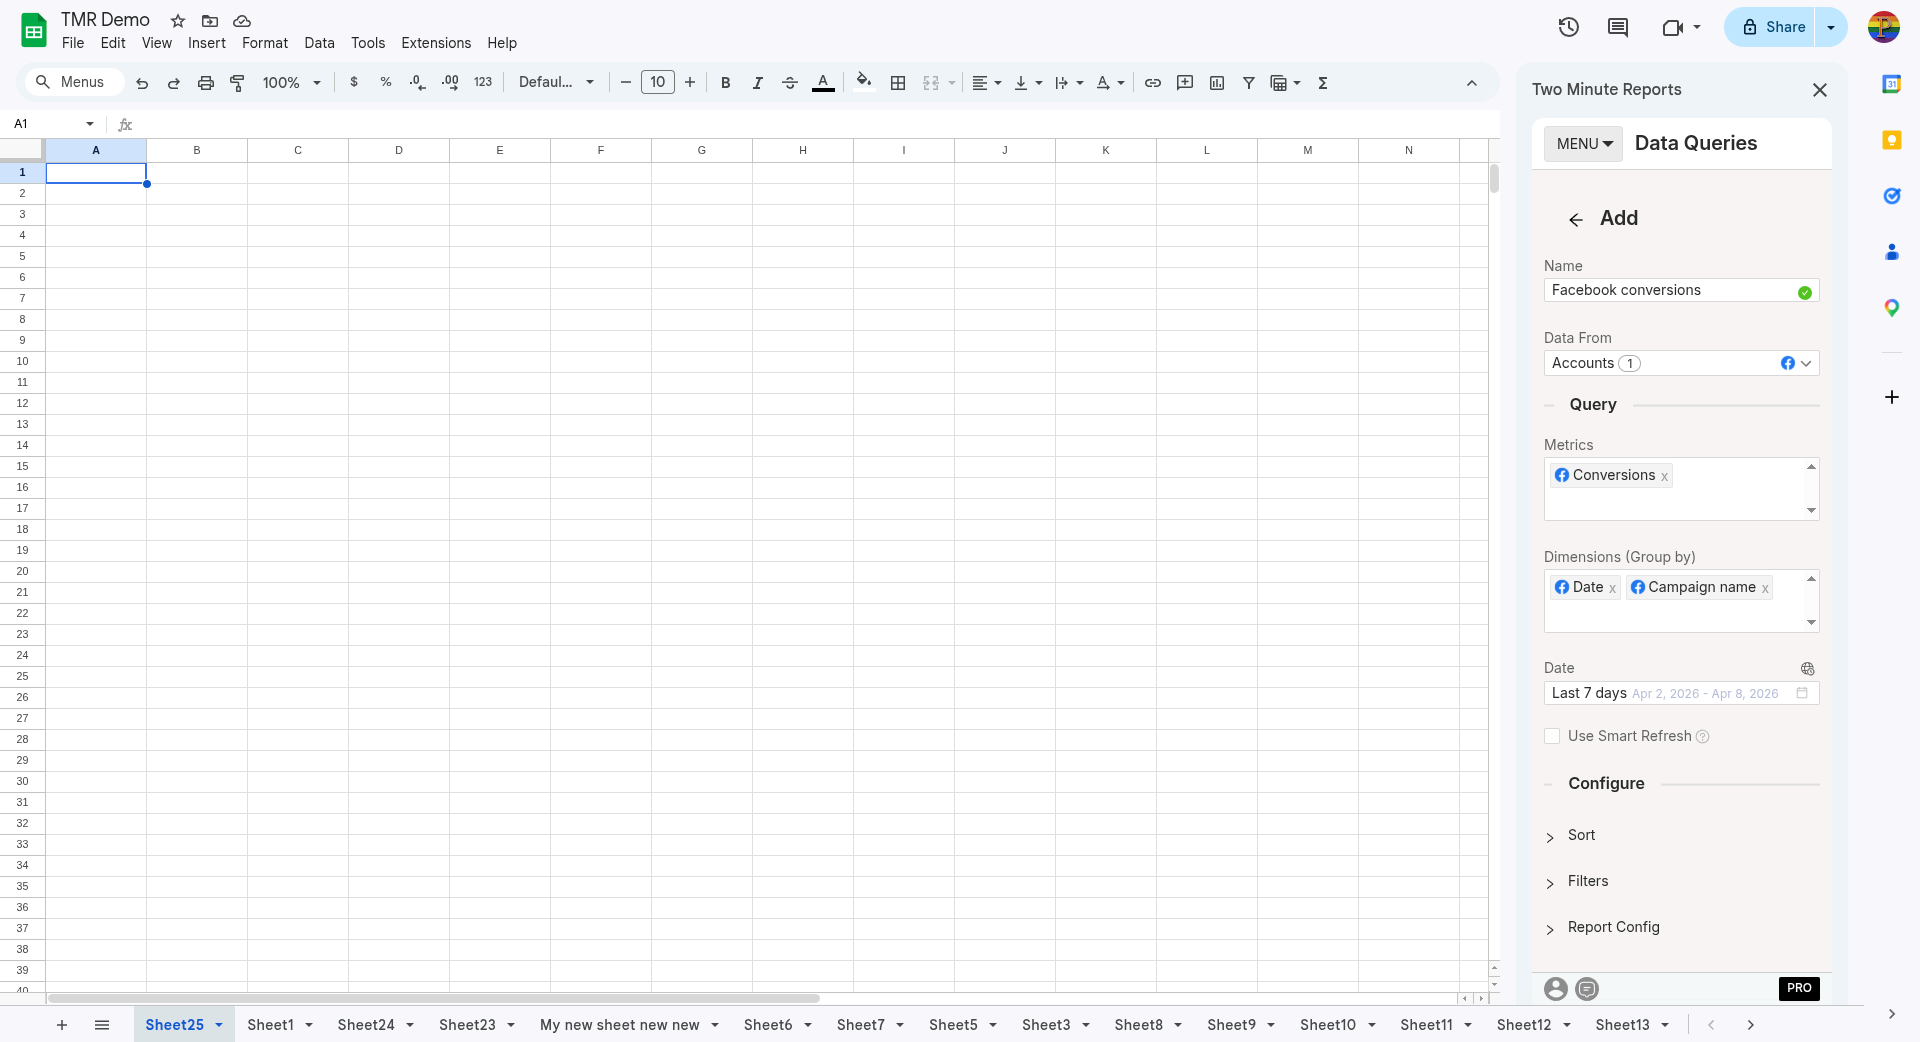
- In the TMR sidebar, go to Data Queries and click Add
- Select the accounts you want to analyze (can select multiple)
- Choose your metrics and dimensions from available options
- Select the date range for your analysis
- Configure sorting and filtering options as needed
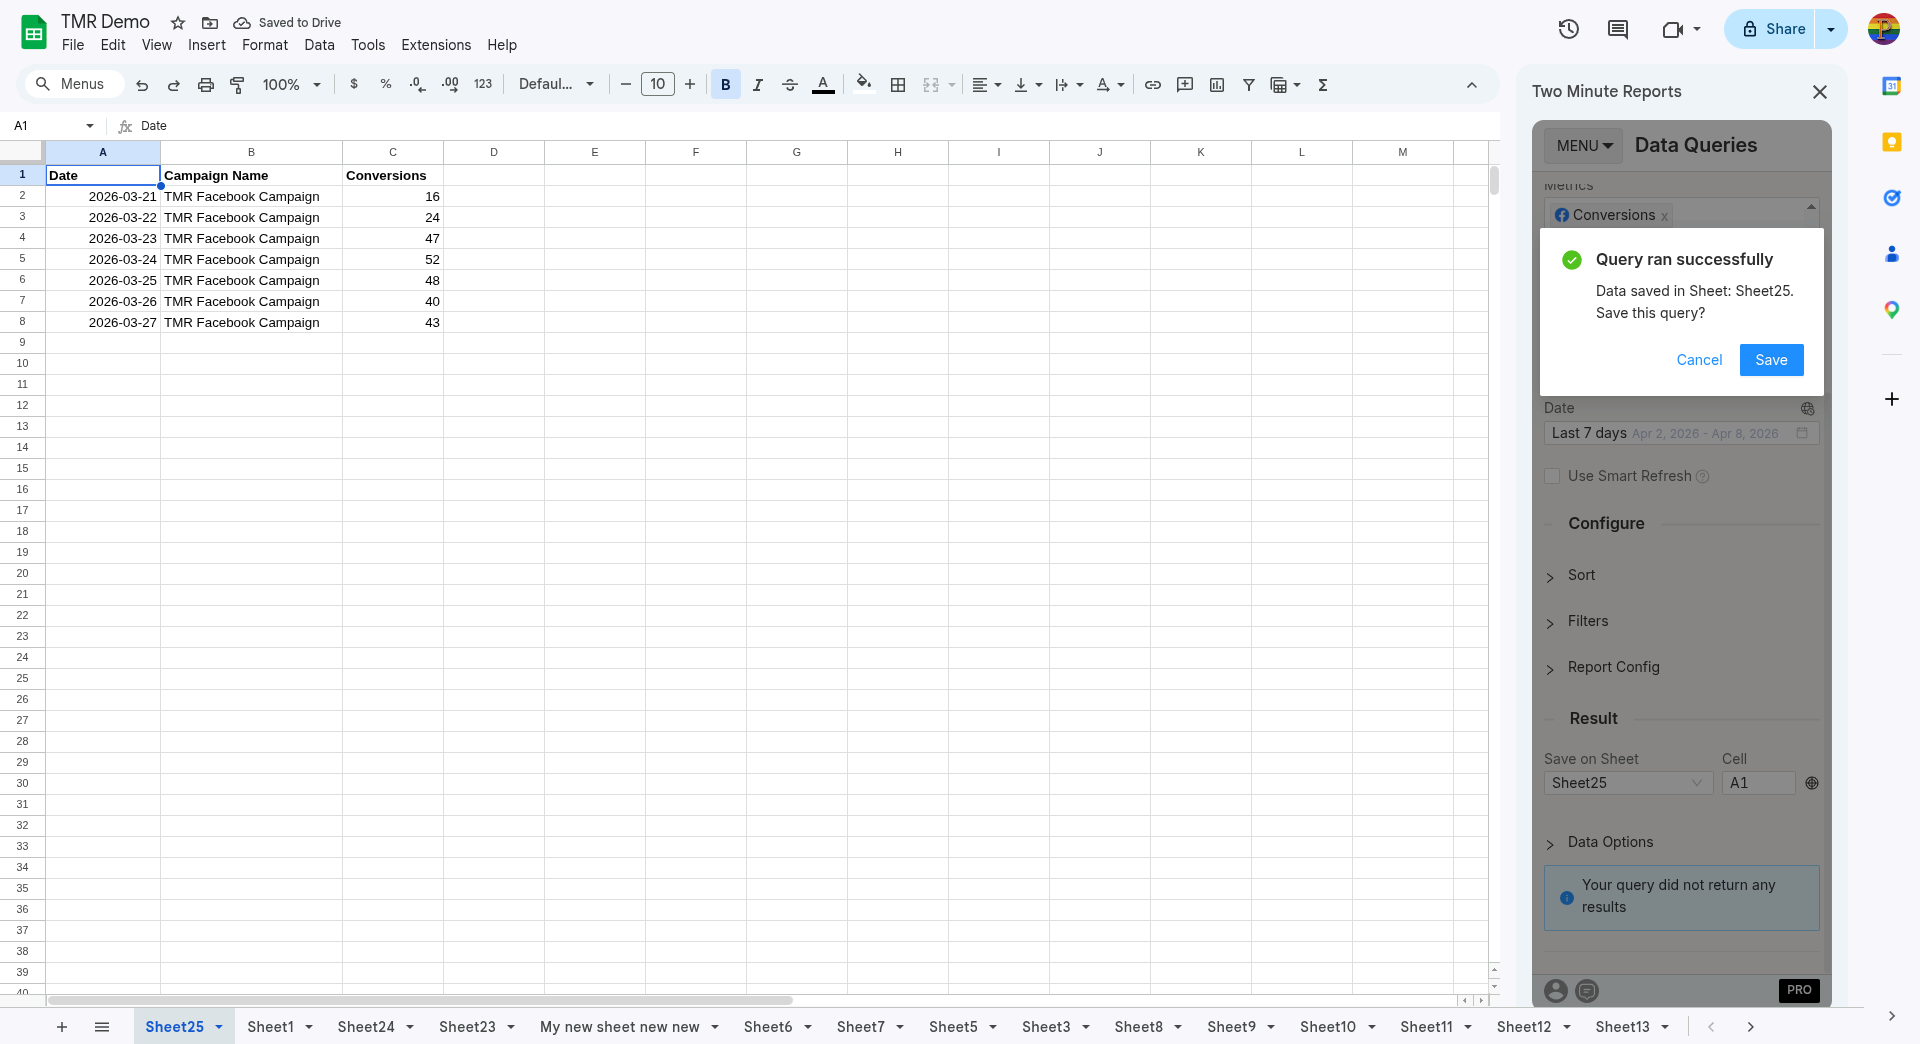
- Click Run Query to populate the data into Google Sheets
To pull Instagram Insights data into Looker Studio:
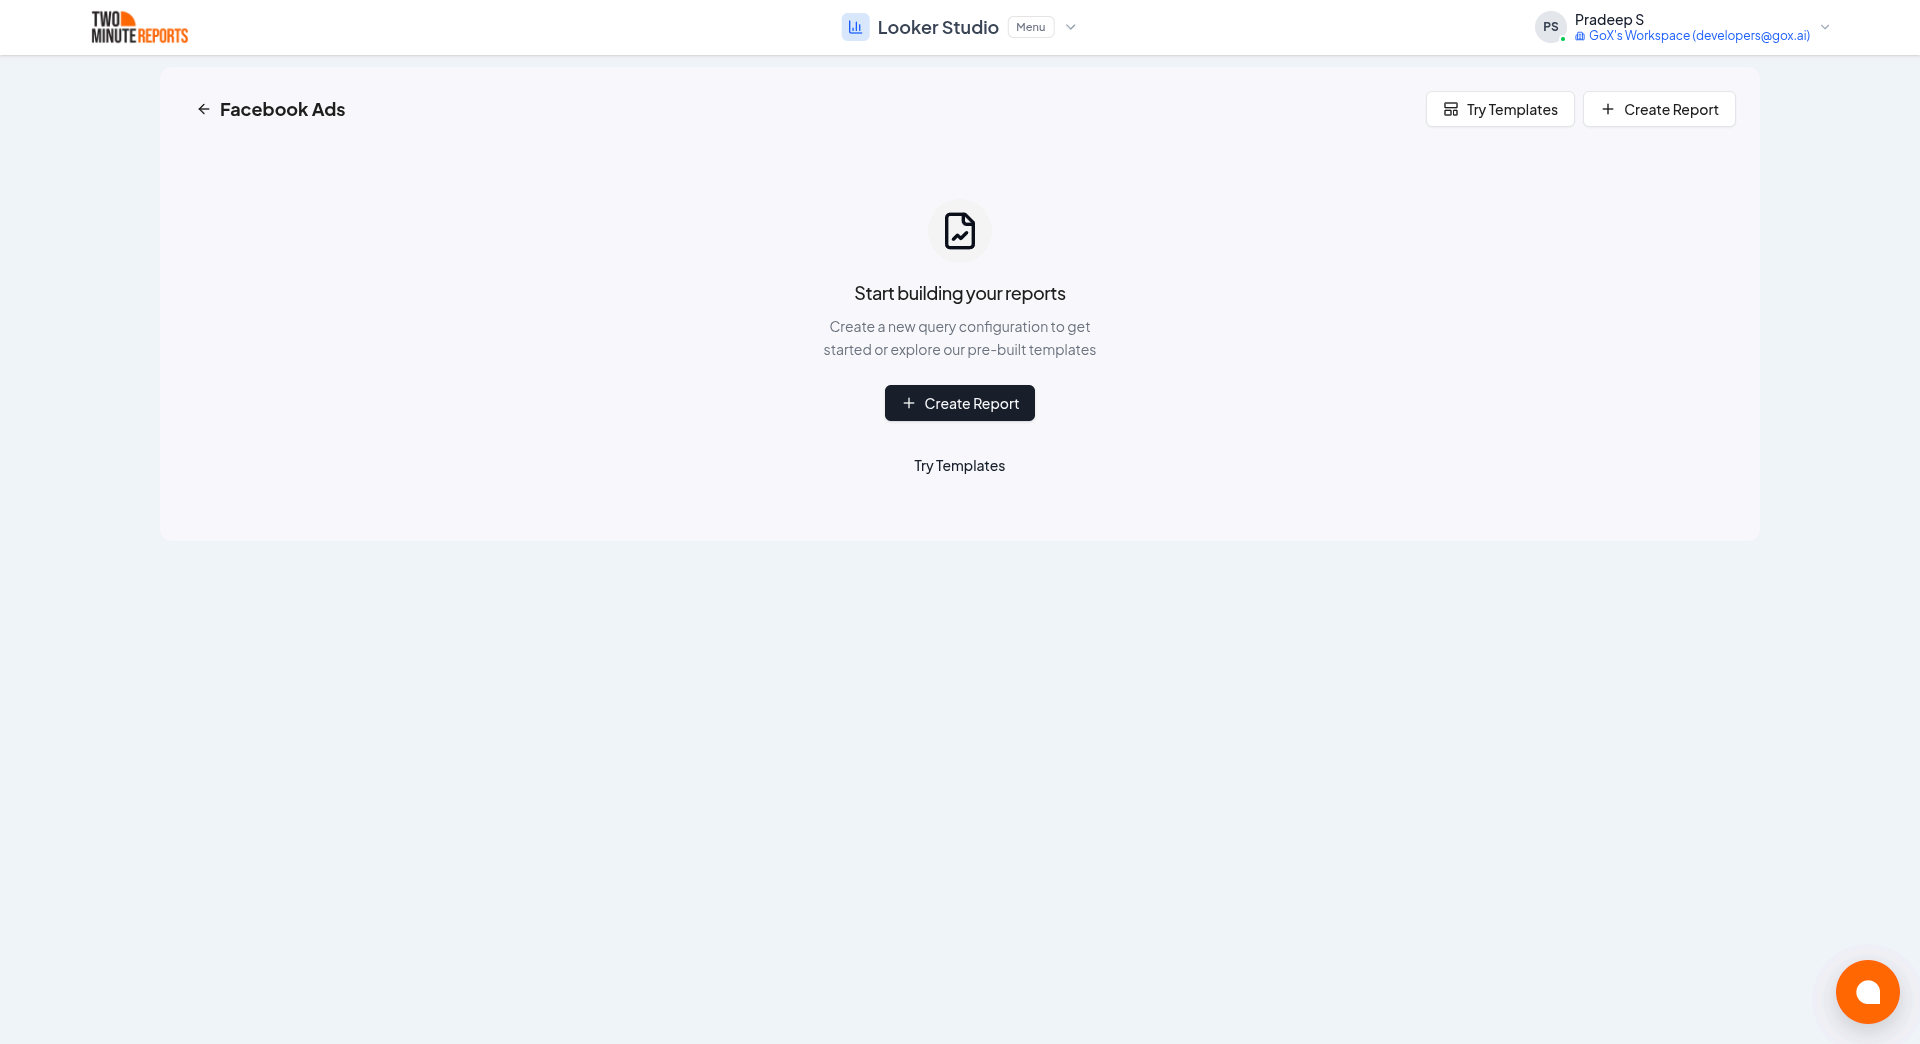
- Click Open in Looker Studio, then click + Create Report.
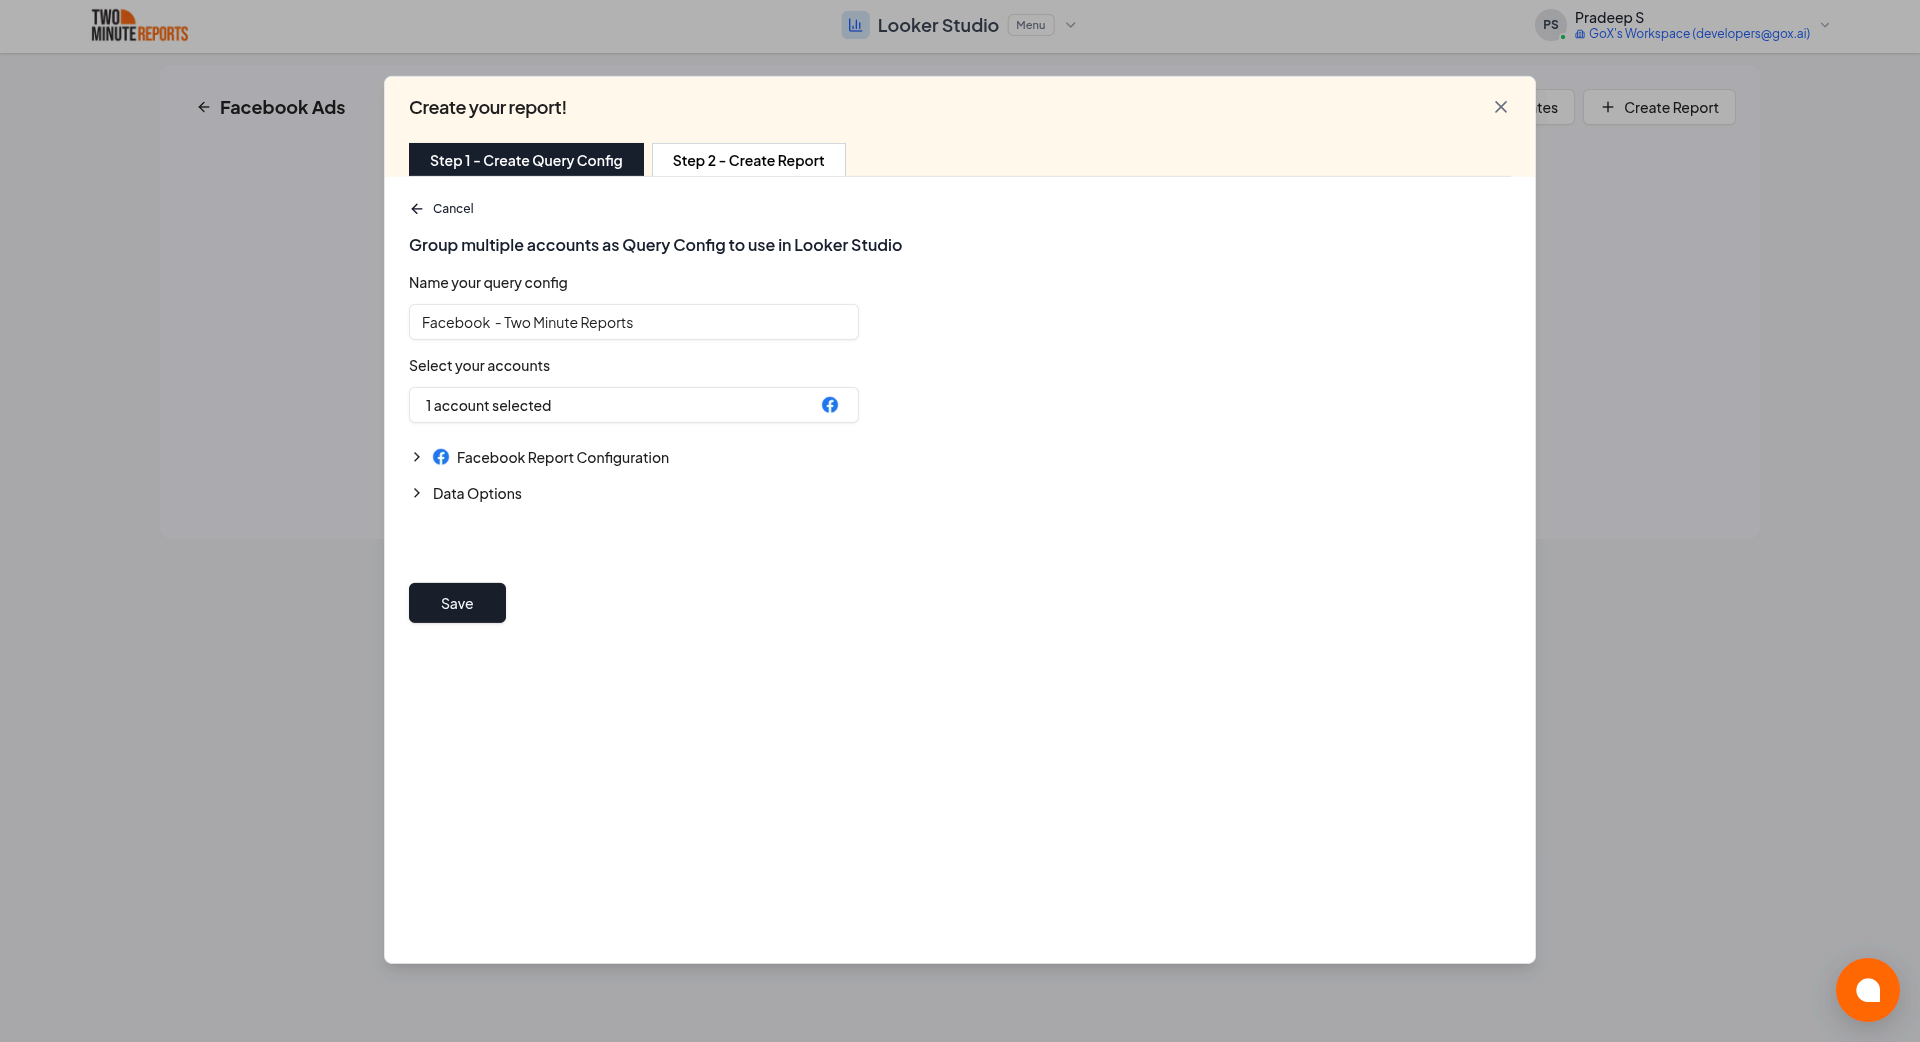
- A query config panel will appear. Do one of the following:
Already have a query config? Select it from the dropdown and skip to step 3.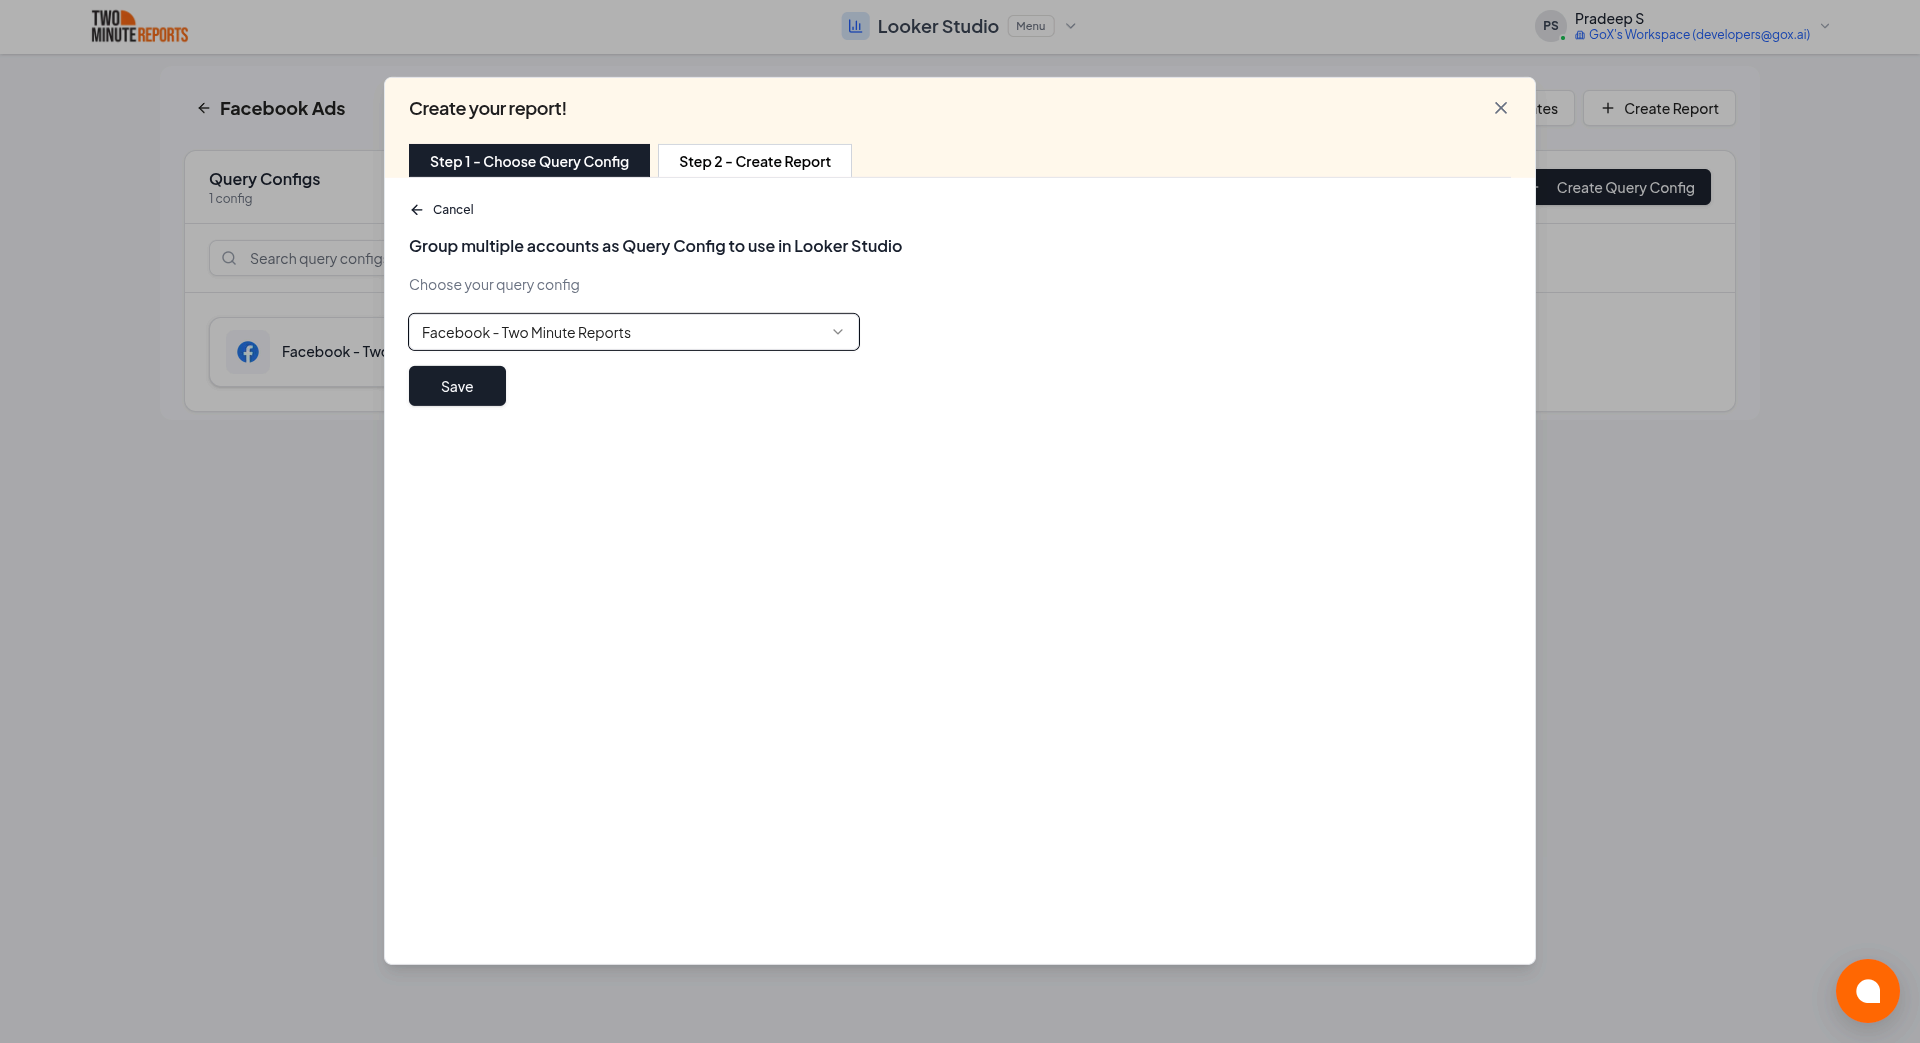
Creating a new query config: Enter a name, select the accounts you want to include from the dropdown, then click Save.
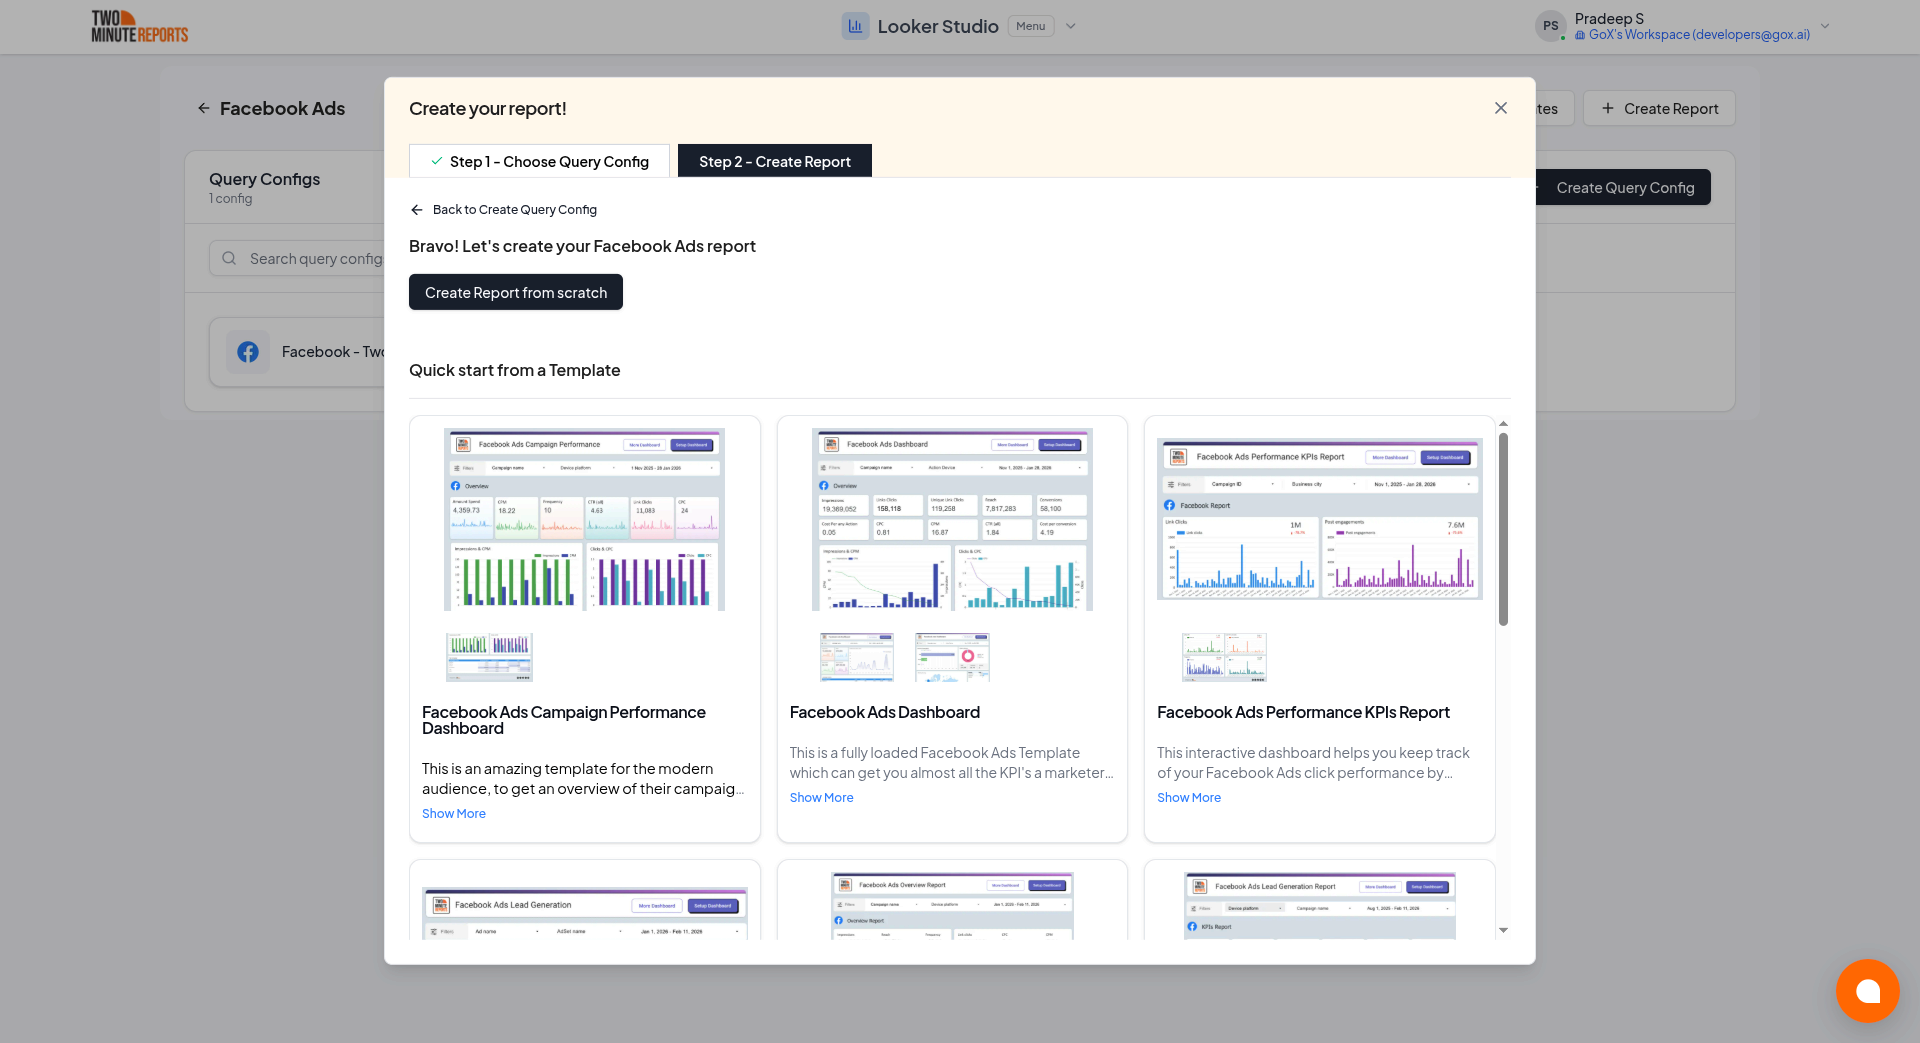
- Choose Create report from scratch to build a custom report, or select one of the pre-built templates to get started quickly.
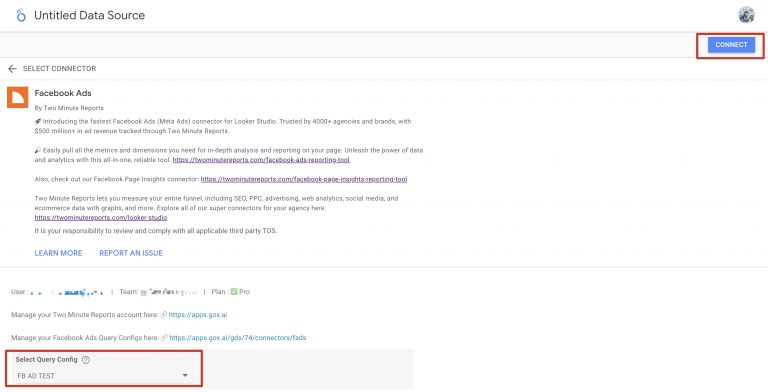
- In the Looker Studio connector panel, select your team and choose the required query config from the dropdown. Click Connect in the top-right corner.
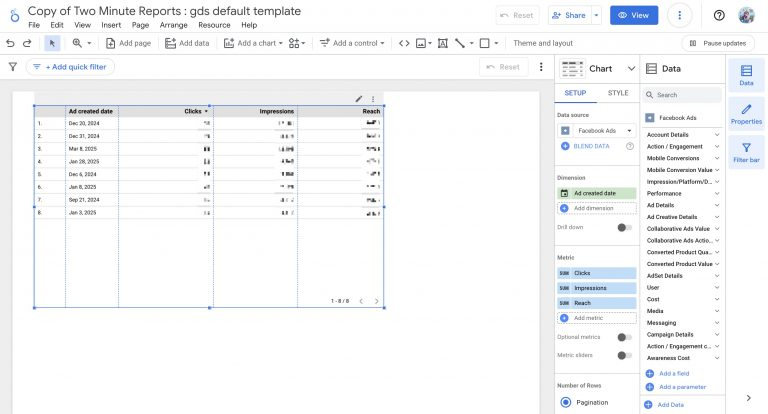
- You'll land on the Looker Studio dashboard. Drag and drop the available Instagram Insights metrics and dimensions onto your canvas to start analyzing your data.