Facebook Ads

Two Minute Reports' Facebook Ads connector lets you access and analyze your data directly in Google Sheets or Looker Studio. Build custom reports, monitor key metrics, and make data-driven decisions - all without writing any code.
What you can report on
- Campaign, ad set, and ad-level performance metrics
- Reach, impressions, clicks, and CTR
- Cost per click (CPC), cost per result, and ROAS
- Audience demographics and placement breakdowns
- Video views, engagement, and conversion tracking
Prerequisites
- A Facebook Business Manager account
- Employee access with View Performance enabled, or Ad Account Analyst access on the Ad Account(s) you want to report on
New Pages experience: If your Business Manager uses Meta's new Pages experience, your account also needs partial access to the linked Facebook Page. This is required because Meta separates personal profiles from page management.
How to create a connection
- Go to https://hub.twominutereports.com/connections
- Click New Connection to create a connection
- Select Facebook Ads from the list of available connectors
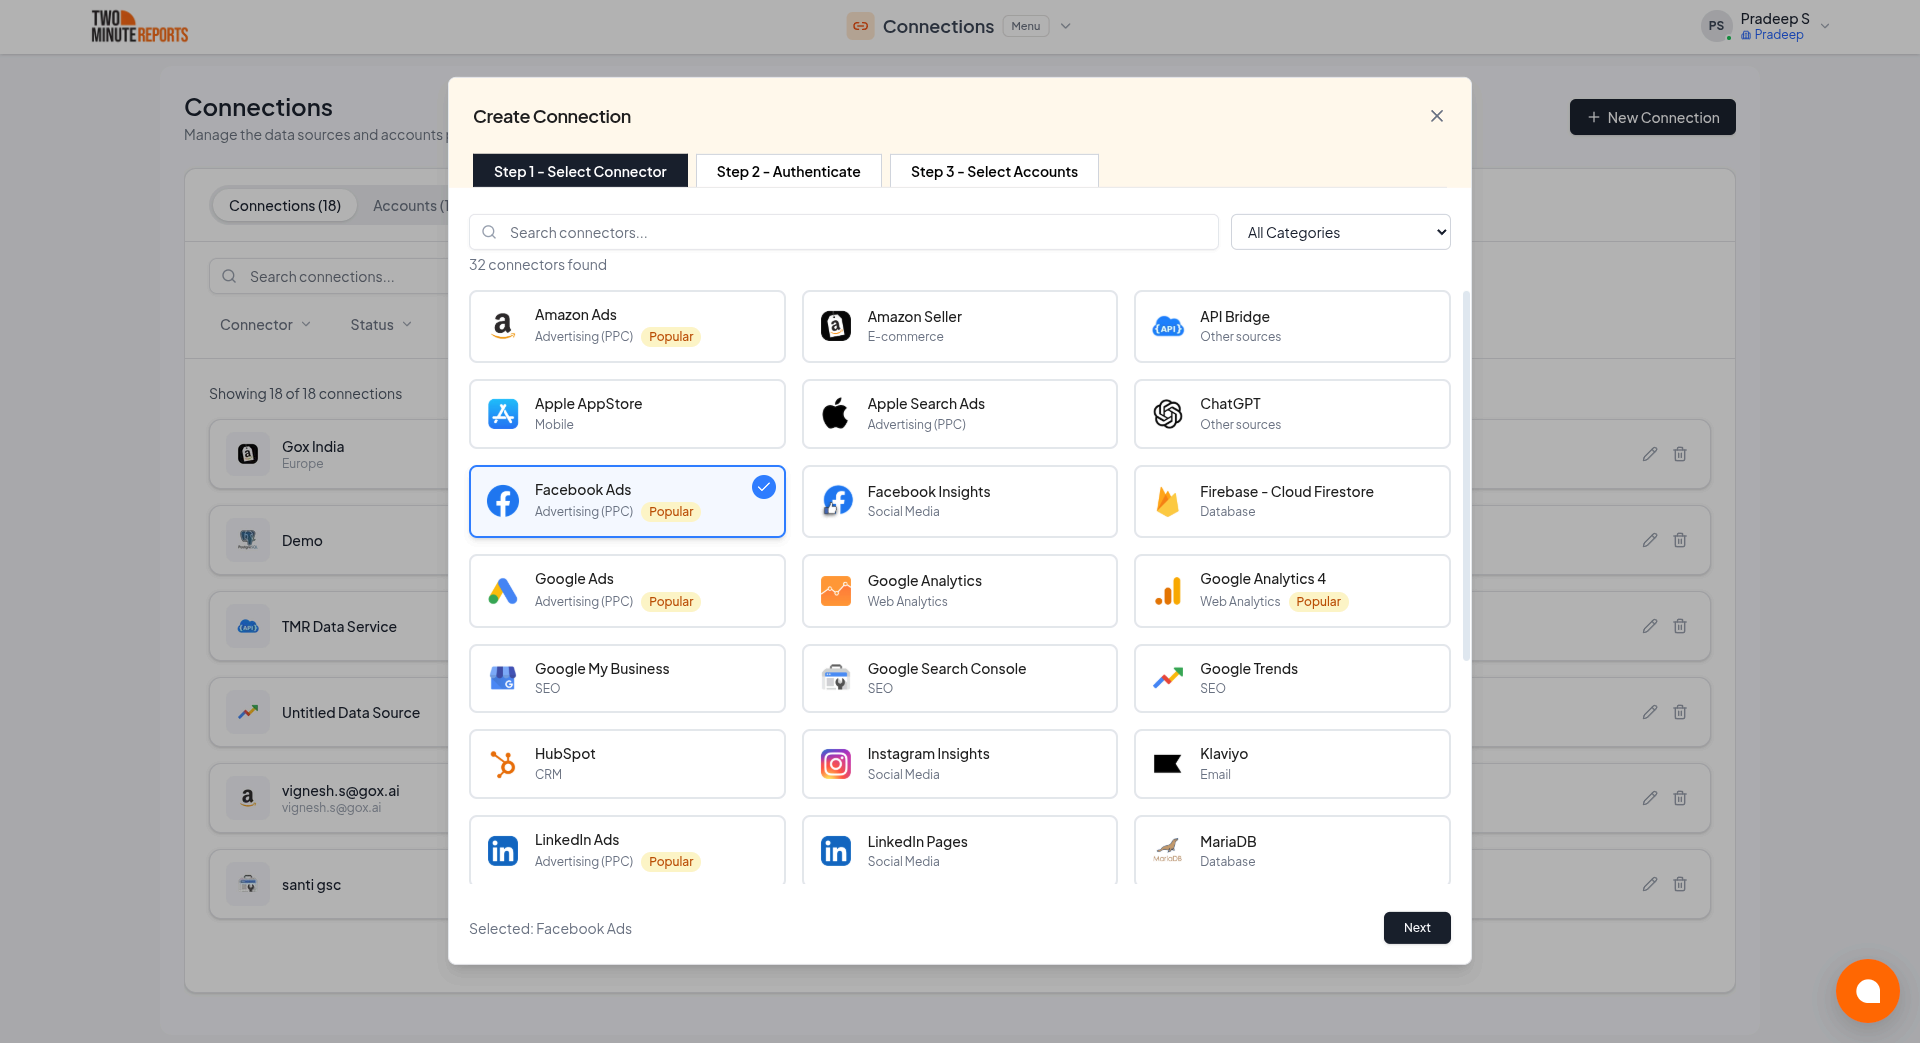
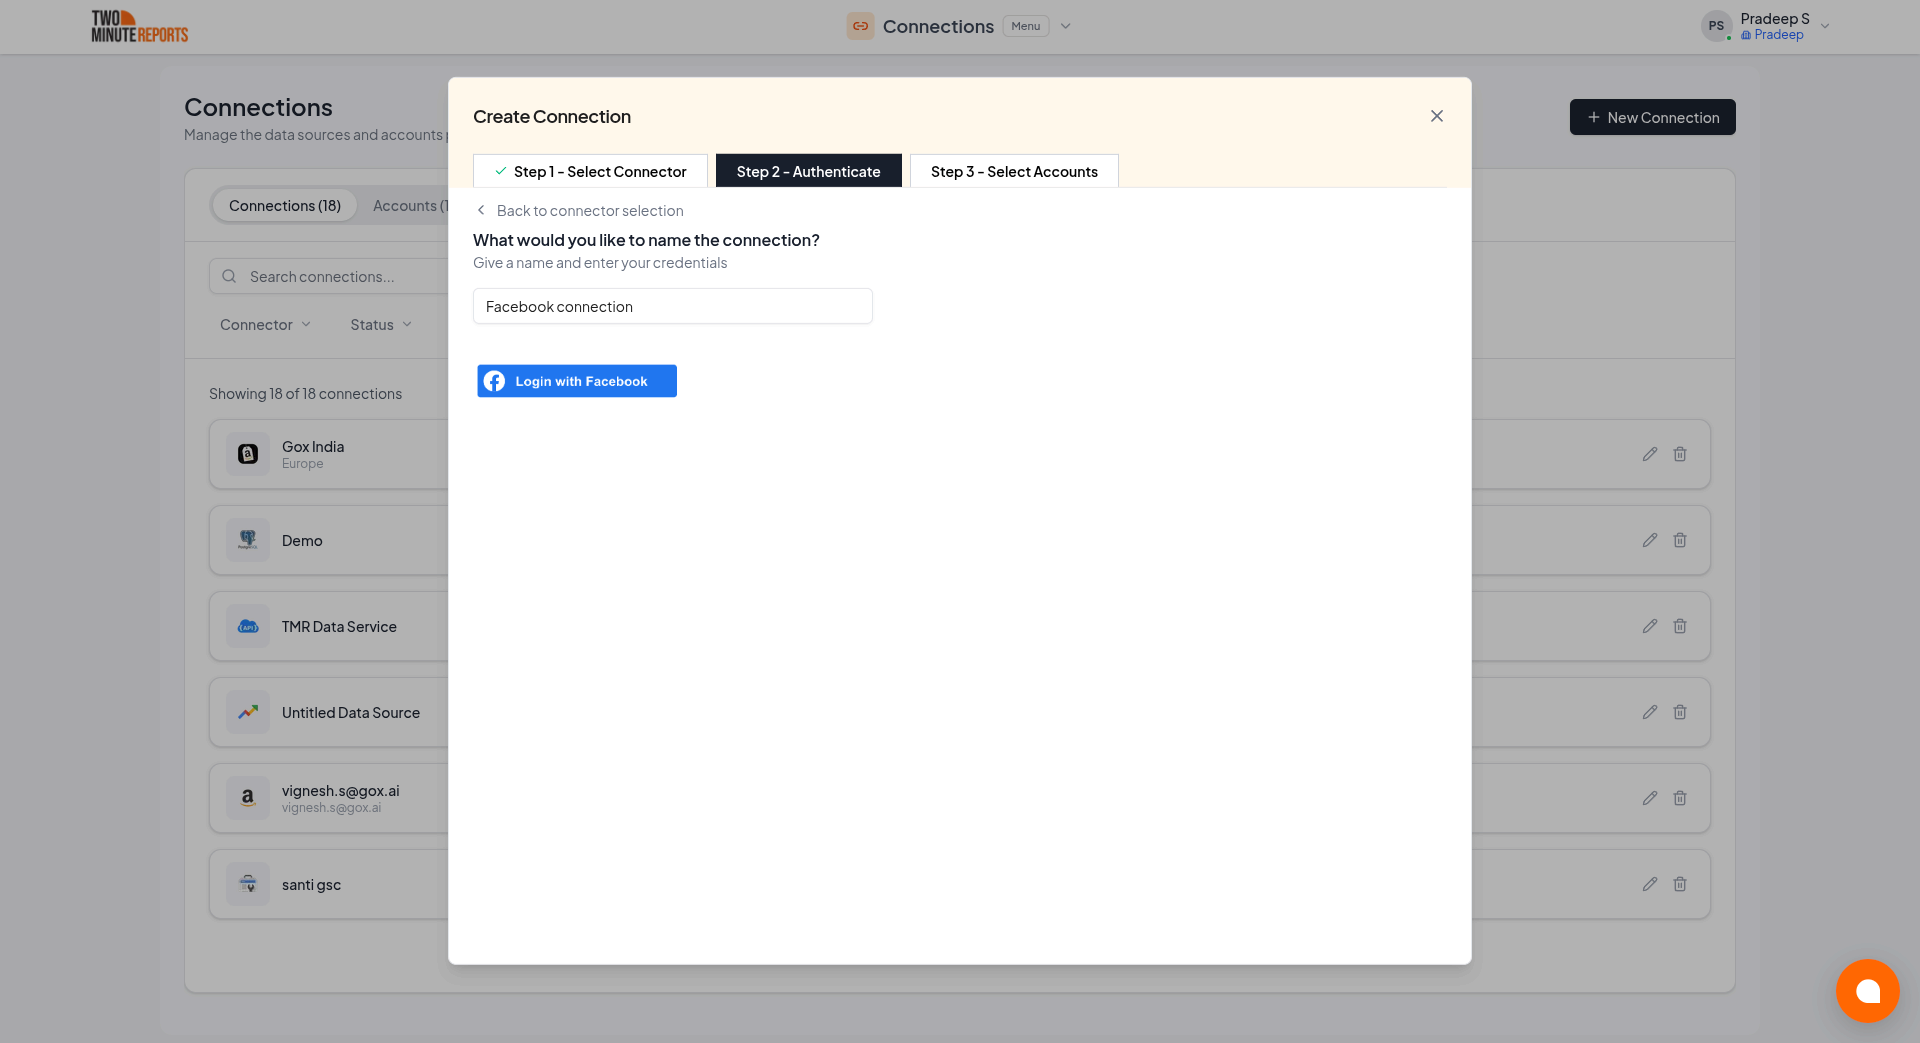
- Name the connection and authorize with your account credentials
After creating a connection:
- Enable the accounts you want to use from the available options
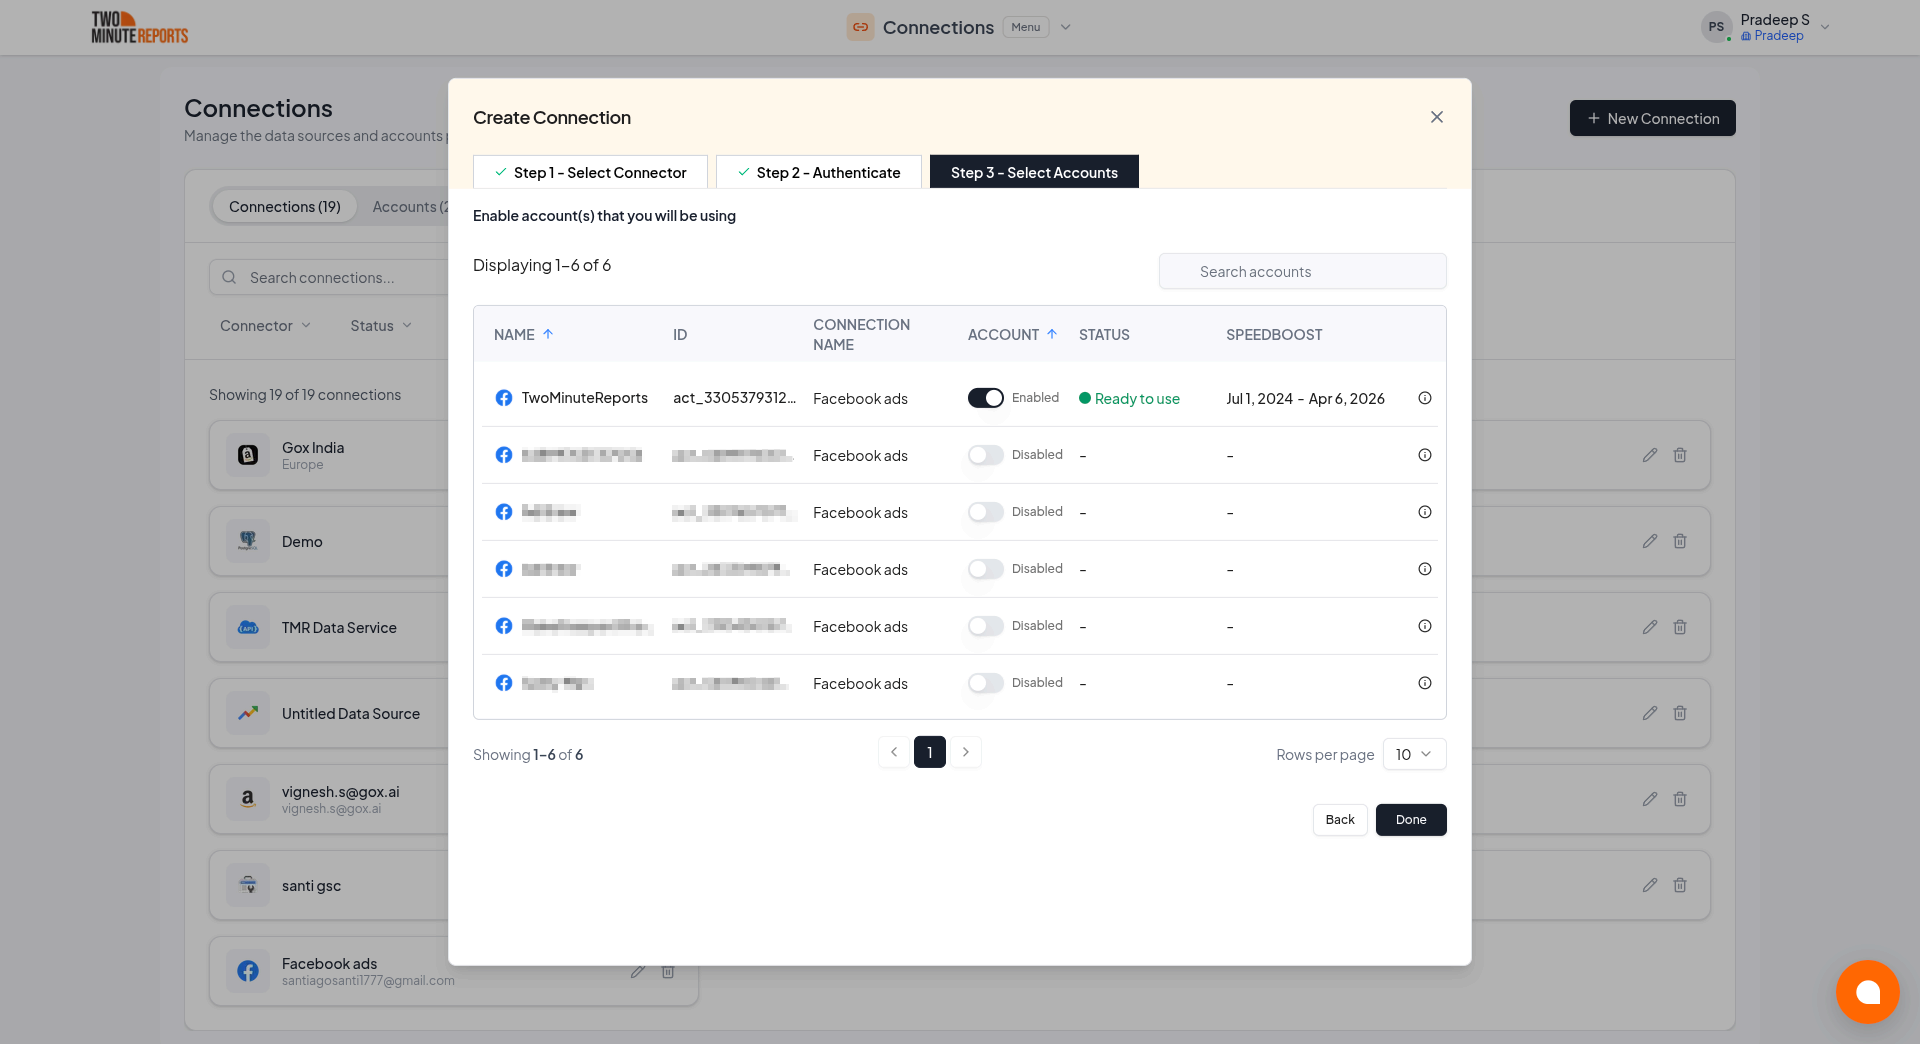
Important: Only enabled accounts can fetch data and count toward your plan usage. You can enable or disable accounts at any time in the hub to manage your plan usage efficiently.
How to get Facebook Ads data into your reports
To pull Facebook Ads data into Google Sheets:
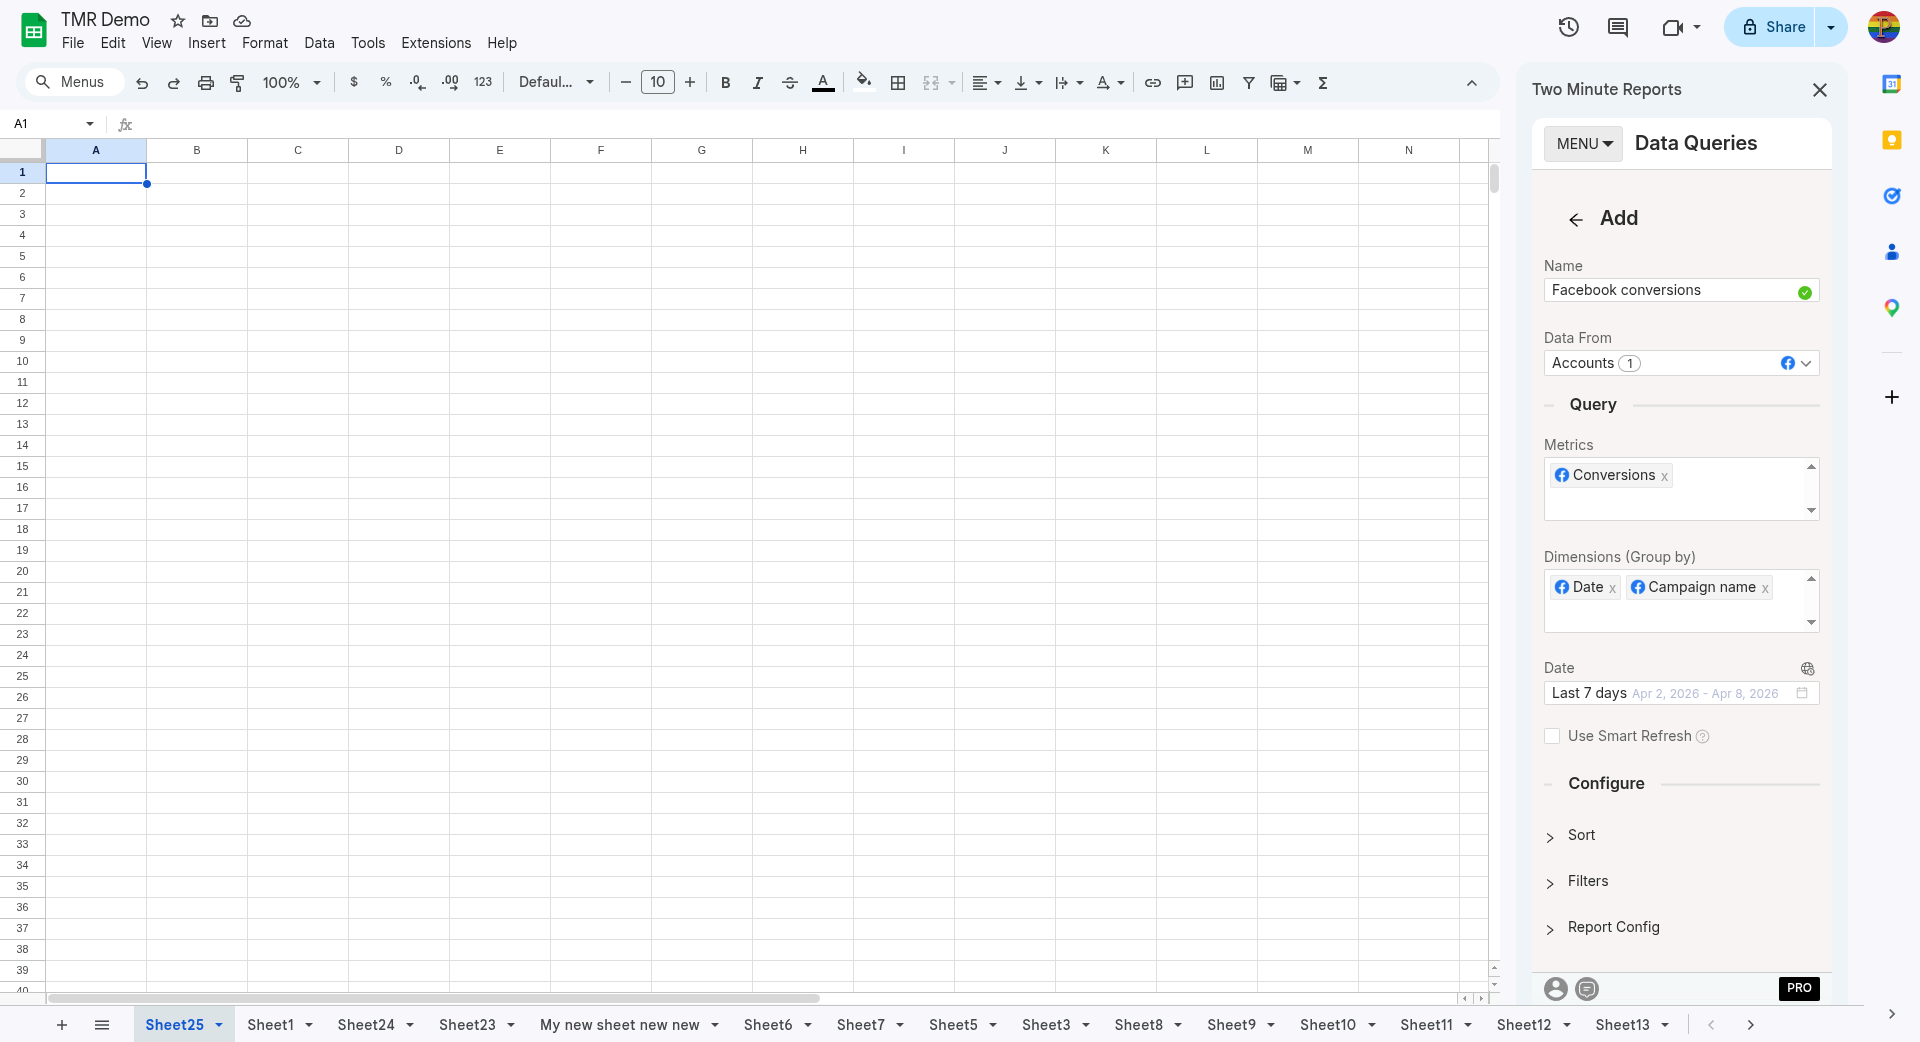
- In the TMR sidebar, go to Data Queries and click Add
- Select the accounts you want to analyze (can select multiple)
- Choose your metrics and dimensions from available options
- Select the date range for your analysis
- Configure sorting and filtering options as needed
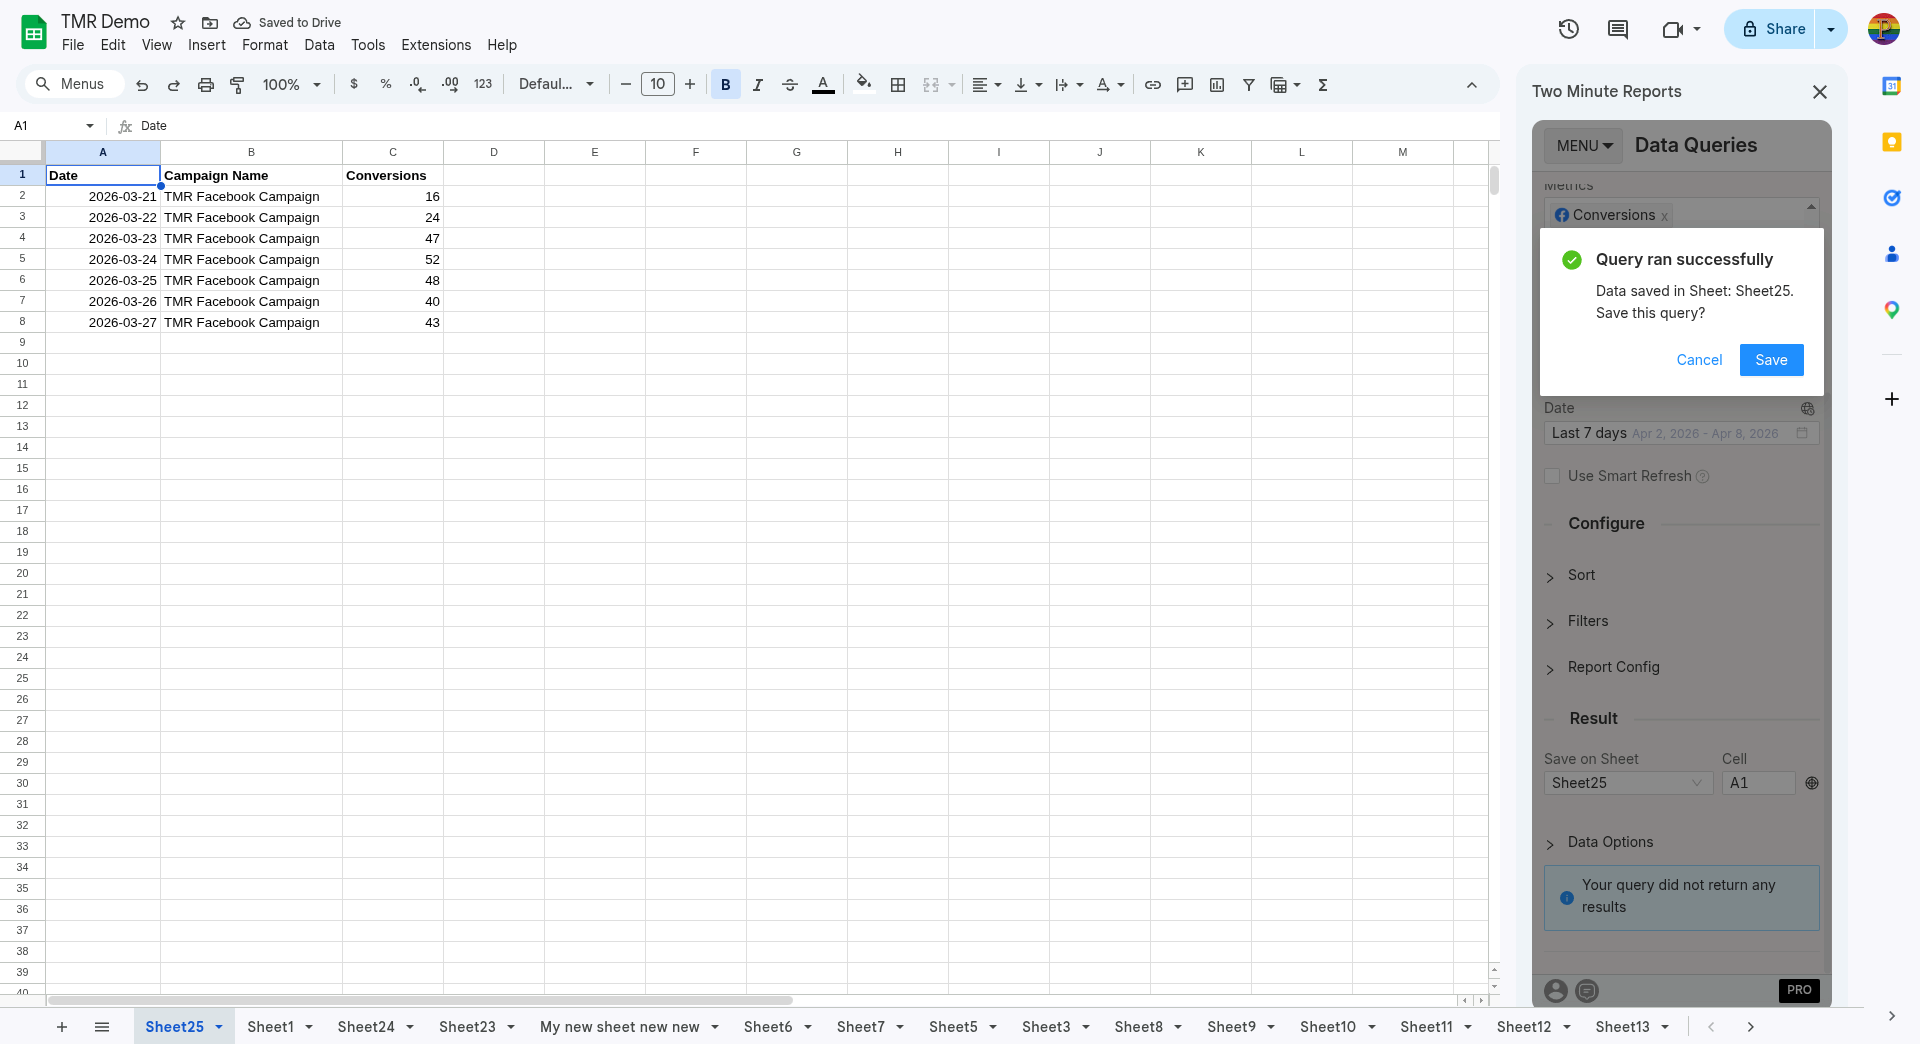
- Click Run Query to populate the data into Google Sheets
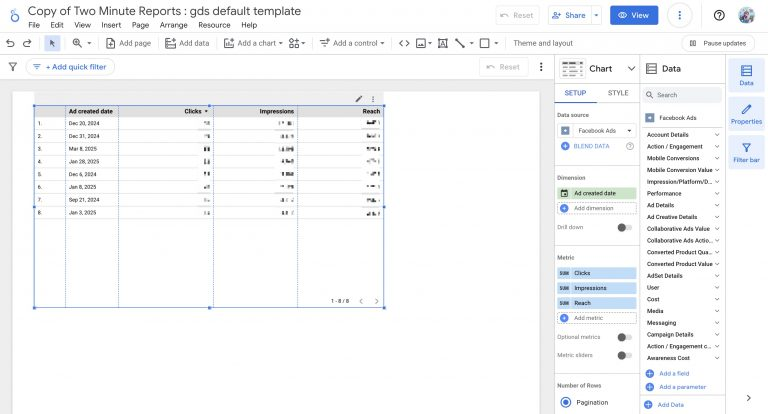
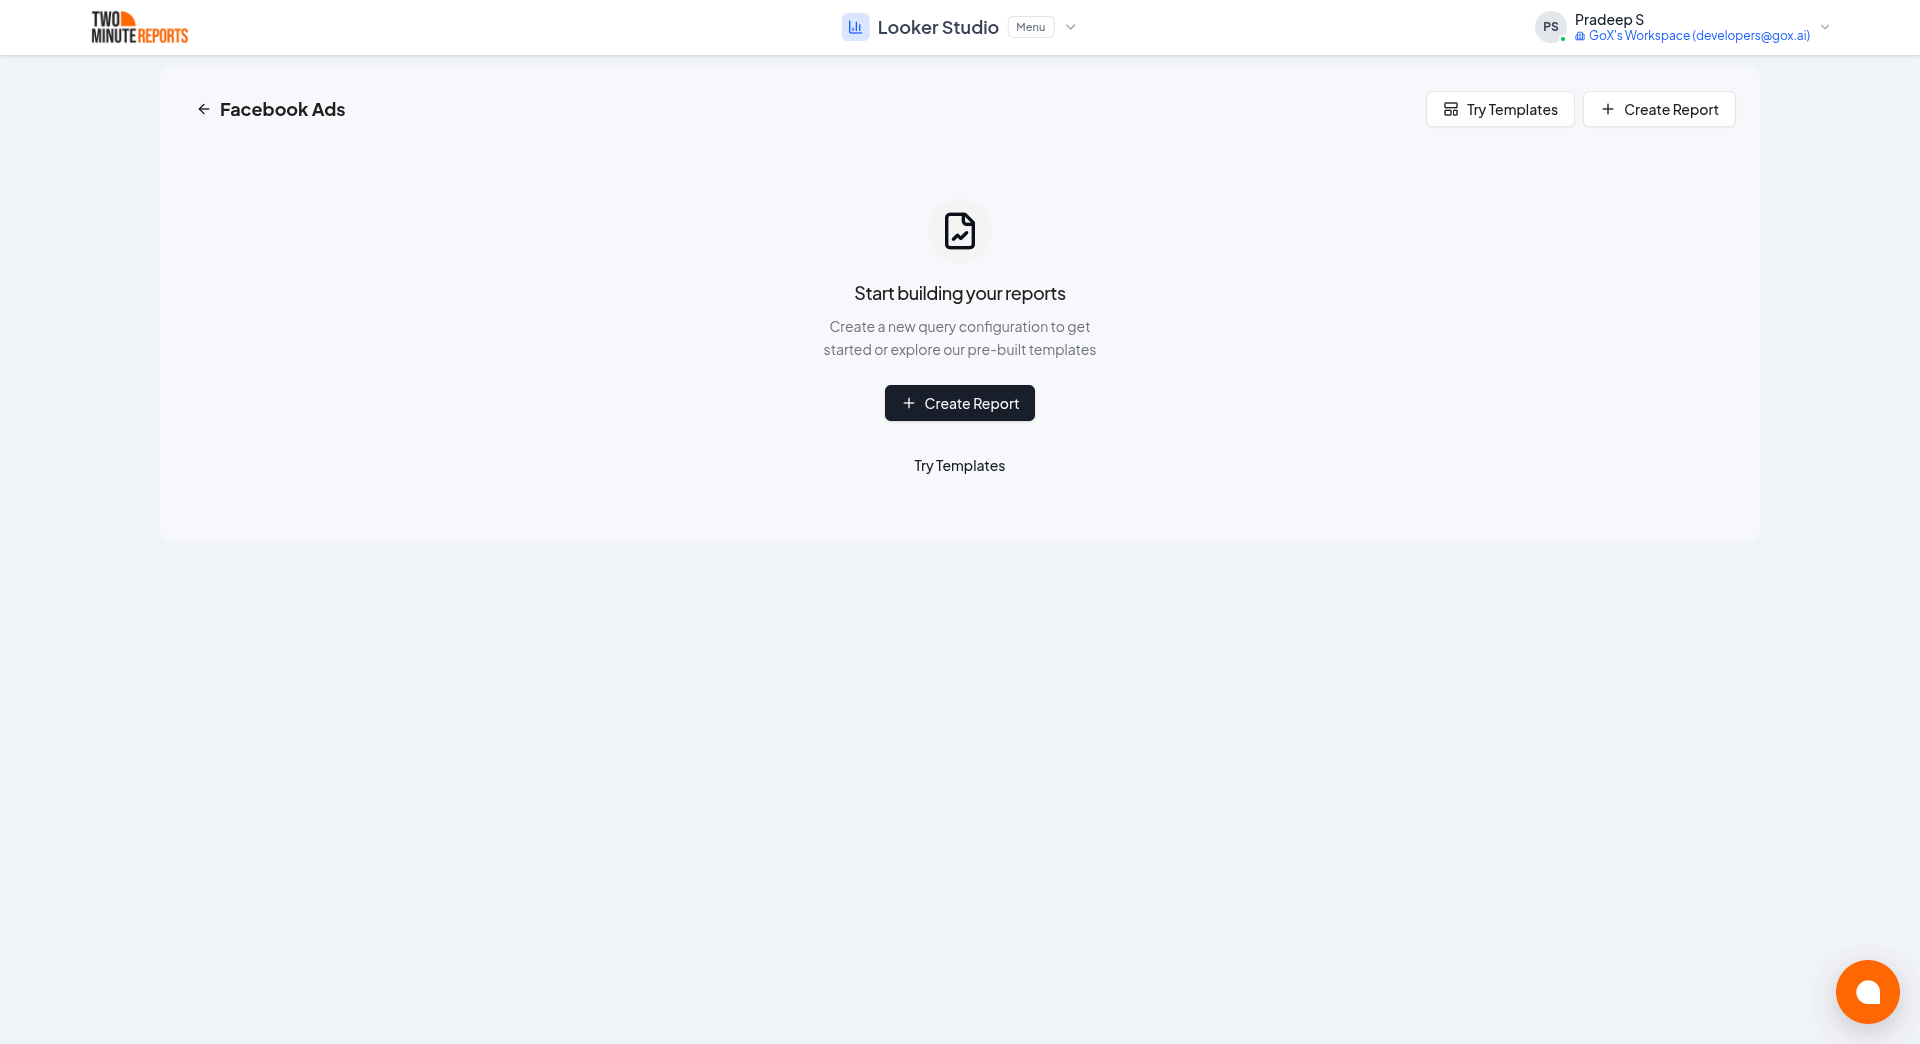
To pull Facebook Ads data into Looker Studio:
- Click Open in Looker Studio, then click + Create Report.
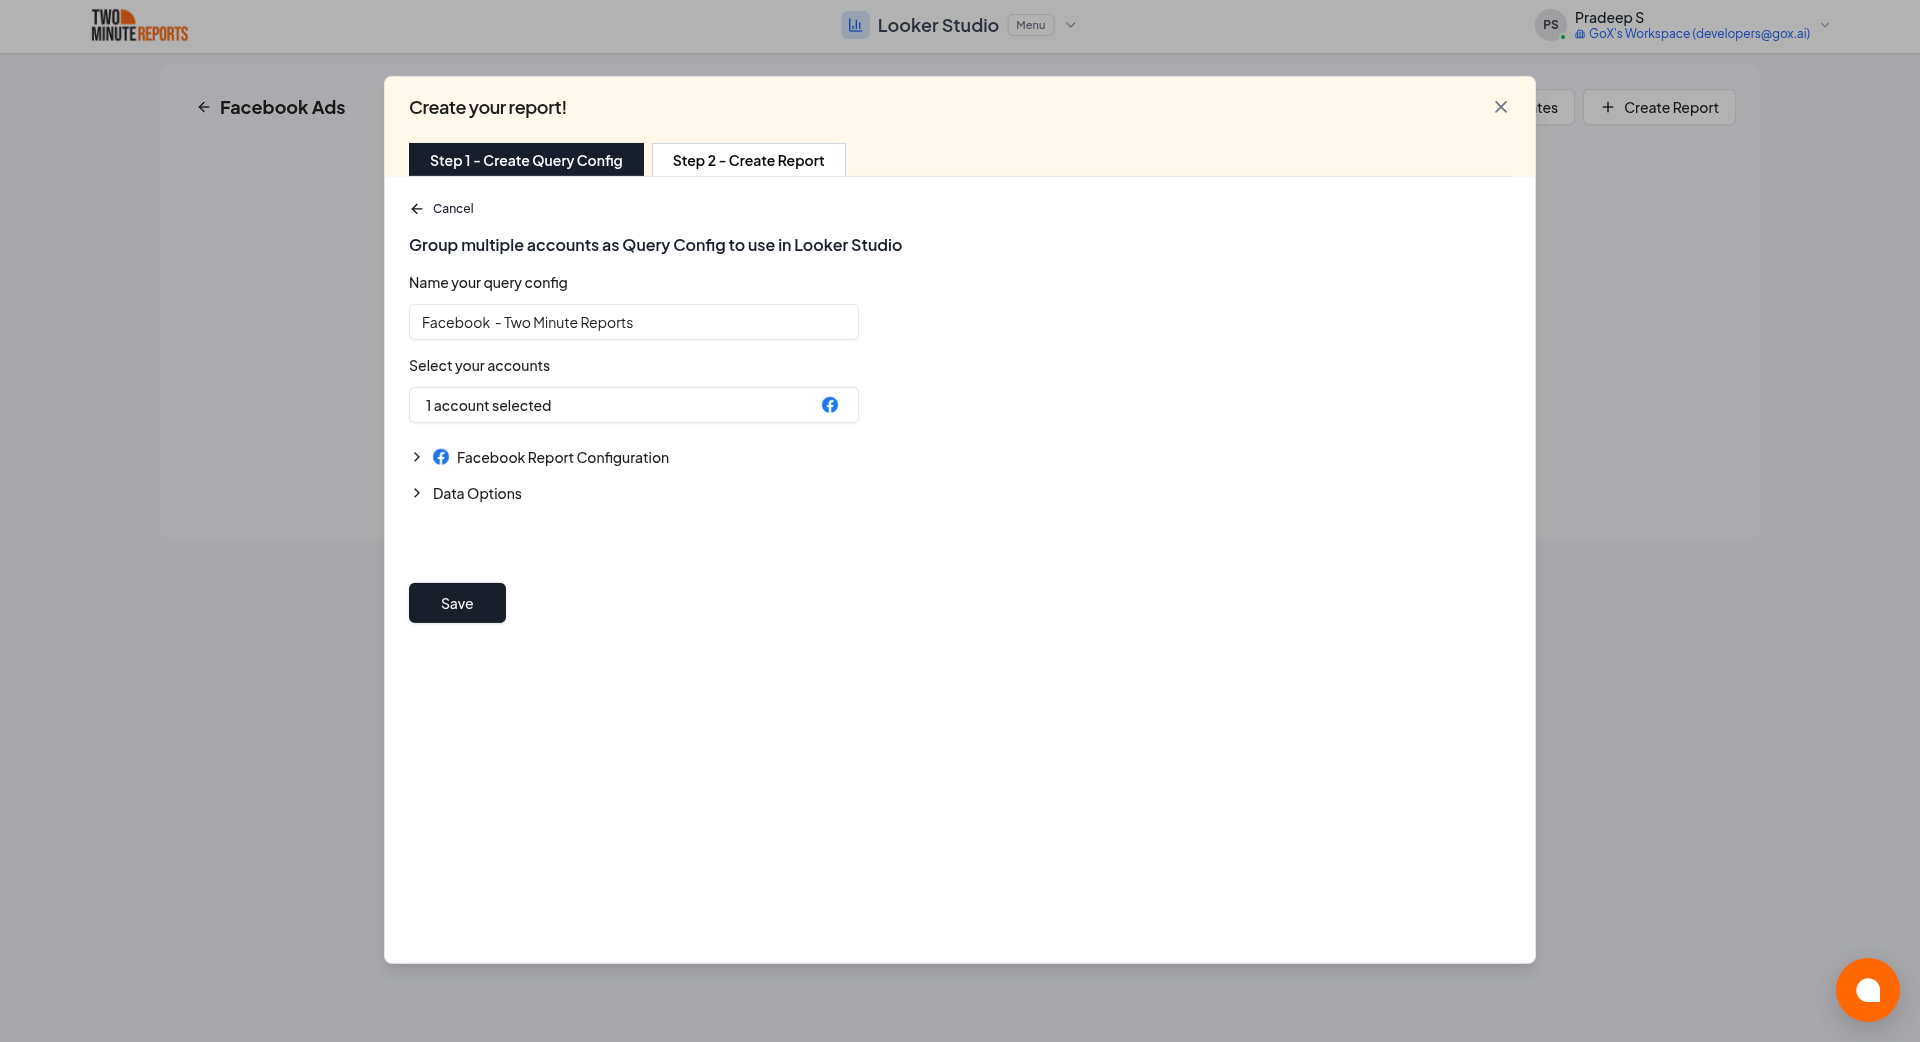
- A query config panel will appear. Do one of the following:
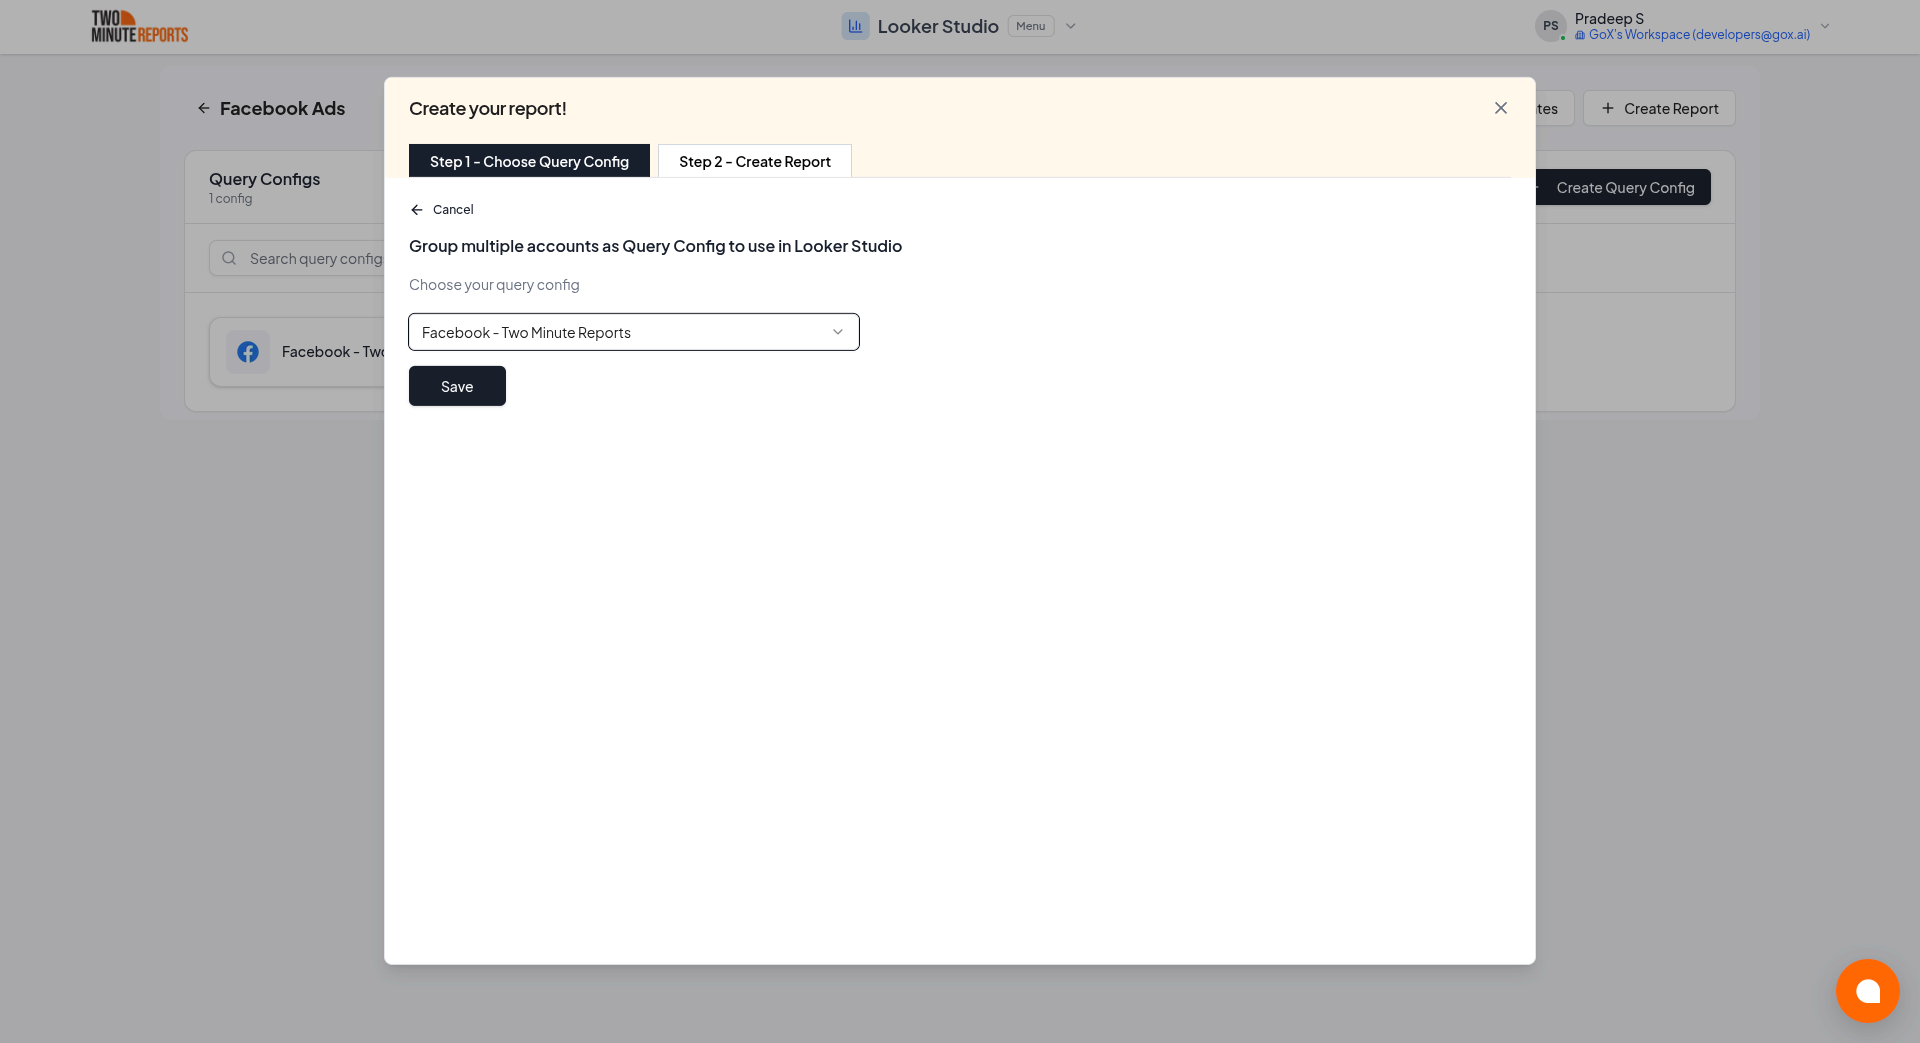
Creating a new query config: Enter a name, select the accounts you want to include from the dropdown, then click Save.
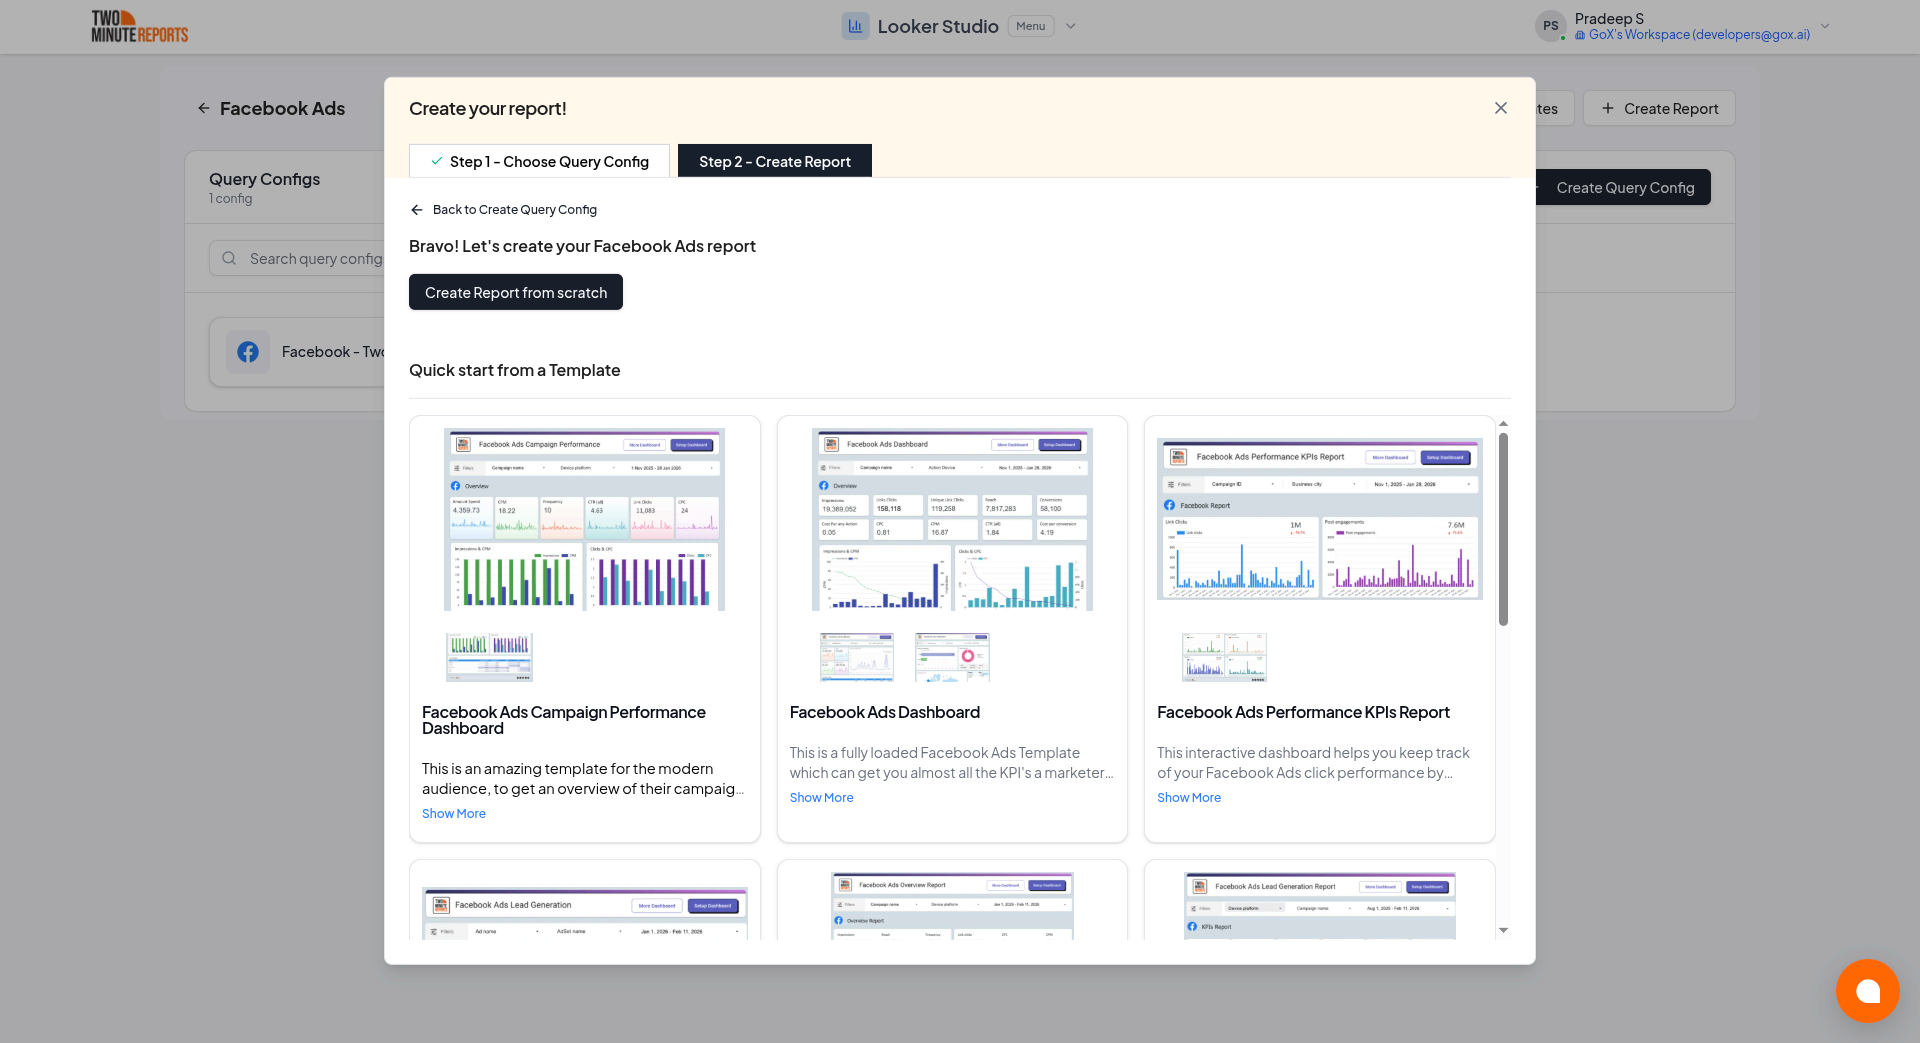
- Choose Create report from scratch to build a custom report, or select one of the pre-built templates to get started quickly.
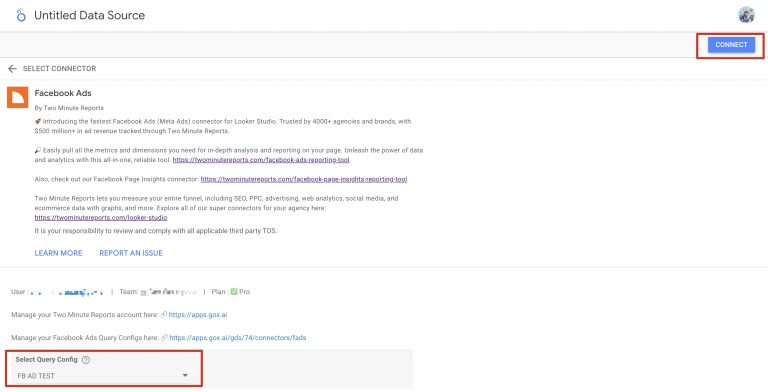
- In the Looker Studio connector panel, select your team and choose the required query config from the dropdown. Click Connect in the top-right corner.
- You'll land on the Looker Studio dashboard. Drag and drop the available Facebook Ads metrics and dimensions onto your canvas to start analyzing your data.