Combine data across multiple Data Sources
“What’s my total spend across all Ad platforms last month?”, you may ask when running campaigns across multiple platforms like Facebook, TikTok, or Google Ads. Blended Fields is here to automatically combine data, so that you can quickly answer these questions.
For example, you can select 9 Blended metrics (Impressions, Clicks, CTR, etc.) and 1 blended dimension (year-month) for tracking and visualization. This gets the consolidated campaign performance across Facebook Ads and Google Ads in a single query.
In the spreadsheet, you can see that the month-wise performance metrics are aggregated automatically from both Facebook Ads and Google Ads.
Blended Fields can be accessed from the Common Fields section under the metrics/dimensions section.

Continue reading to understand how to use Blended Fields.
How to use Blended Fields
In case you have not added any Data Sources, please add them. You can add them in the “Data Source” section under the “Menu”. Please check this article if you need support in adding a data source.
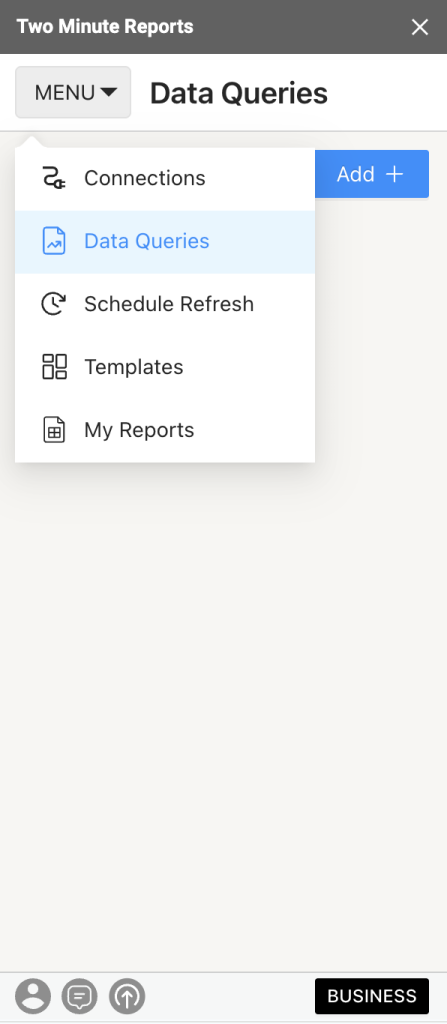
Once a Data Source is added, select the Data Queries option from the main menu, and you will land in the query creation window. Now, click “Add +” on the top left of the sidebar to enter the query creation section.

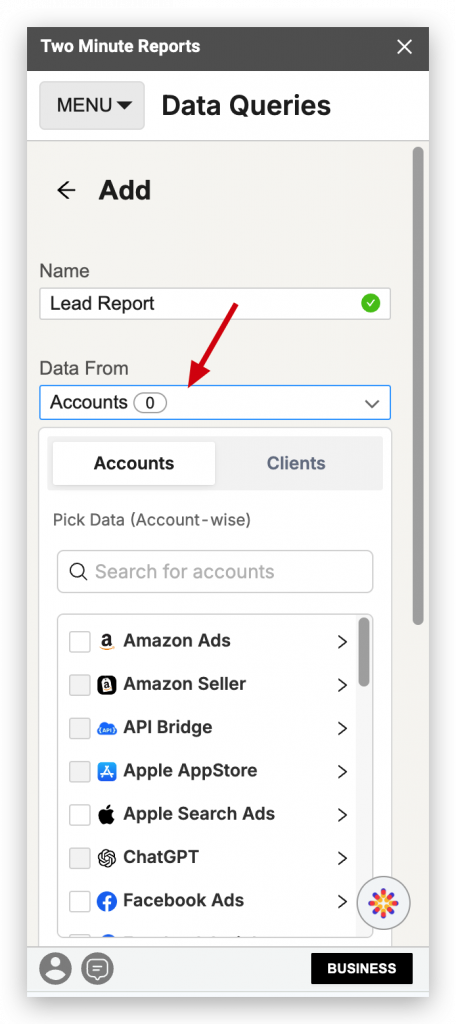
Step 1: Now let’s give it a “Name”.

Step 2: There are two ways you can select your accounts. You can either select them through accounts or client categorization:
- Accounts: If you have not done Client Mapping, for now, you can select the accounts you need from the Accounts tab. Here you can select all the different data sources that are compatible with each other.
- Clients: This is the recommended way if you are an agency. This allows easy management of client data all in one place. You will see that all clients’ accounts are organized clearly under different client names. This allows you to easily answer questions like “What’s the total ad spend of client_1 ?”, etc.
Based on the selection, your data will be aggregated accordingly.
Step 3: Select the ad account(s) from which you want the data to be fetched. In our case, it’s Facebook and Google. Once the Facebook ad account is selected, scroll down to Google Ads. Now, click on the drop-down and select the ad account.
Step 4: The same can be done on the client level by selecting the “Client” tab and their ad accounts. This section allows you to select multiple ad accounts of your client to draft the query.
Step 5: Scroll down to metrics and click on the dropdown to view all the metrics. Here you can see the Common Fields section. Where you can choose any of the Blended Fields, like “Ad performance metrics”, to get the performance data.
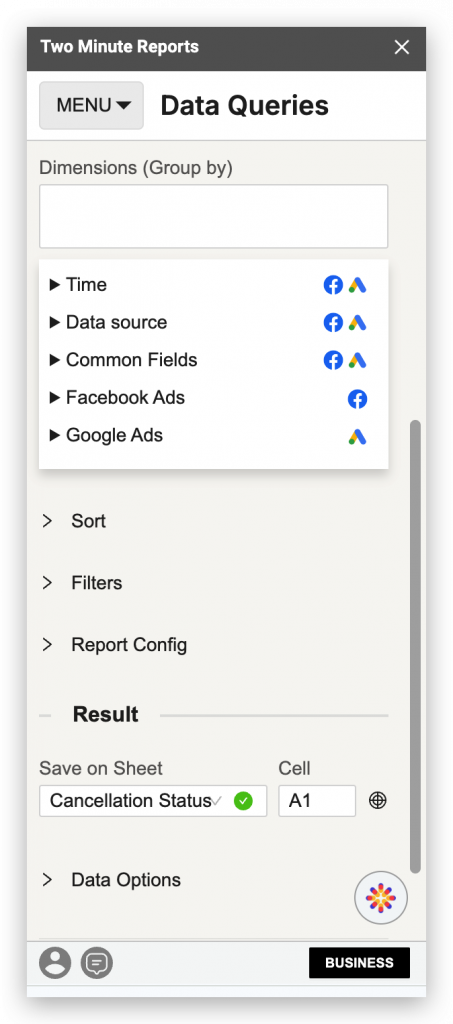
Step 6: Scroll down to select the dimension you want to add to the data. To get data for every month of the year, select “Time” and “Year month.”

Now, select the sheet and cell to write the data on and hit “Run query.”
The aggregated data from both Facebook Ads and Google Ad campaigns for Impressions, Clicks, Amount spent, Conversions, Leads, and CTR for every month from the start of this year is ready. Likewise, you can select and map relevant metrics and dimensions to unlock campaign insights across multiple channels holistically.