Google Trends is an invaluable tool for keyword research. It helps identify spikes in search volume related to certain events. In addition, it provides detailed data about search volume index and geographical information of search engine users.
Two Minute Reports offers a solution to this problem, providing an easy way to connect Google Trends with Google Sheets without any coding.
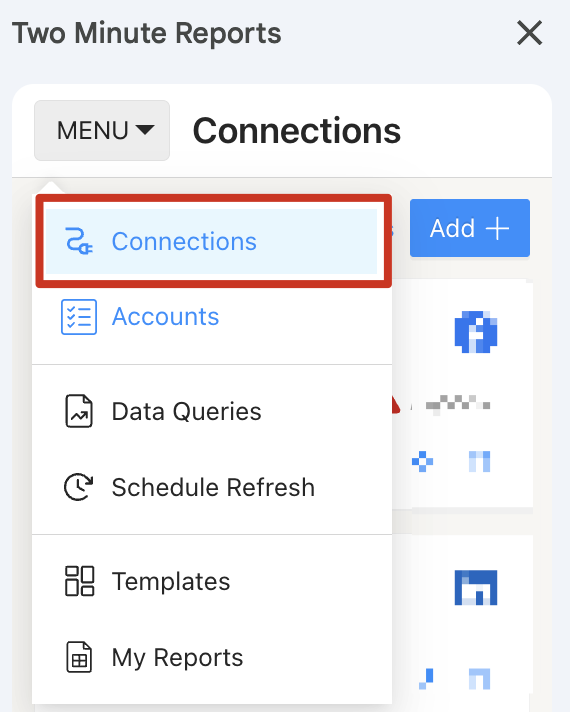
Step 1: Install and Launch Two Minute Reports
Begin by installing TMR in Google Sheets using this step-by-step tutorial: How to install TMR in Google Sheets?
Once completed, you can connect your Google Trends account to extract google trends data into Google Sheets.
Step 2: Connect Google Trends to Google Sheets
When the “Adding New Connection” dialog box appears, complete the following three key steps to access your Google Trends accounts:
- Selecting the Google Trends Connector
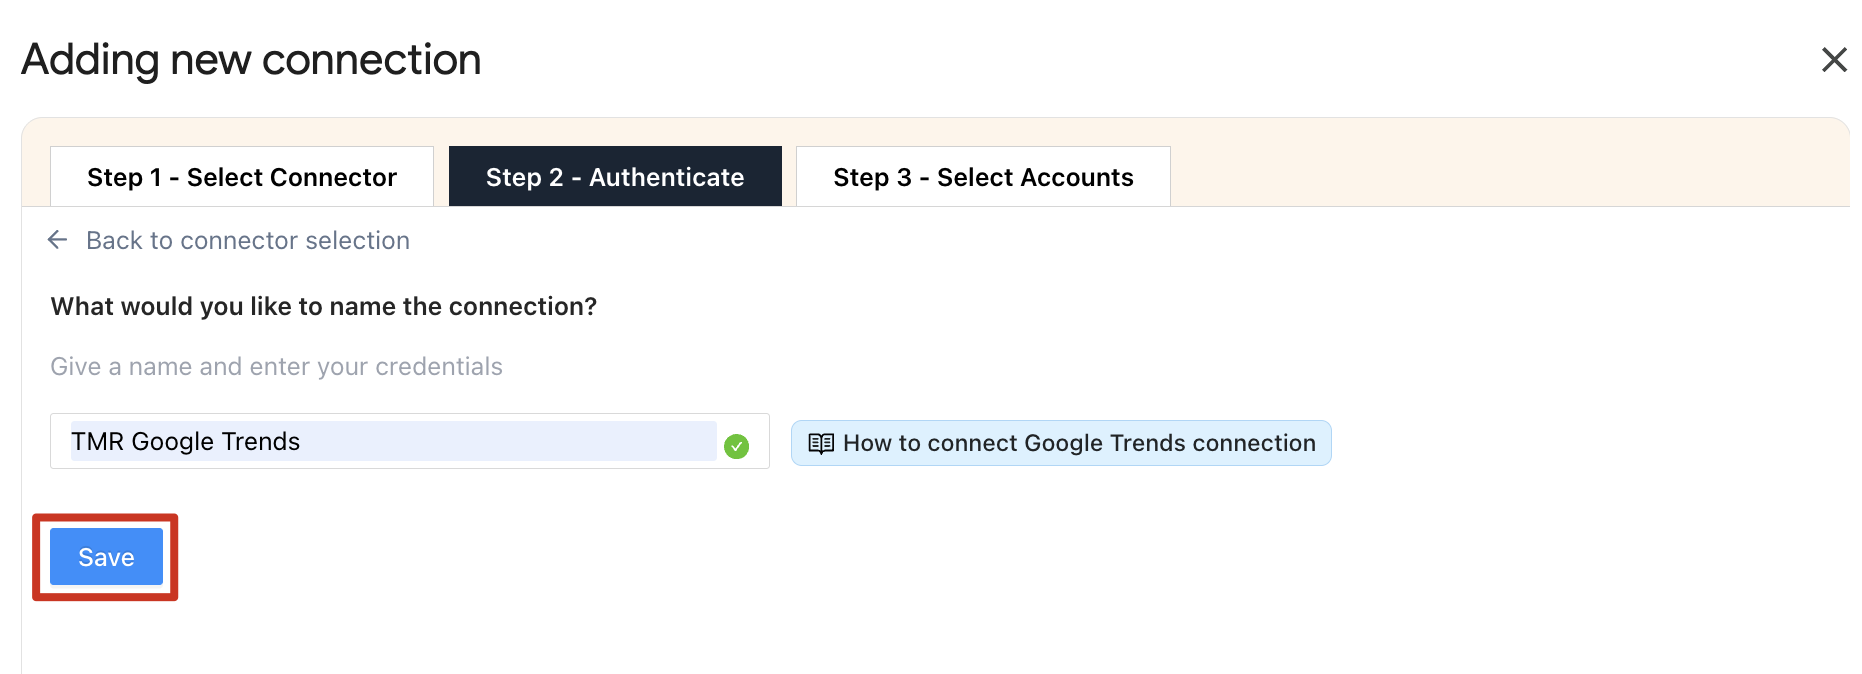
- Authenticate your account
- Enable the respective accounts within the Google Trends Connector
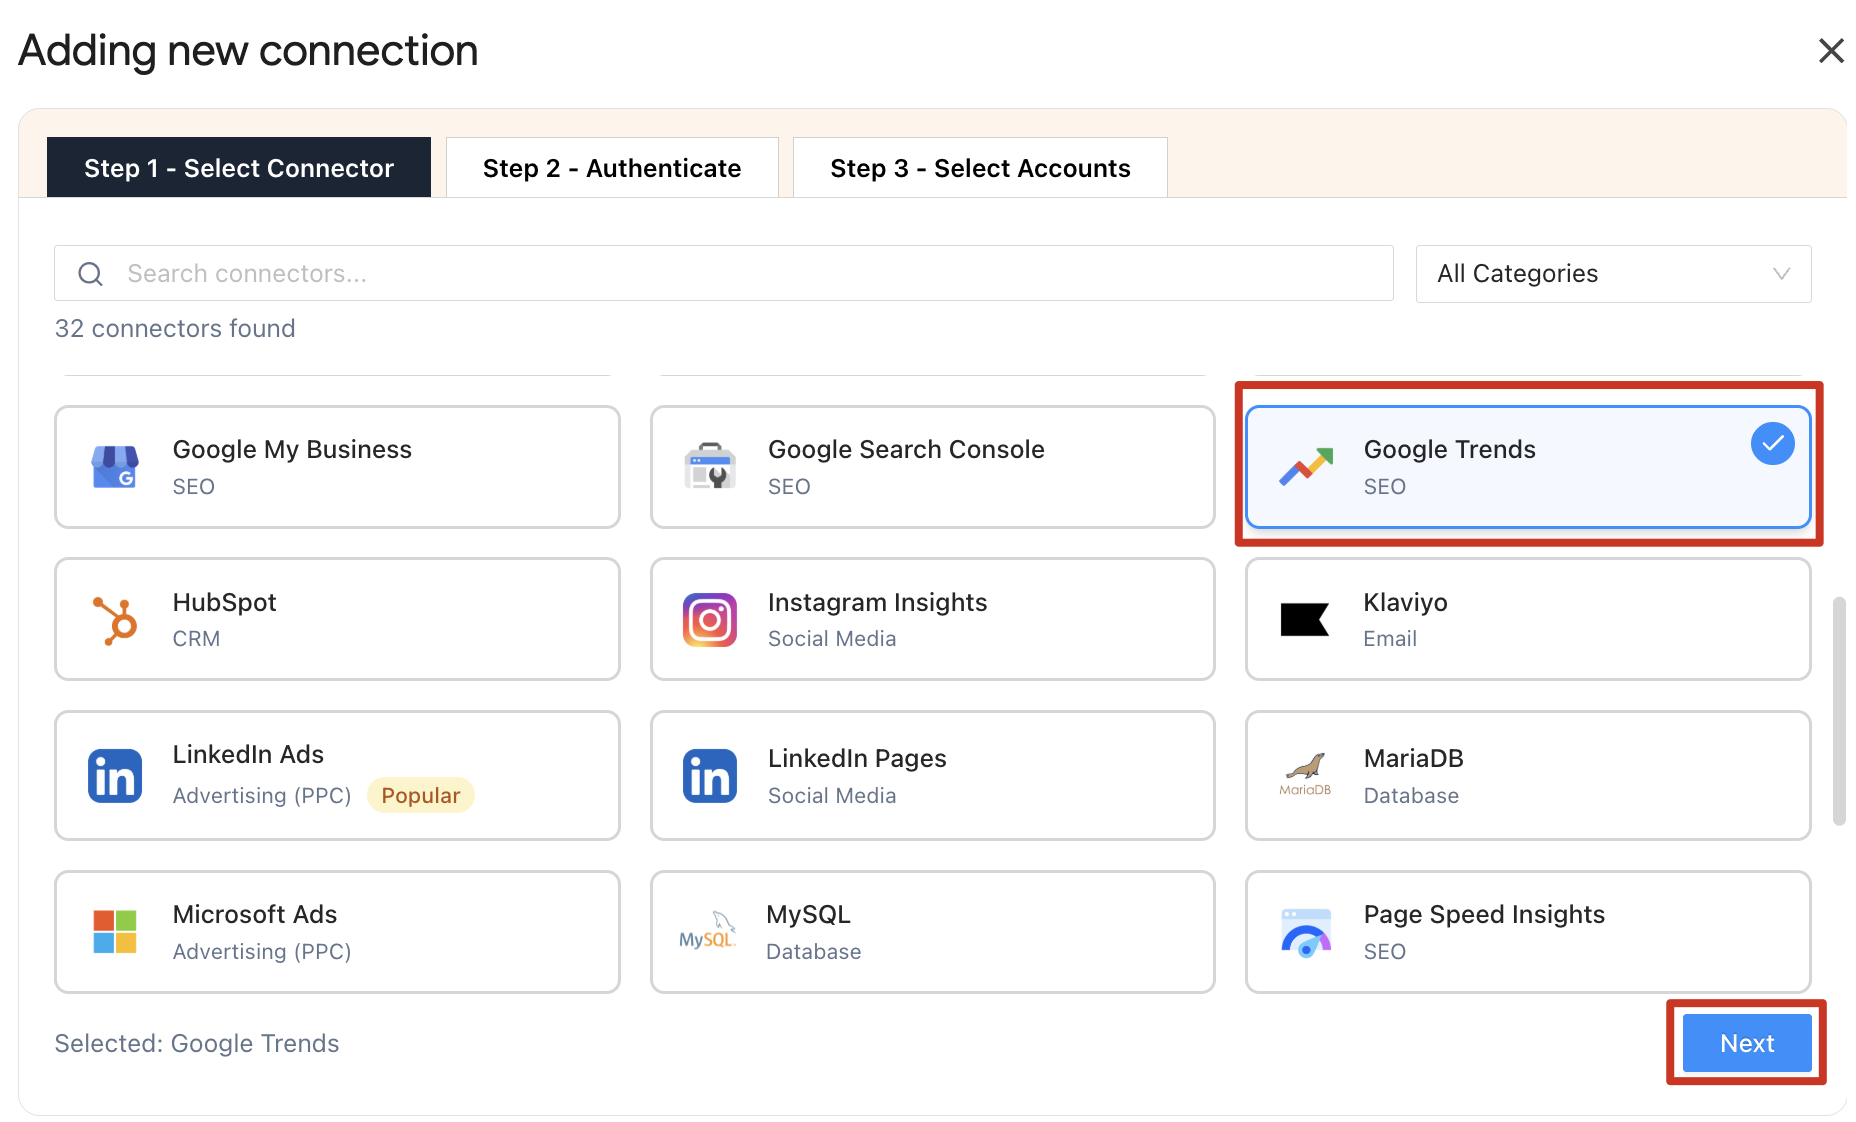
Choose Google Trends from the available options, and authorize the Connection by entering your login credentials.
After successful authentication, you will see a modal showing your Account name, ID, Connection name, and Status, as shown below:
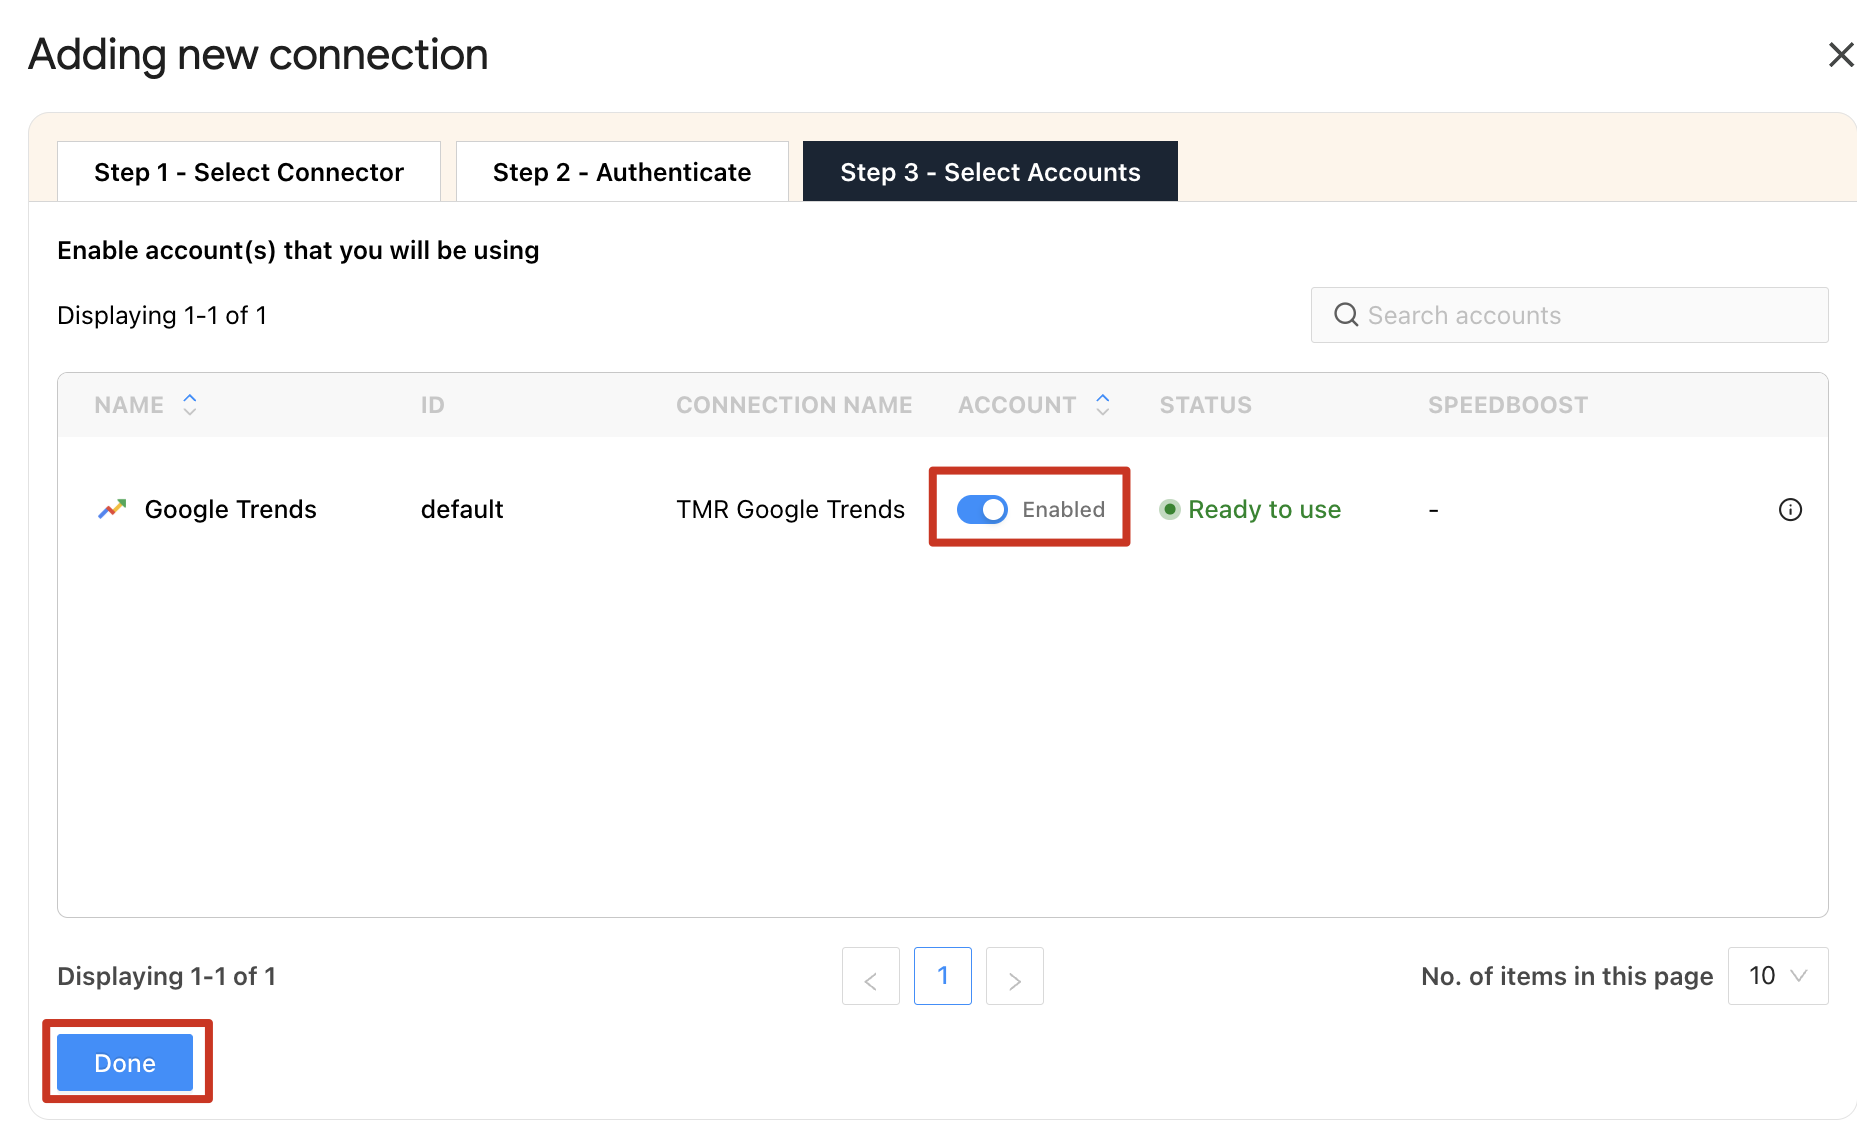
Enable the toggle for the ad accounts you intend to query. Please note that you cannot extract data that are disabled.
| To ensure the connected accounts are reflected in the TMR sidebar, click “Refresh Connections.” |
Step 3: Getting Google Trends data in Google Sheets
You must create a new query by navigating to the Data Queries section to extract Google trends data.
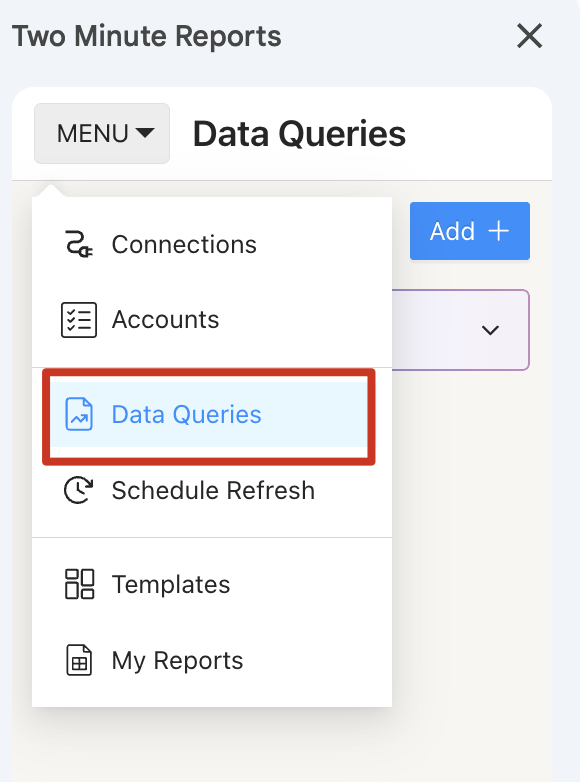
Click Add and choose the Google Trends accounts you wish to analyze.
You can manage multiple clients’ Google Trends accounts under one interface. Simply select one or more accounts to obtain actionable insights.
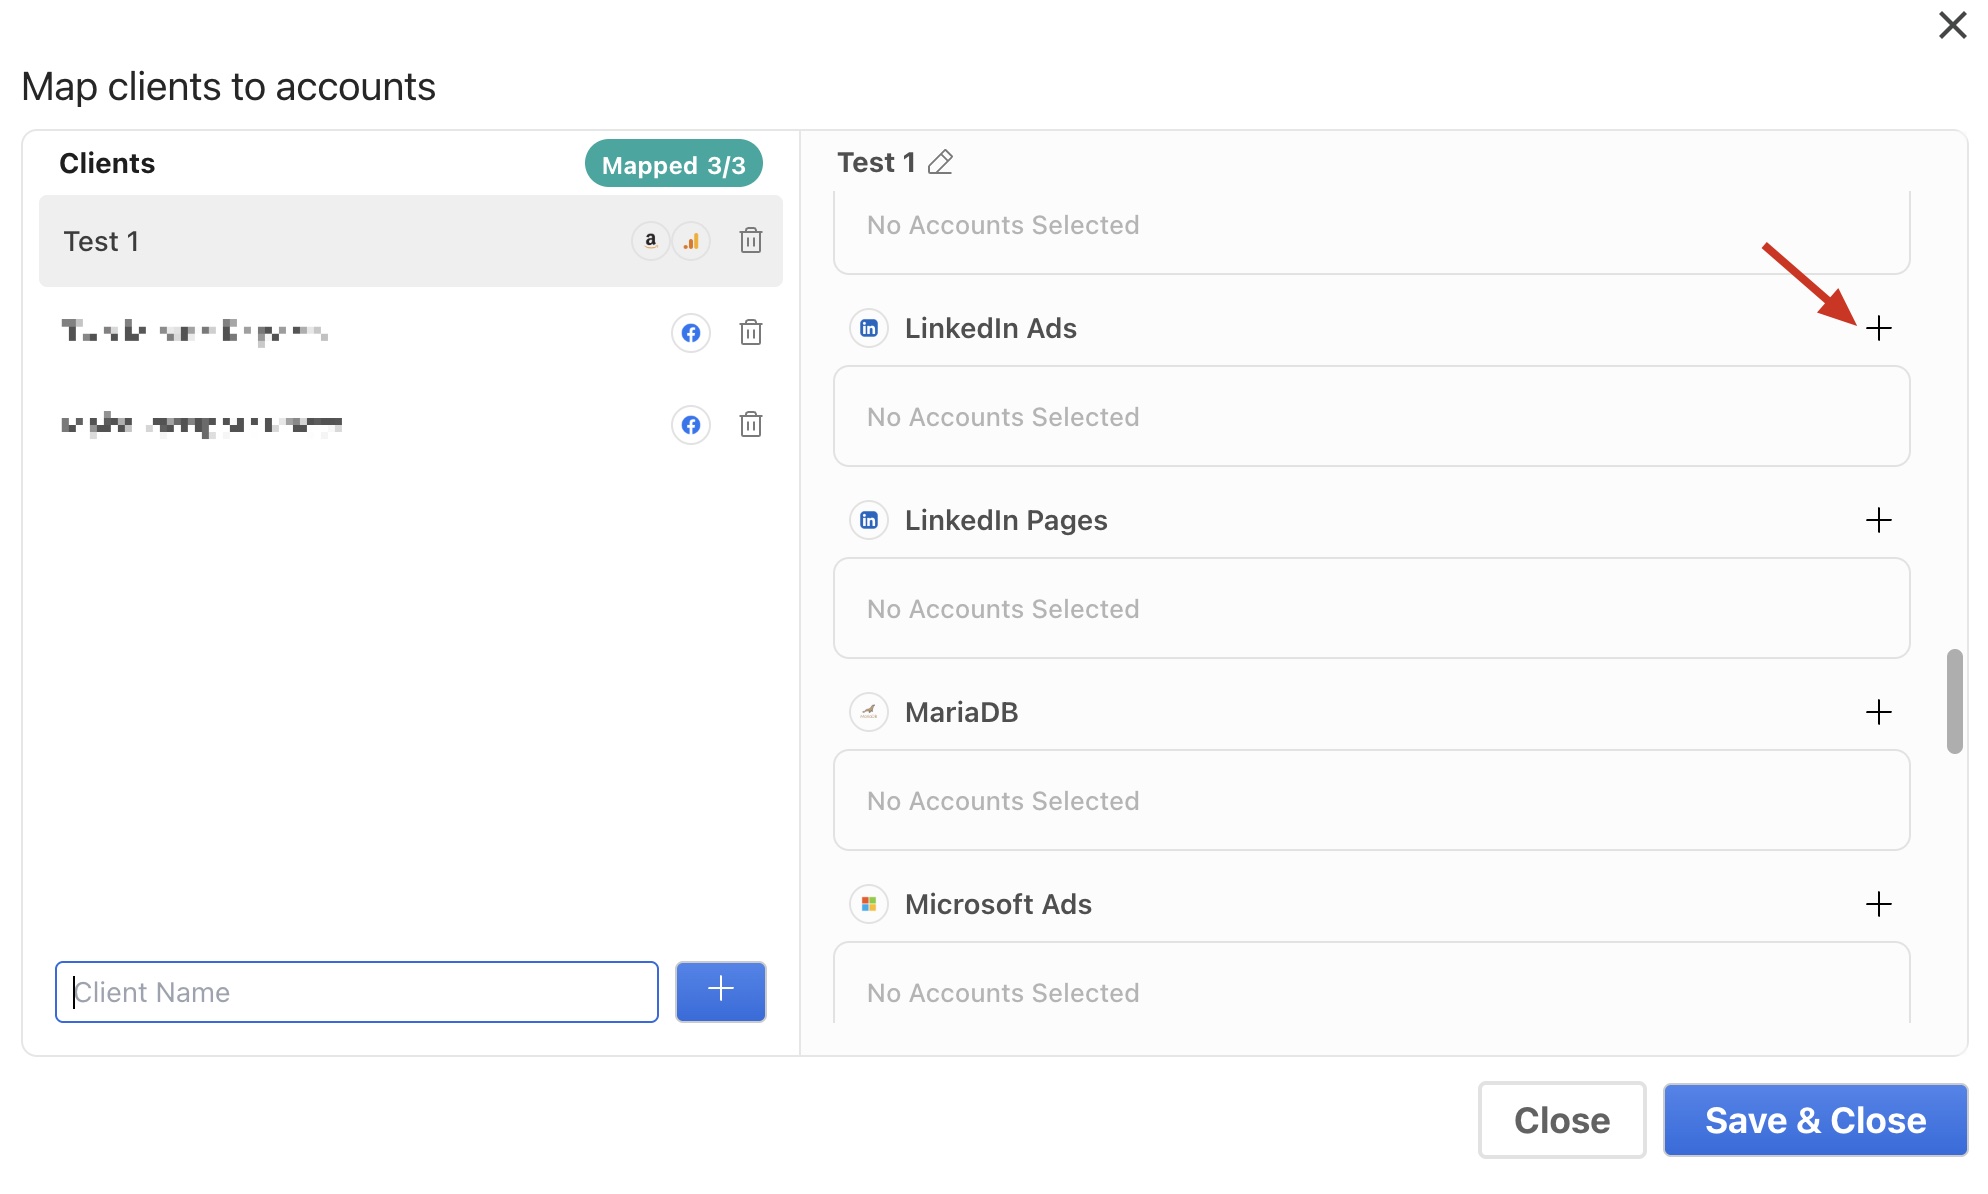
- Alternatively, you can navigate to the Clients section to add your client and map their corresponding LinkedIn Ads account.
- Click on “Manage Clients” and map the necessary account details, then click “Save & Close” to save your client’s details for future reference.
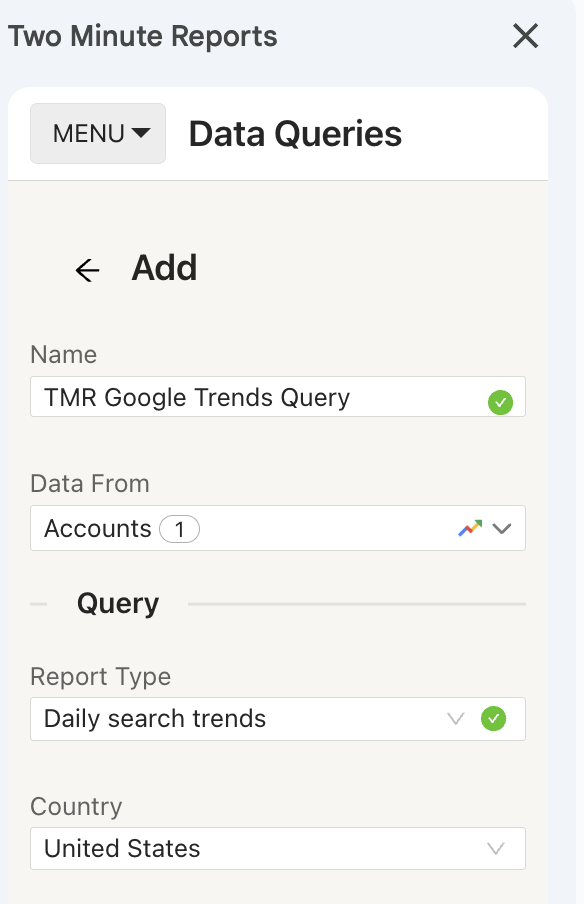
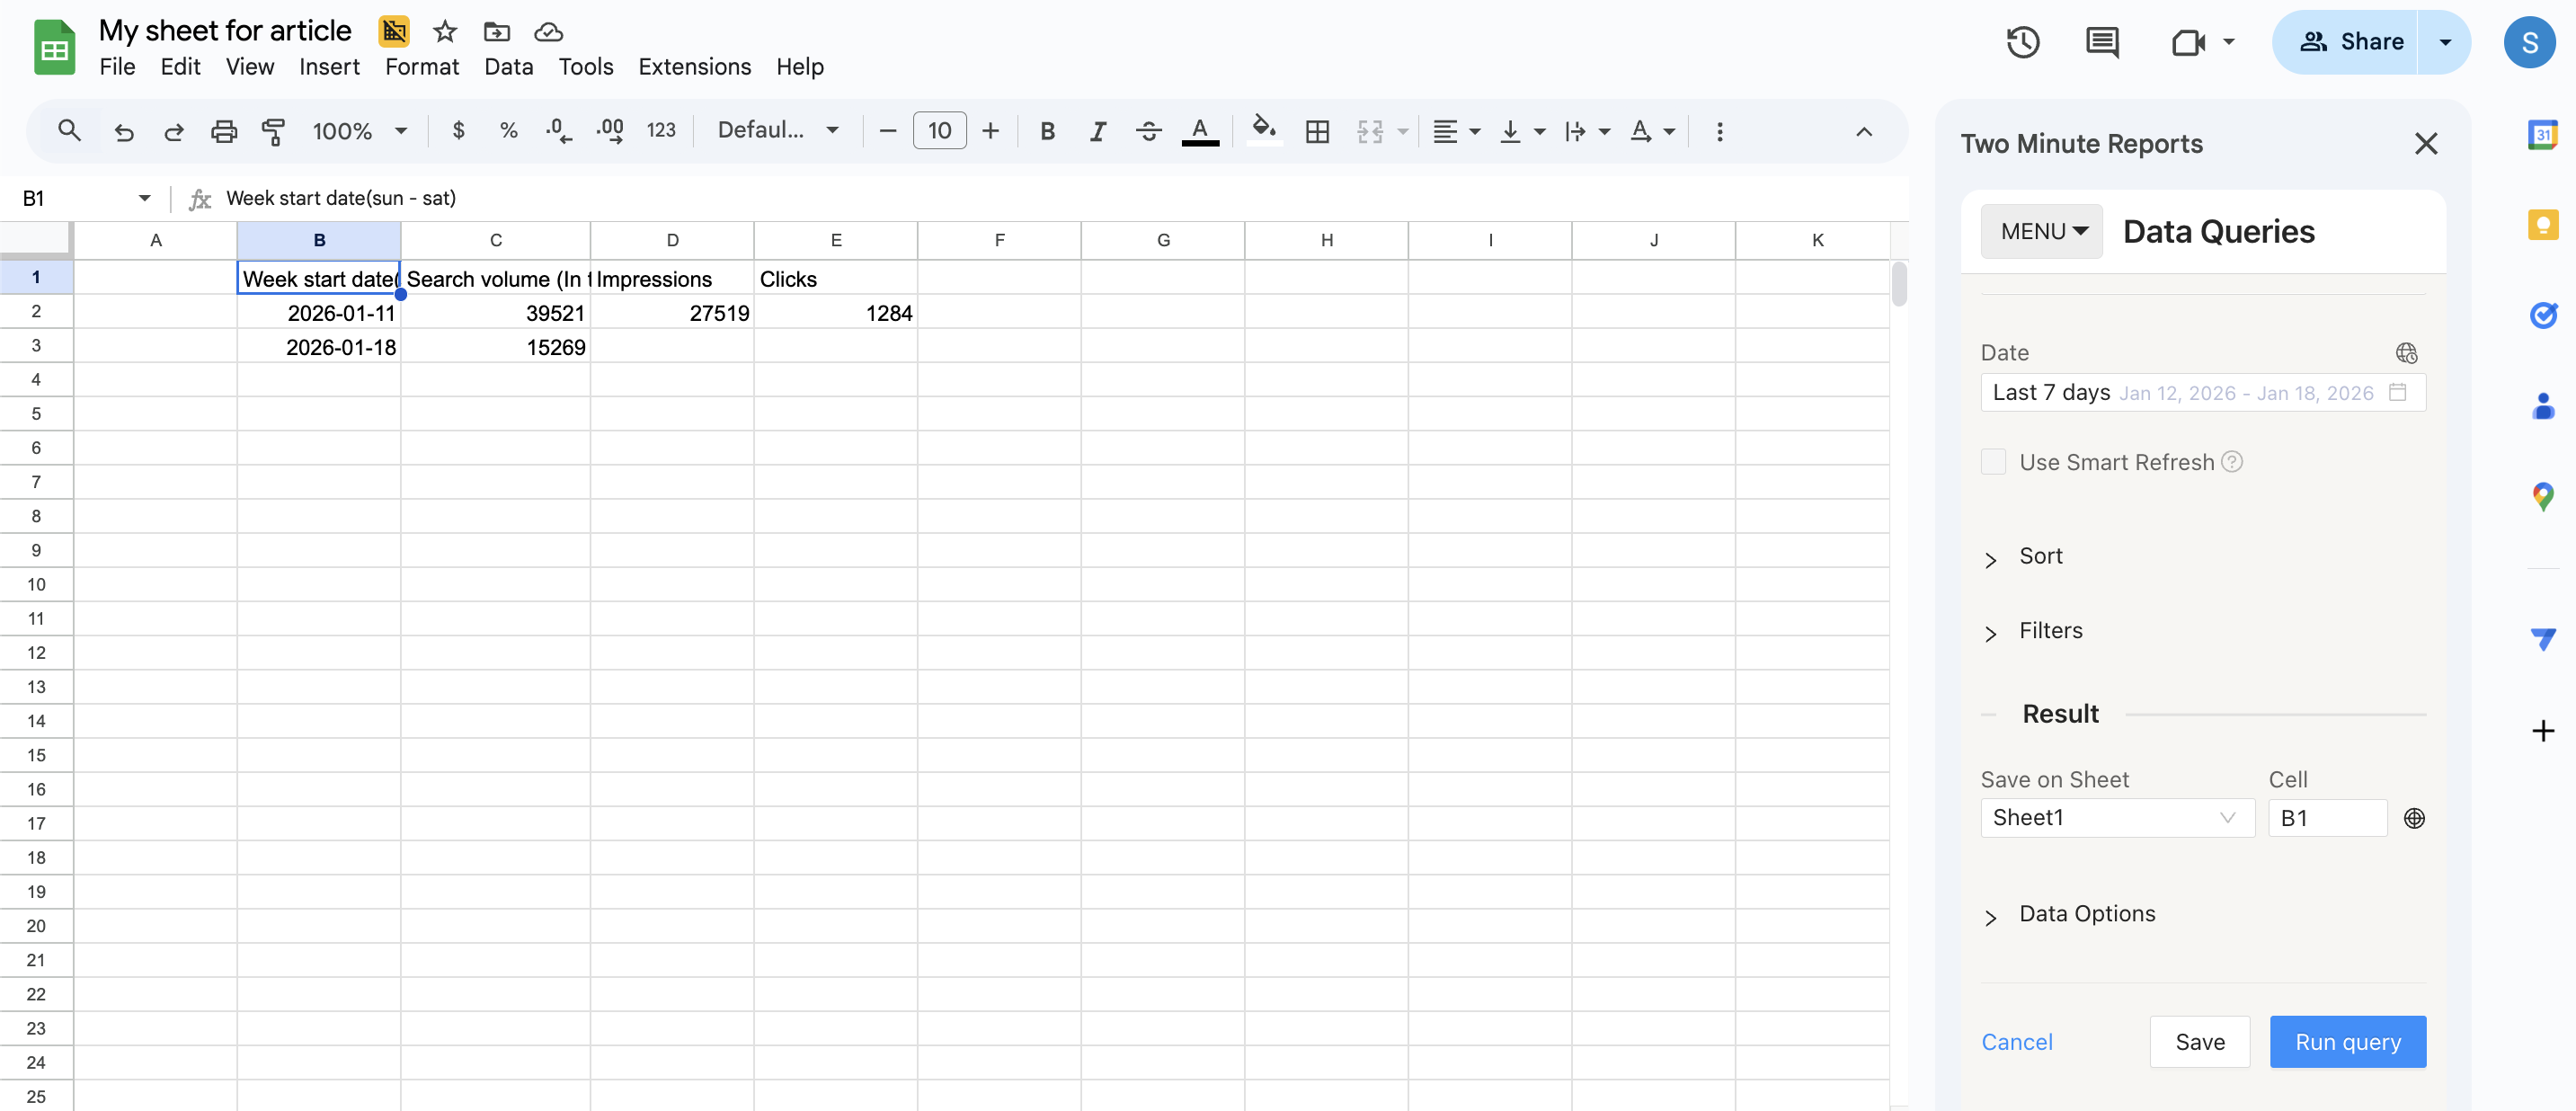
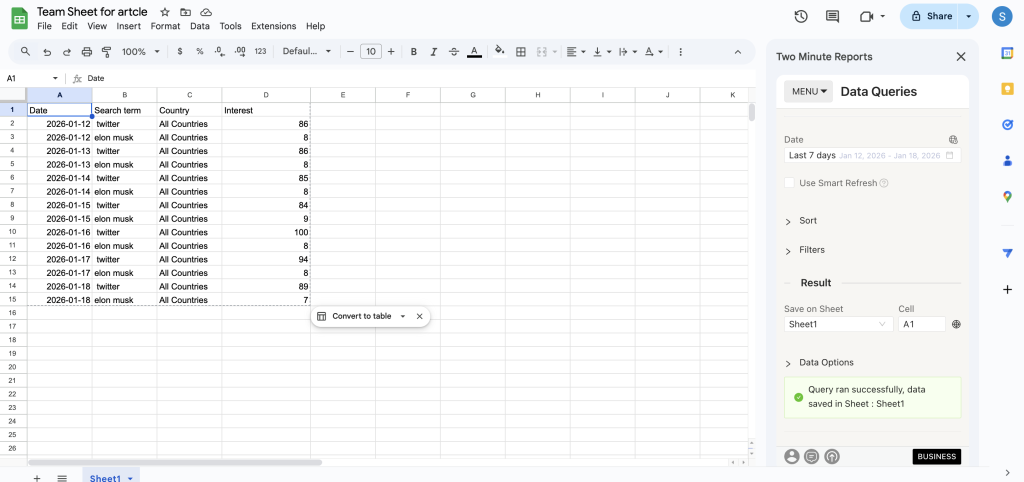
Daily search trends
Daily Search Trends shows search queries that experienced a significant spike in traffic across Google in the last 24 hours. The data refreshes hourly and includes both the exact search terms and the absolute number of searches for each trend.
Under Report Type, select Daily search trends.
Under Country, select the country you want data from.
Under Dimensions, select the the dimensions that segments the data.
Under Date, select the date range of the trends.
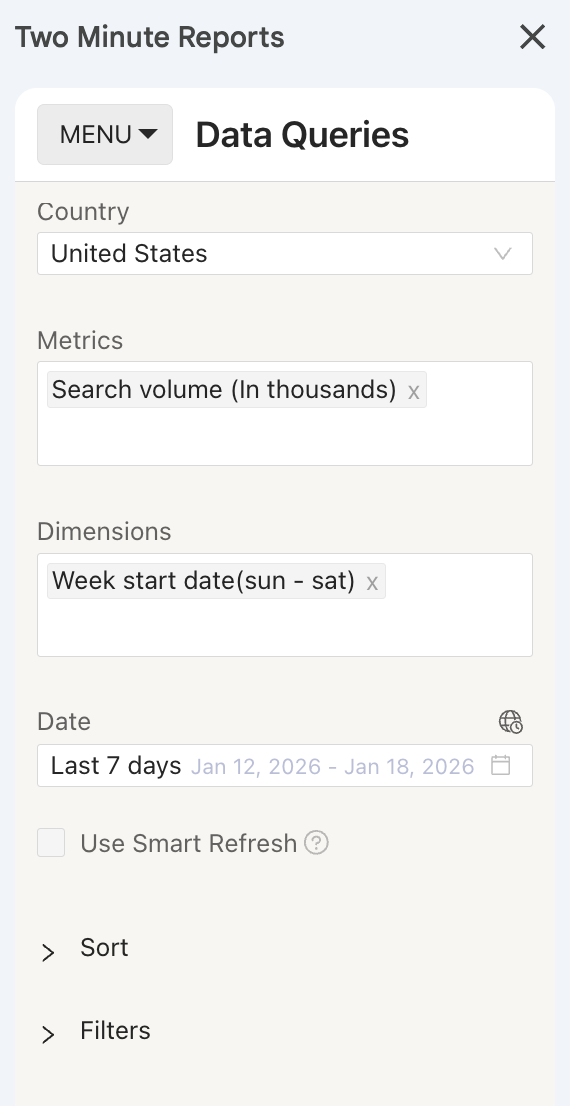
Configure your data reporting by selecting relevant fields and choosing whether to sort them in ascending or descending order. You can also apply custom filters to display only the information that matters.
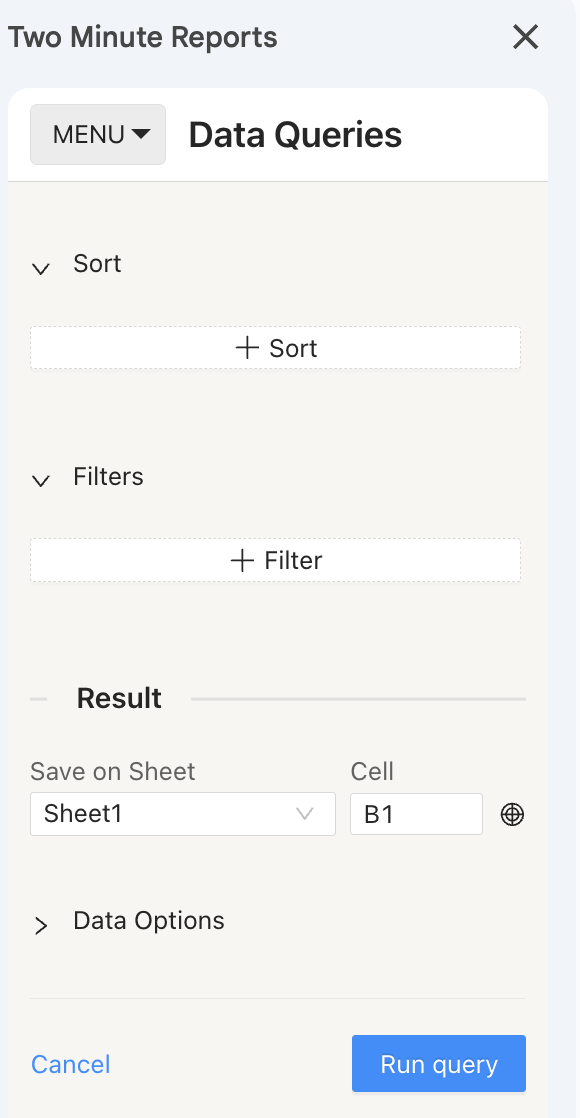
Click the blue Run Query button. You will now have the data on your Google Sheet.
Interests by time or region
Google Trends provides insights into search interest, including the Interest over time metric. This metric shows how popular a search term is relative to its highest point within a selected region and time range.
- A value of 100 represents the peak popularity of the term.
- A value of 50 indicates the term was half as popular compared to its peak.
- A value of 0 means there was insufficient data to measure interest for that term.
These values are indexed, not absolute search volumes, and are designed to show relative trends over time.
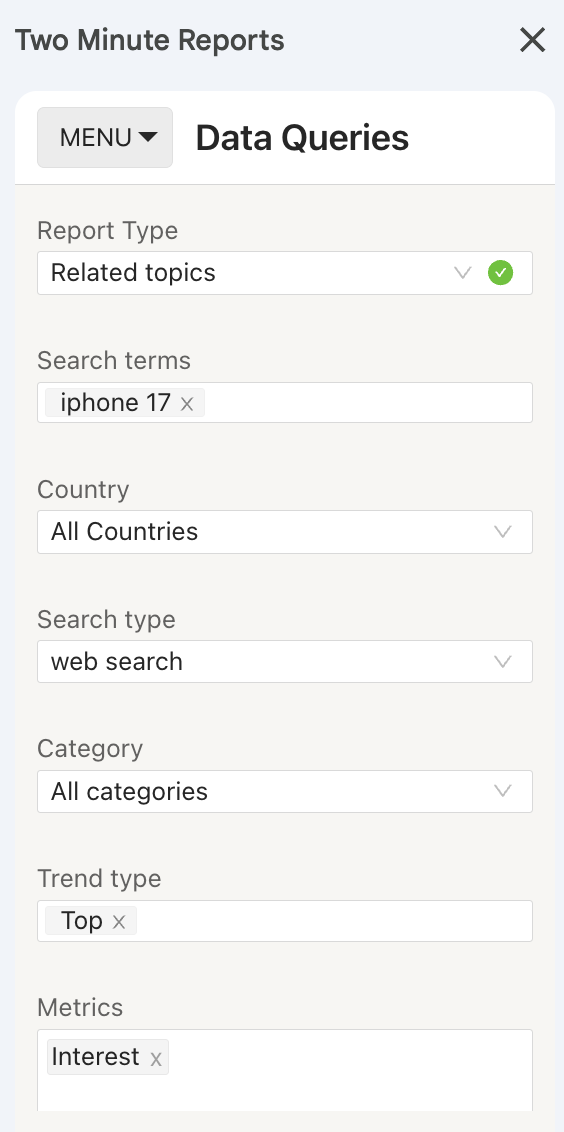
Under Report Type, select Interest over time.
Under Search terms, enter the search queries you want to get trends of.
Under Country, select the country you want data from.
Under Search type, select web search as this is the most used.
Under Category, select which category of that trend is coming from.
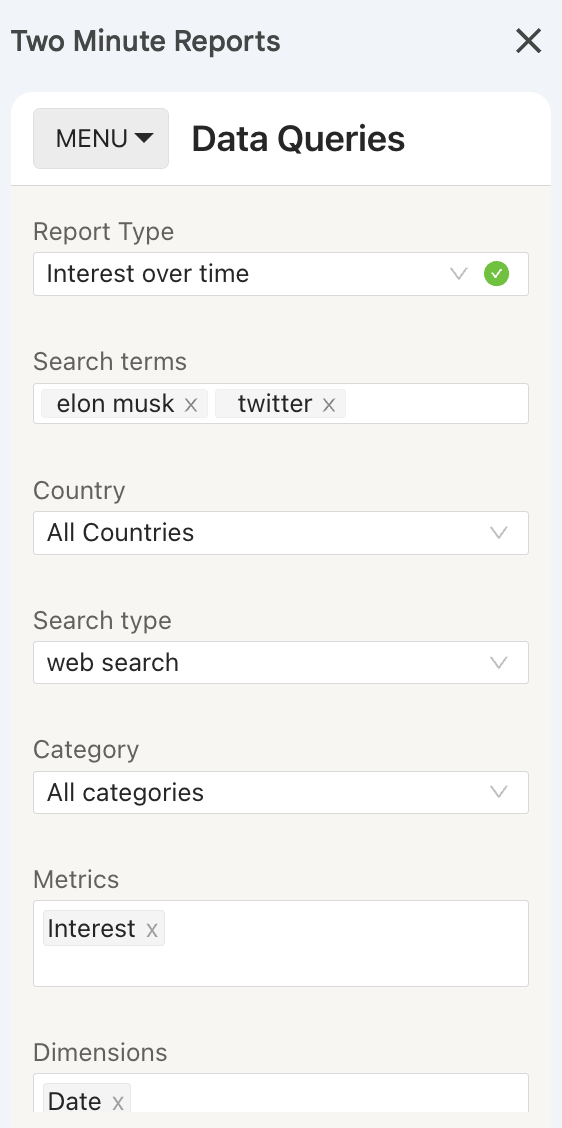
Further down, select the Metrics. Mostly this is interest.
Under Dimensions, select the the dimensions that segments the data.
Under Date, select the date range of the trends.
You may choose additional attributes Data Options. This is optional.
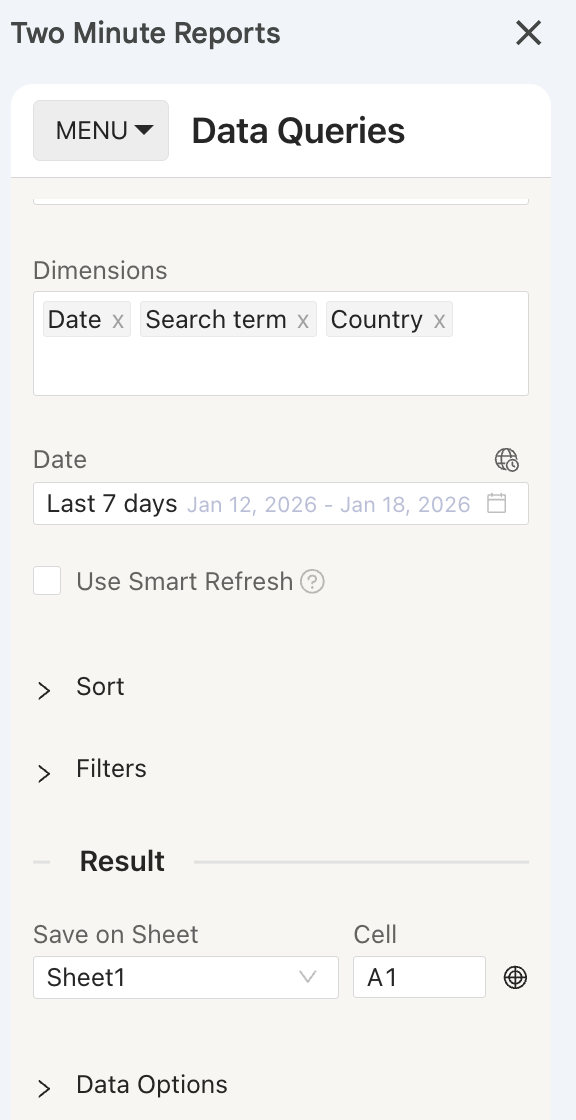
Click the blue Run Query button. You will now have the data on your Google Sheet.
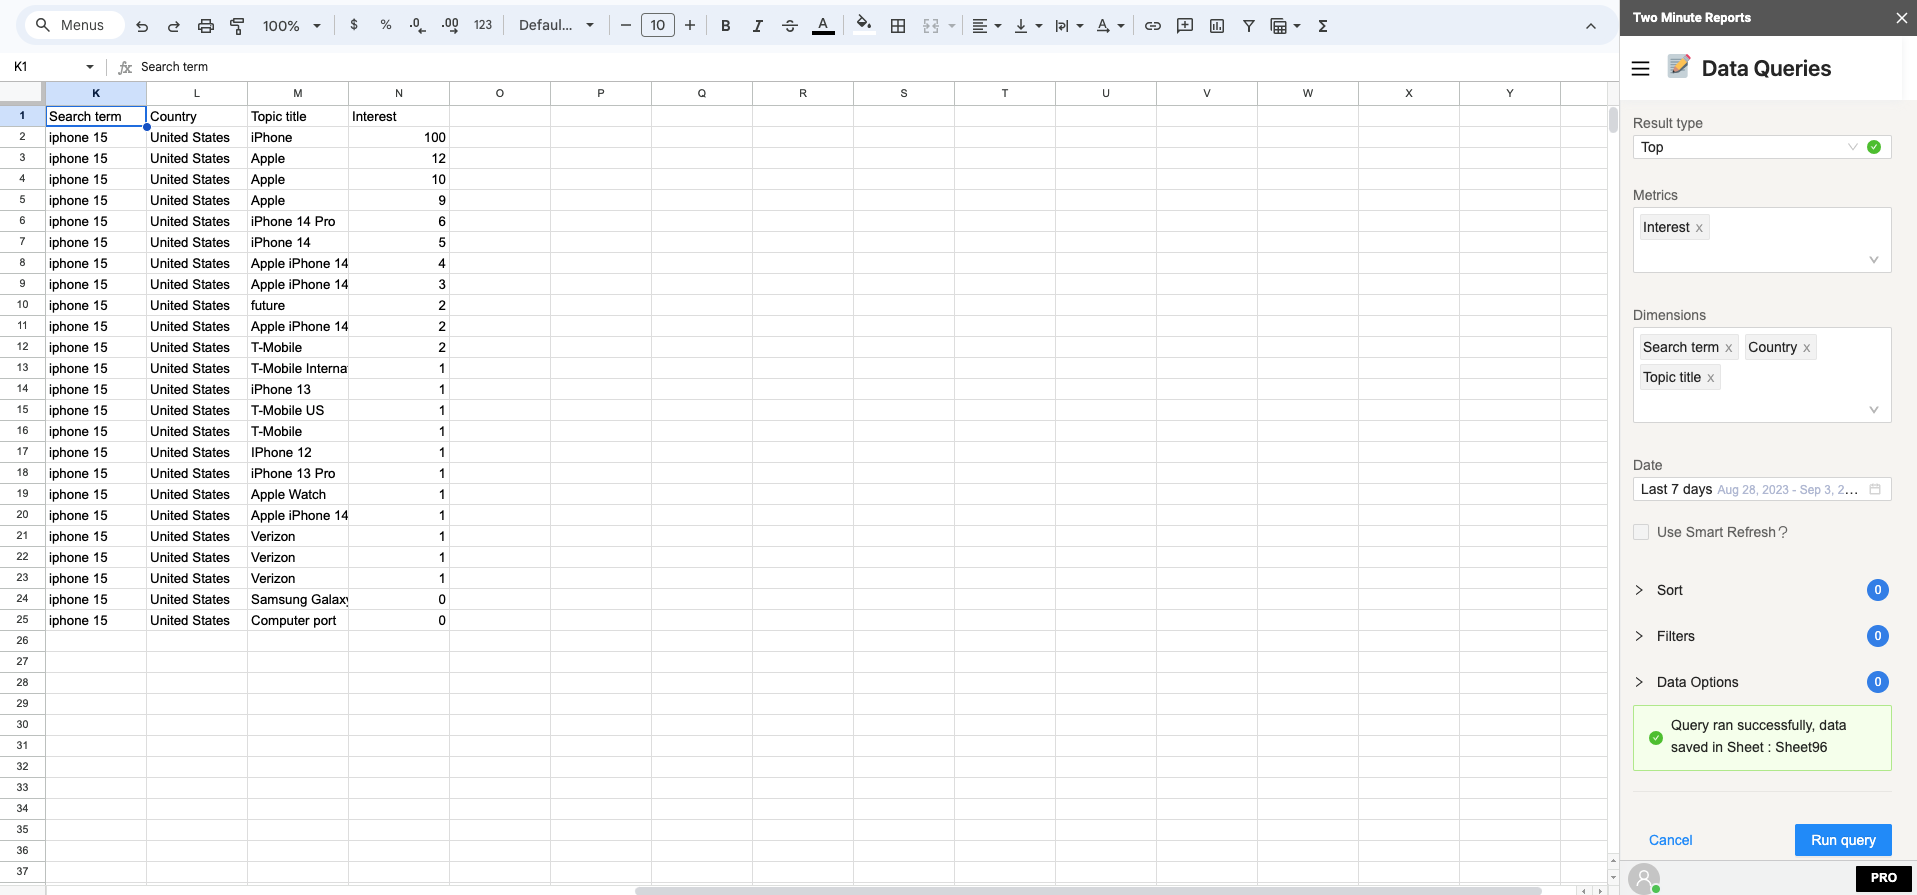
Related queries and related topics
Google Trends also provides data on Related Topics and Related Queries. These represent topics and search terms that users commonly search for in connection with your original query.
This data helps identify emerging interests, associated search behavior, and related areas of demand connected to the initial search term.
Under Report Type, select Related topics or Related queries.
Under Search terms, enter the search queries you want to get trends of.
Under Country, select the country you want data from.
Under Search type, select web search as this is the most used.
Under Category, select which category of that trend is coming from.
Under Result, select either Top or Rising.
Further down, select the Metrics. Mostly this is interest.
Under Dimensions, select the the dimensions that segments the data.
Under Date, select the date range of the trends.

Click the blue Run Query button. You will now have the data on your Google Sheet.
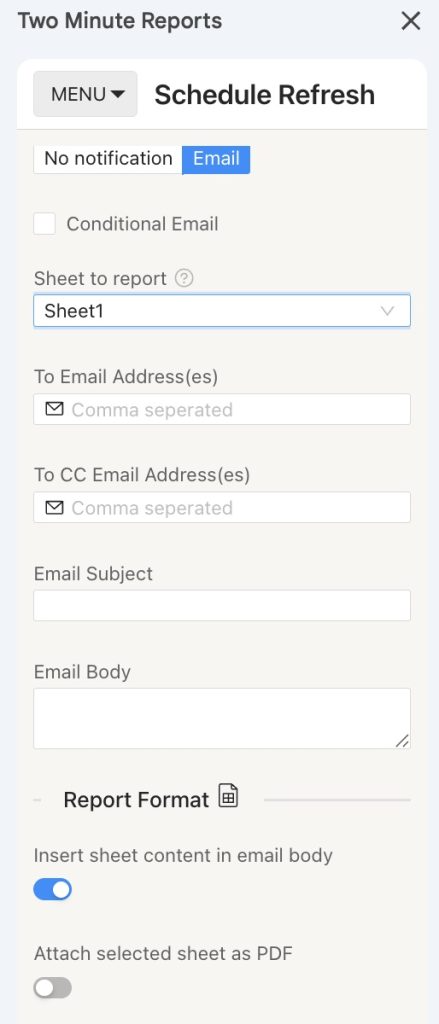
Once everything is done, you can make it refresh the latest data automatically by going to the Schedule Refresh section and adding a schedule.
Step 4: (Optional) Schedule Automatic data Refresh and email
Once you create a report in Google Sheets, you can schedule automatic updates to get real-time data. This feature is convenient for sending emails or refreshing your spreadsheets with live data and using them as a dashboard.
Under the email section, you can enter the recipient’s email ID and save the new schedule.
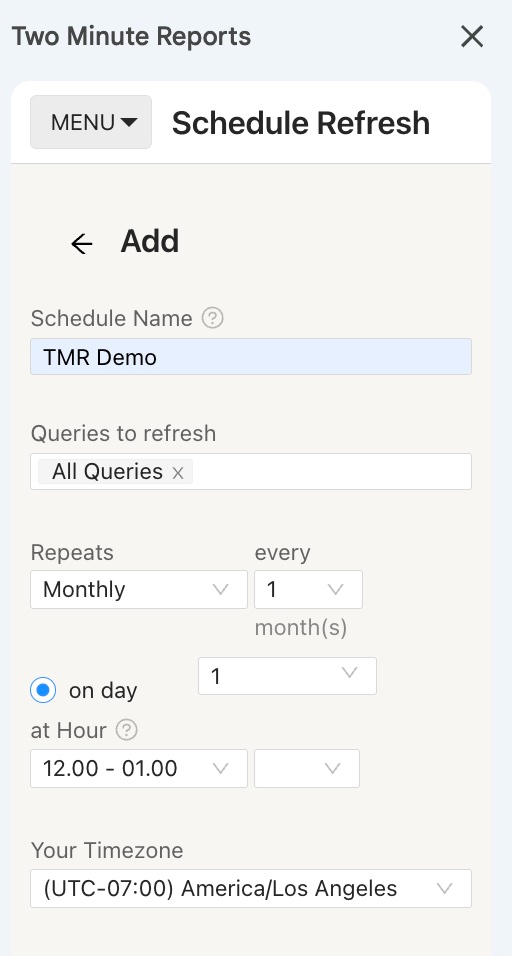
You can also choose to specify the reporting format. You can insert the sheet content in the email body, attach the selected sheet as a PDF or Excel, or attach the spreadsheet as an Excel file.
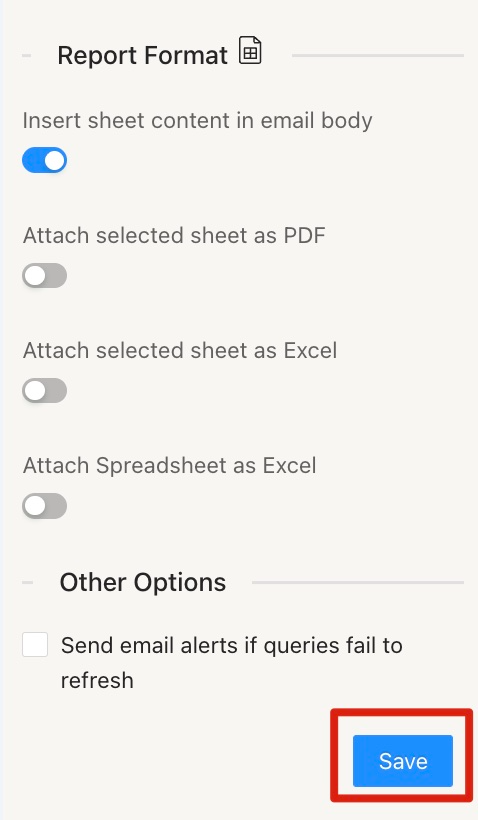
Two Minute Reports’ Schedule Refresh feature has further capabilities. Continue reading about this feature: “How to Refresh Data Automatically in Google Sheets.”
We hope you found this guide helpful. If you have any questions, please contact our support team at [email protected].