


Facebook Page Insights Performance Overview Report
About the template
This is a unique dashboard that compares the data of 2 quarters, with the ability for the user to dynamically change the months. This interactive dashboard includes important data such as Page fan adds, page reach, page paid reach, page impressions, page paid impressions, page performance, audience engagement and reactions for the page.
1) How much is my page growing: This section features an interactive scorecard that compares the page fan adds, page reach, page paid reach, page impressions and page paid impressions. It also includes dynamic charts.
2) Are the audience engaged: This section showcases dynamic charts for page performance and the audience engagement.
3) It also includes scorecard charts that compare different user reactions such as haha, like, love, wow, sorry, and anger.
More Social Media Templates for Looker Studio
View all- Most Popular

Instagram Insights Monitoring Report
Social MediaInfluencers, Agencies, brand marketers etc.. who post their informative and ...


Instagram Insights Dashboard
Social MediaThis is a single paged sophisticated Instagram Insights template, helps you ...

Instagram Ads Reporting Dashboard
Social MediaThis is a unique and interactive template on Instagram Ads. You get scorecards ...

Instagram Ads Performance Overview Report
Social MediaThis interactive dashboard provides an overview of data such as impressions, ...

Instagram Ads Overview Report
Social MediaThis is a unique and interactive template on Instagram Ads. You get Descriptive ...

Facebook Page Insights Report for Google Looker Studio: Free & Customizable
Social MediaYou can keep track of your Facebook insights with this detailed dashboard ...


Facebook Page Insights Performance Overview Report
Social MediaThis is a unique dashboard that compares the data of 2 quarters, with the ...

Facebook Insights Performance Dashboard
Social MediaThis is an interactive dashboard of Facebook insights, where you get the major ...

Facebook Insights Monitoring Report
Social MediaInfluencers, Agencies, brand marketers etc.. who post their informative and ...

LinkedIn Pages Overall Performance Report
Social MediaHey! You need not waste anymore of your time, manually checking your LinkedIn ...

Report Categories


More Google Sheets Templates
View all- Most Popular

Monitor Leads Performance for Multiple Accounts
Advertising (PPC)Lead Ads need to be constantly monitored to keep their cost in check. ...


- Most Popular

Facebook Ads Eight Weeks Performance Analysis
Advertising (PPC)This interactive dashboard template facilitates easy comparison of your ...
- Most Popular

Google Ads - Monthly Performance Analysis
Advertising (PPC)This template provides a detailed comparison of metrics including clicks, ...

- Most Popular

Shopify Dashboard with Traffic and Sales report
E-CommerceThis is a unique dashboard which infers data for 30 days, where the data can be ...

- Most Popular

Google Analytics 4 - Audience Demographic Insights
Web AnalyticsCheck out our Google Analytics 4 Template specially created for Audience ...

- Most Popular

Amazon Ads Performance Report
Advertising (PPC)Obtain all of your performance indicators for Amazon Ads in a single report, ...


Website Purchases Heatmap
Advertising (PPC)This template helps analyse the profitable times of the day and day of the ...

Website Purchases Report
Advertising (PPC)Use this template to track your Website Purchases campaign for a single ...

GA4 - Acquisition Overview Report
Web AnalyticsCheck out our GA4 template specially created for Acquisition Overview. In this ...

TikTok Ads - Monthly Overview Report
Advertising (PPC)This template is an interactive dashboard that provides an overview of various ...

More Google Looker Studio Templates
View all- New

X (Twitter) Ads Report
Advertising (PPC)Check out our X (Twitter) Ads Performance Template designed to help marketers ...

- Most Popular

Facebook Ads vs Google Ads vs LinkedIn Ads Dashboard
Advertising (PPC)This is a multi data source dashboard, which gets all the main KPI's of ...
- Most Popular
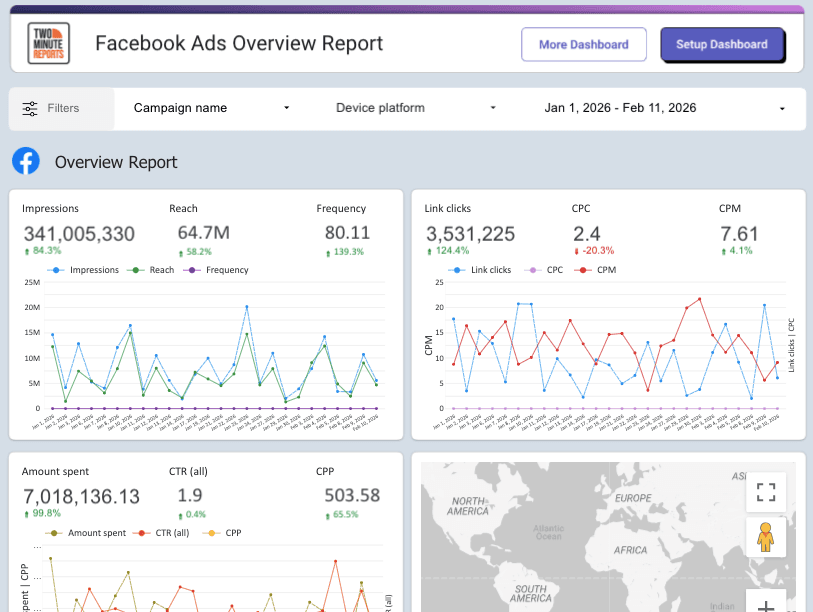
Facebook Ads Overview Report
Advertising (PPC)This interactive dashboard provides an overview of data such as impressions, ...
- Most Popular
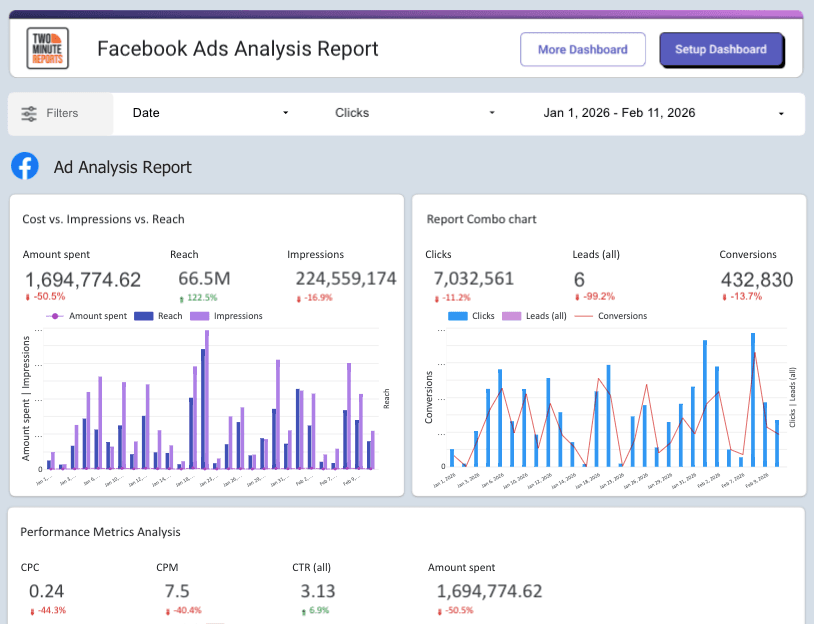
Facebook Ads Overview and Ad Analysis Report
Advertising (PPC)This template provides a comprehensive overview of the performance of Facebook ...
- Most Popular
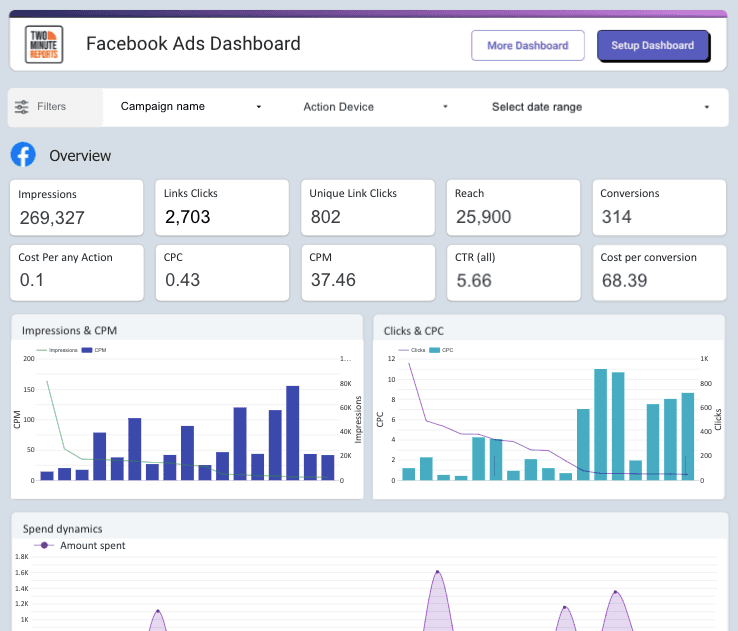
Facebook Ads Dashboard
Advertising (PPC)This is a fully loaded Facebook Ads Template which can get you almost all the ...
- Most Popular

Facebook Ads Campaign Performance Dashboard
Advertising (PPC)This is an amazing template for the modern audience, to get an overview of ...
- Most Popular

Google Analytics 4 Overview Report
Web AnalyticsThis is an interactive Google Analytics template designed to analyze user ...

Facebook Ads Performance KPIs Report
Advertising (PPC)This interactive dashboard helps you keep track of your Facebook Ads click ...

Facebook Ads Lead generation report by - lead gen performance,platform breakdown & position, demographics and region
Advertising (PPC)This interactive dashboard utilizes the Lead standard conversion from Facebook ...
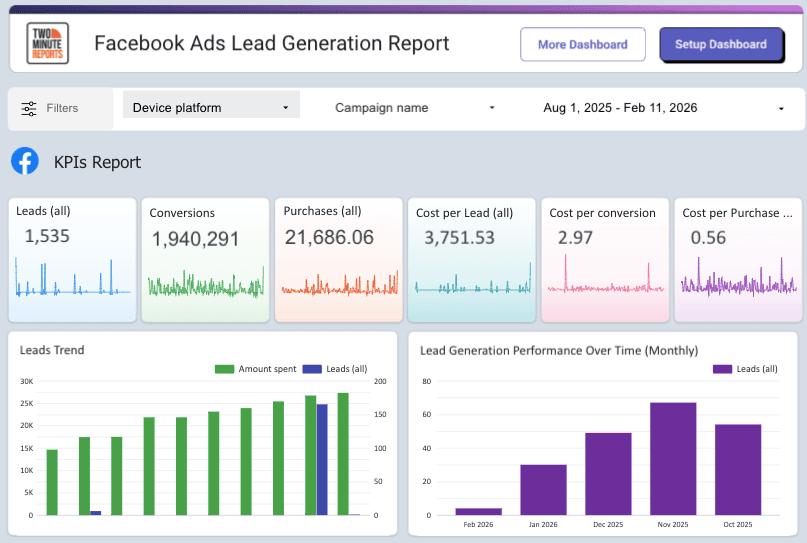
Facebook Ads Lead Generation Report
Advertising (PPC)This interactive dashboard on Looker Studio will assist you in tracking your ...
Take back your time. Wow clients.
Get Two Minute Reports.
Start your free trial todayBuilt by marketers. Built for marketers.