Data, Dates & Filters
A dashboard is only as useful as the data behind it. The control bar lets you choose which accounts feed the dashboard, what date range it covers, and which filters apply, either for the whole dashboard or for an individual page.
What You Can Do
- Choose the default data source accounts for the dashboard
- Set a date range using presets or a custom range
- Compare any period against the previous period or last year
- Apply filters that narrow every widget at once
- Override the date range and filters for an individual page
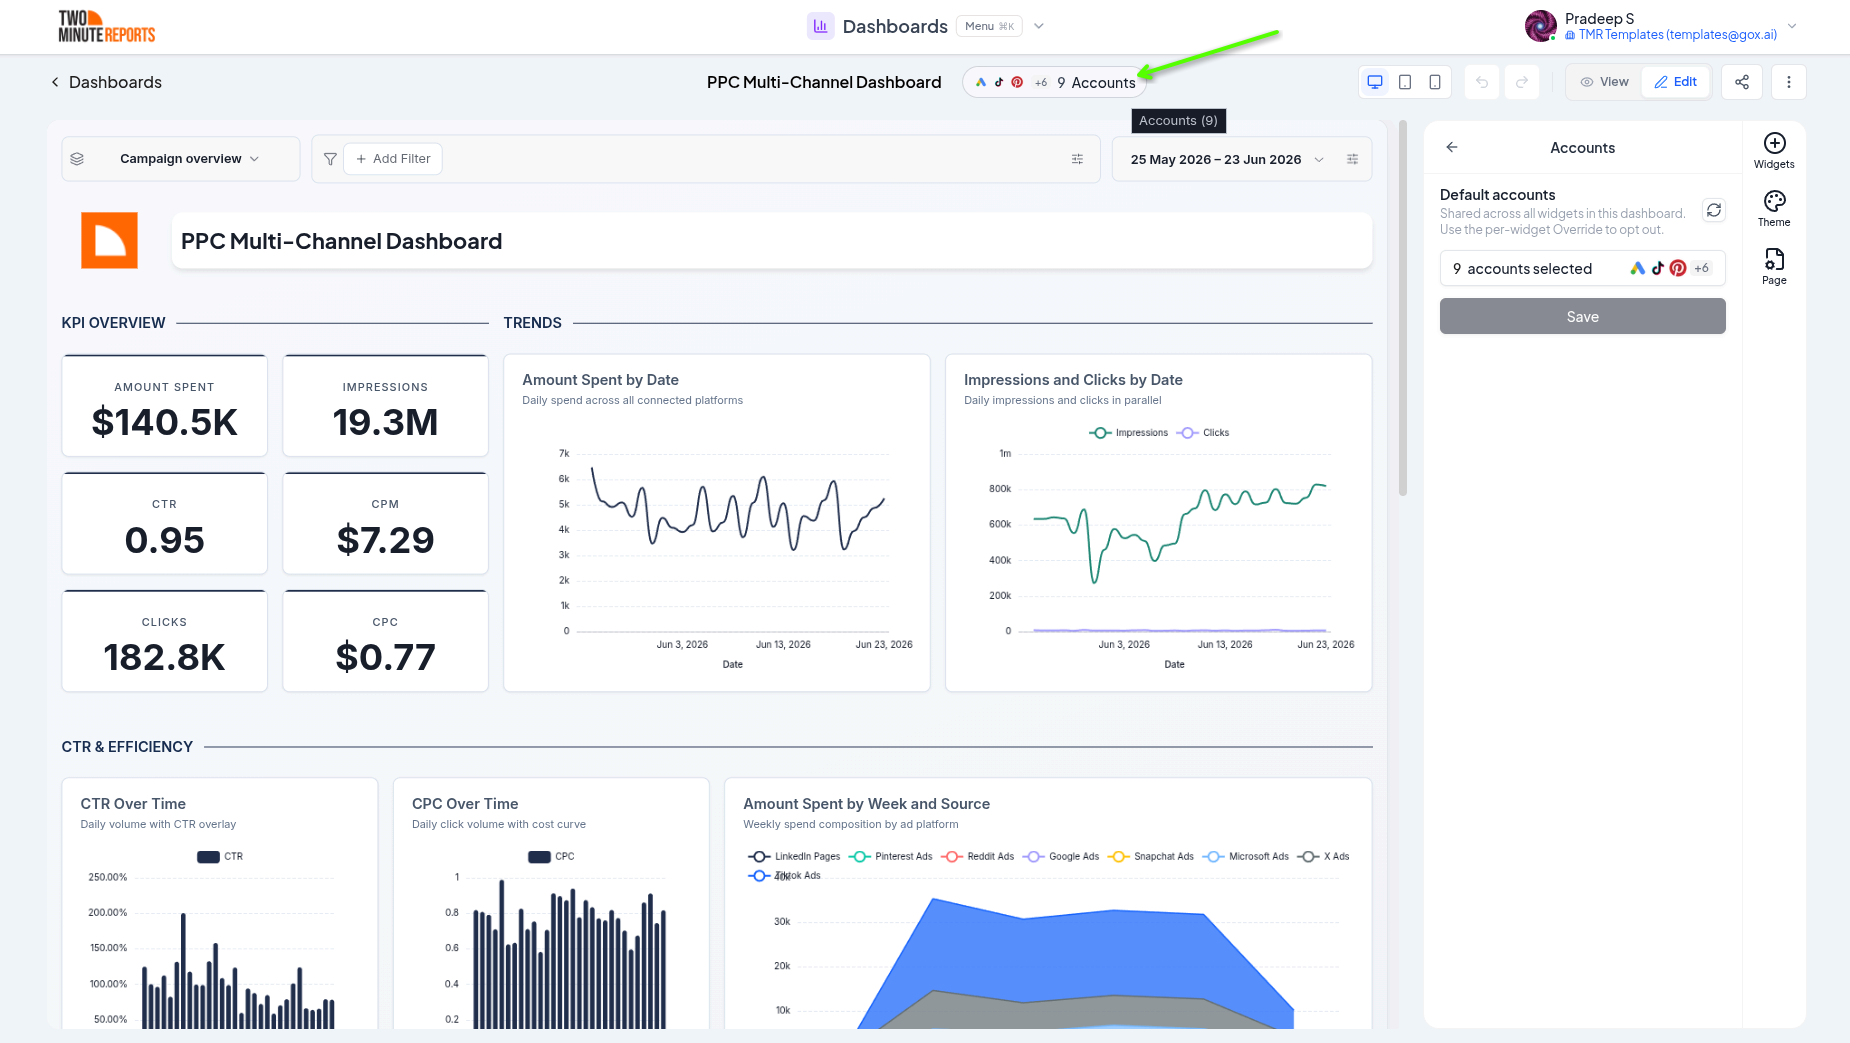
Accounts
The control bar lets you pick the default accounts the dashboard pulls from. Every widget uses these accounts unless you override them on the widget itself (see Widgets & charts).
Date Range
The date picker sets the period every widget reports on.
- Presets - common ranges like last 7, 30, or 90 days, last month, or year-to-date
- Custom range - pick exact start and end dates
- Include today - choose whether the current, still-incomplete day is included
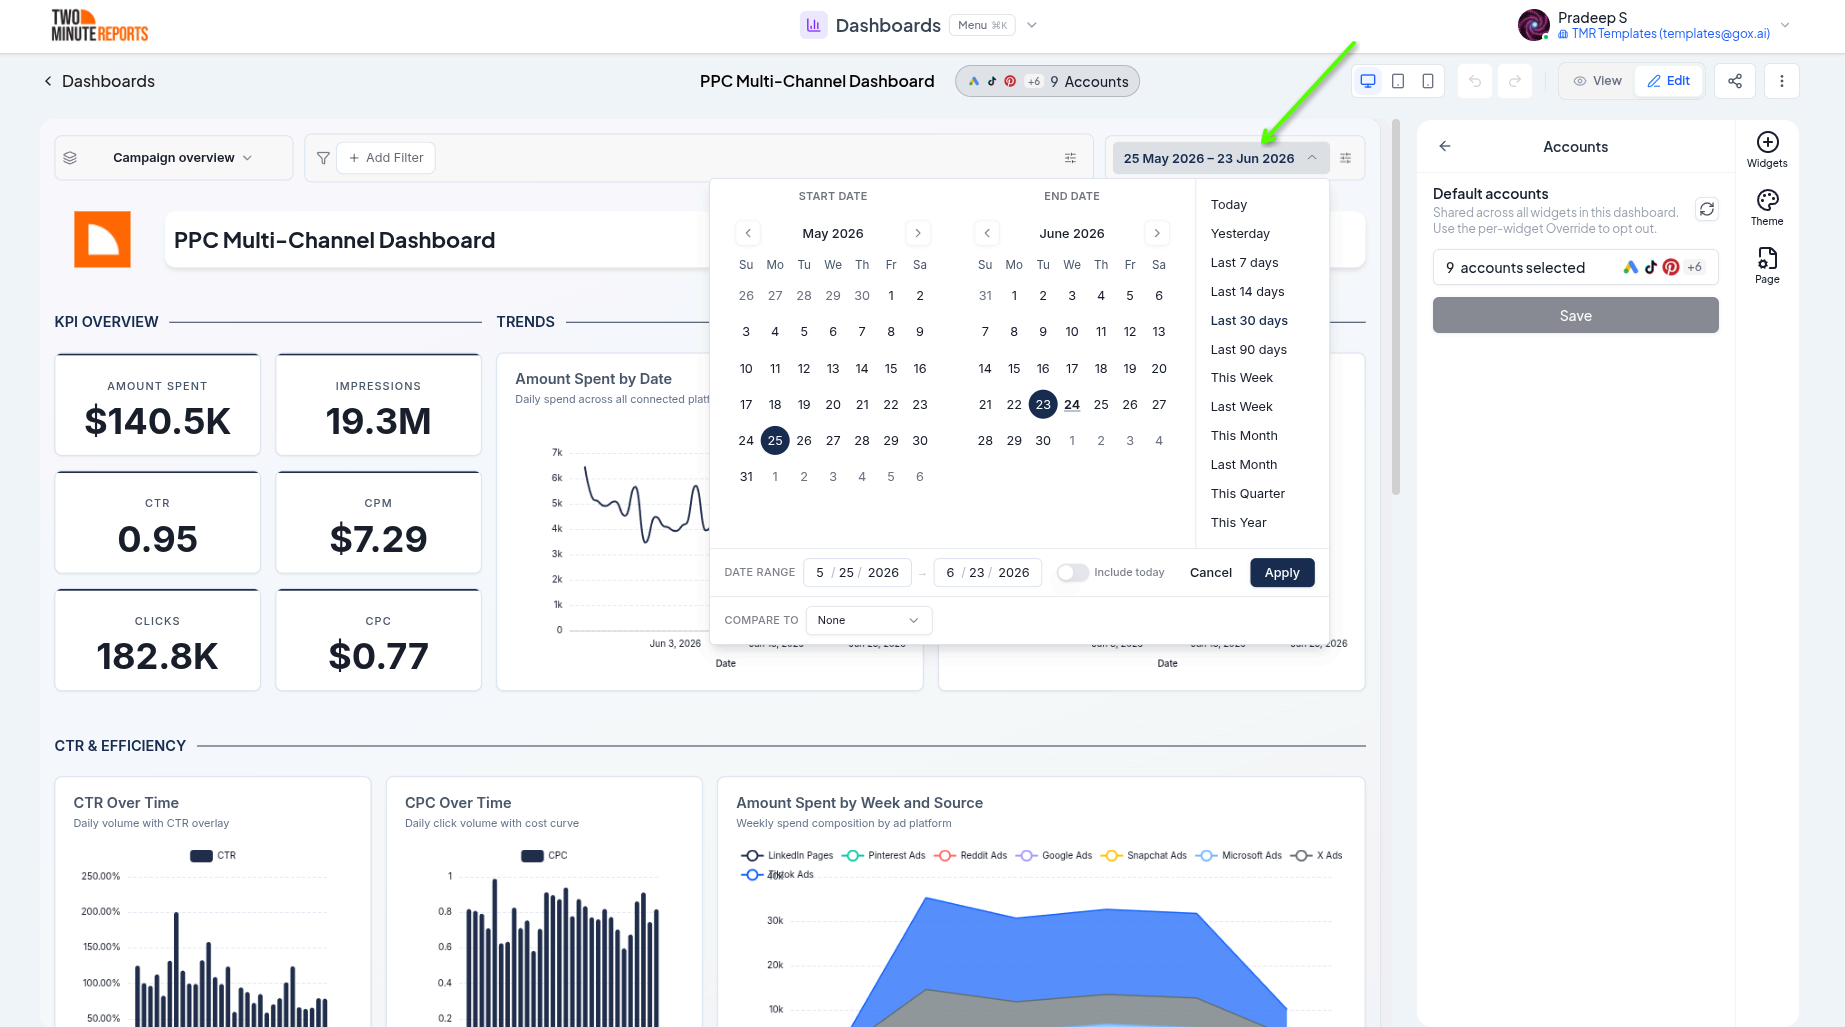
Compare Periods
Turn on comparison to measure change over time. Choose what to compare against:
- Previous period - the period immediately before the current one
- Same period last year - the equivalent dates a year ago
- Custom - any period you choose
When comparison is on, supported widgets show the change as a delta. Each widget decides whether to display the comparison and whether to show it as a percentage or an absolute difference, configured in the widget editor.
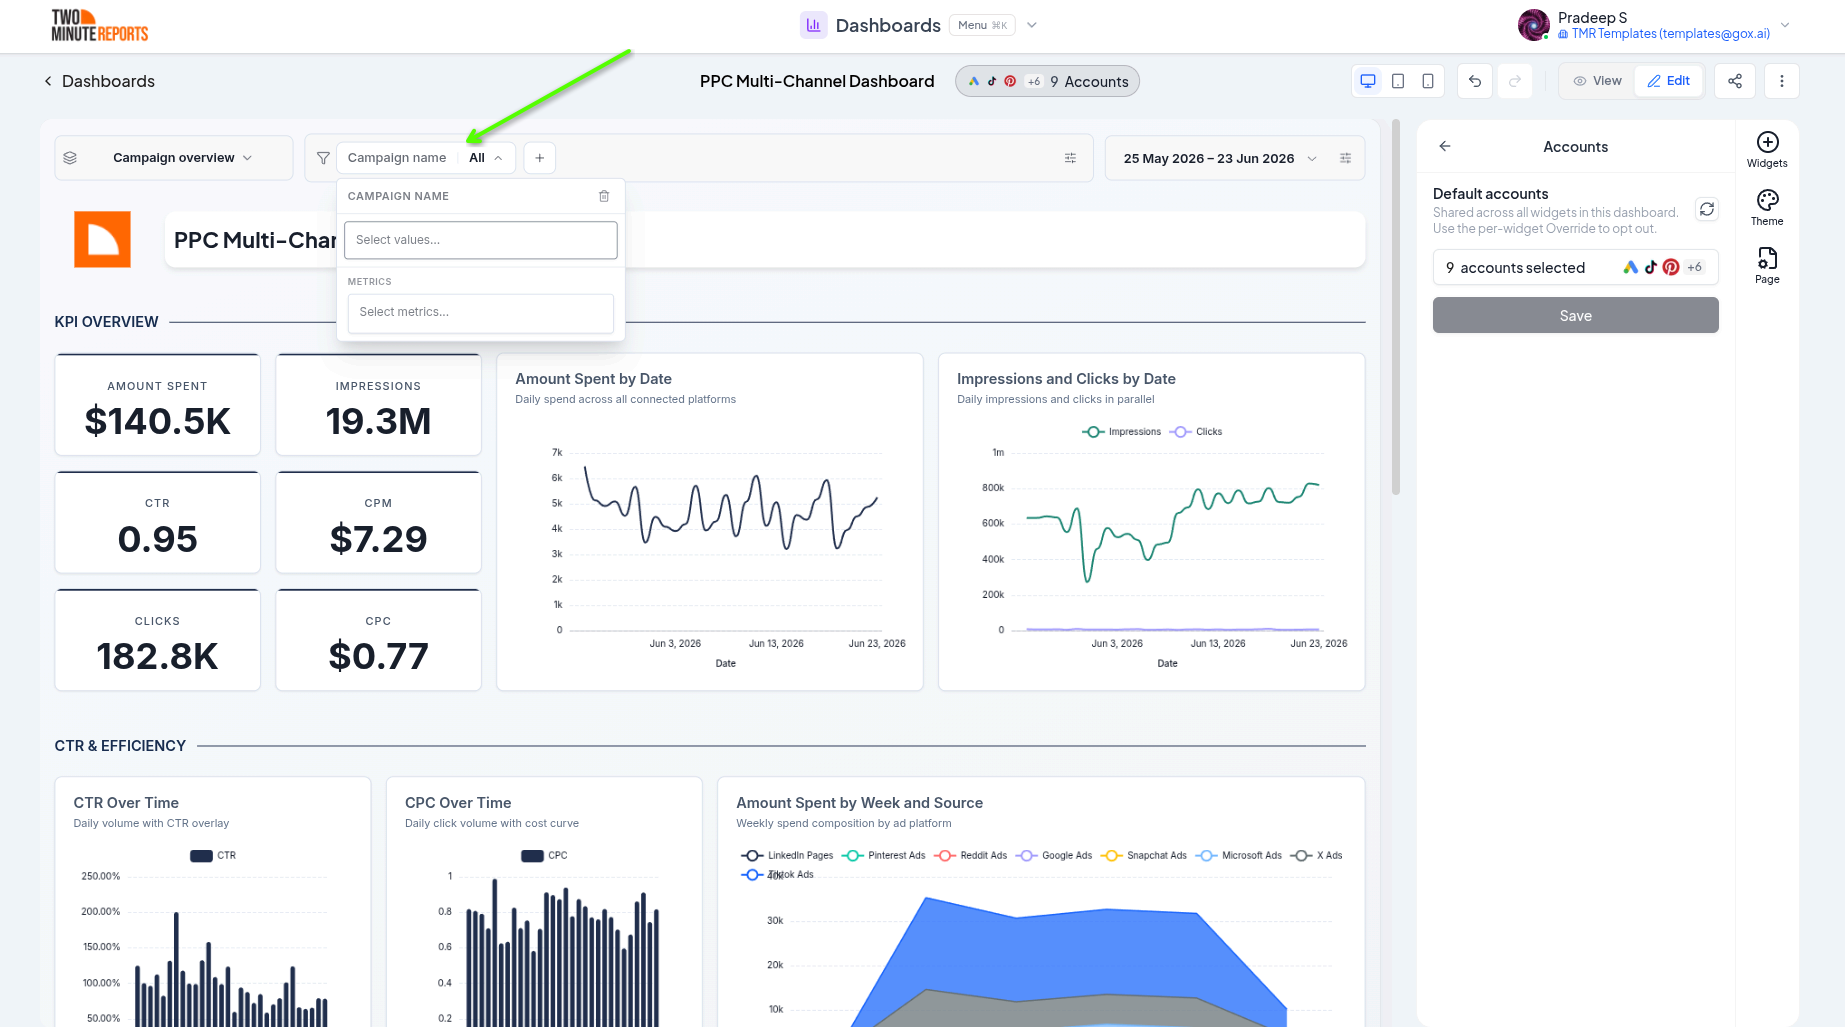
Filters
Dashboard filters narrow the data across every widget at once. Add a filter by choosing a field and the values to include, for example only "Brand" campaigns or a specific country. Filters appear as chips in the control bar, and you can add or remove them at any time.
Dashboard-Wide vs Per-Page Controls
By default the date range and filters apply to the whole dashboard. You can also scope them to a single page, so one tab can show a different period or a different filter set than the rest of the dashboard.
Use the scope selector on a control to choose whether your change affects the entire dashboard or just the current page. A page-level override takes precedence over the dashboard defaults for that page only.
How Data Refreshes
Dashboards read from the same connected data as your reports, so widgets reflect the latest available data each time they load. There's no manual export step, open the dashboard and the numbers are current. If a data source can't return data (for example a disconnected account), the affected widget shows an error state with a retry option while the rest of the dashboard continues to work.
Best Practices
- Set the dashboard's default accounts and date range before adding widgets
- Use presets rather than custom dates for dashboards you'll keep over time, so they roll forward automatically
- Reach for per-page overrides sparingly; they're powerful but can confuse viewers if overused
Next Steps
- Widgets & charts - Per-widget accounts, filters, and compare display
- Sharing & exporting - Let viewers change dates and filters on a shared link
- Browse Connectors - Connect more data sources
Layout & Pages
Organize a dashboard across multiple pages and arrange widgets on a responsive drag-and-drop grid, with resizing, auto-align, undo/redo, and view and edit modes.
Theming
Style dashboards with custom themes, backgrounds, typography, colors, and per-widget overrides, and save themes to reuse across dashboards.