

Blending across connectors
Every platform names its fields differently: "amount spent" on one, "cost" on another. The Blending method lets you map the equivalent field from each of your connectors into a single unified custom field. A cross-platform chart or goal can then use one field.
What you can do
- Combine one field per connector into a single unified field
- Build unified metrics like total Spend, Impressions, or Clicks across platforms
- Build unified dimensions like a single Campaign name, Ad group, or Country column
- Give each connector its own field or its own formula
How blending works
When you choose Blending, you select the connectors to include. Then you tell the field which field to use for each connector.
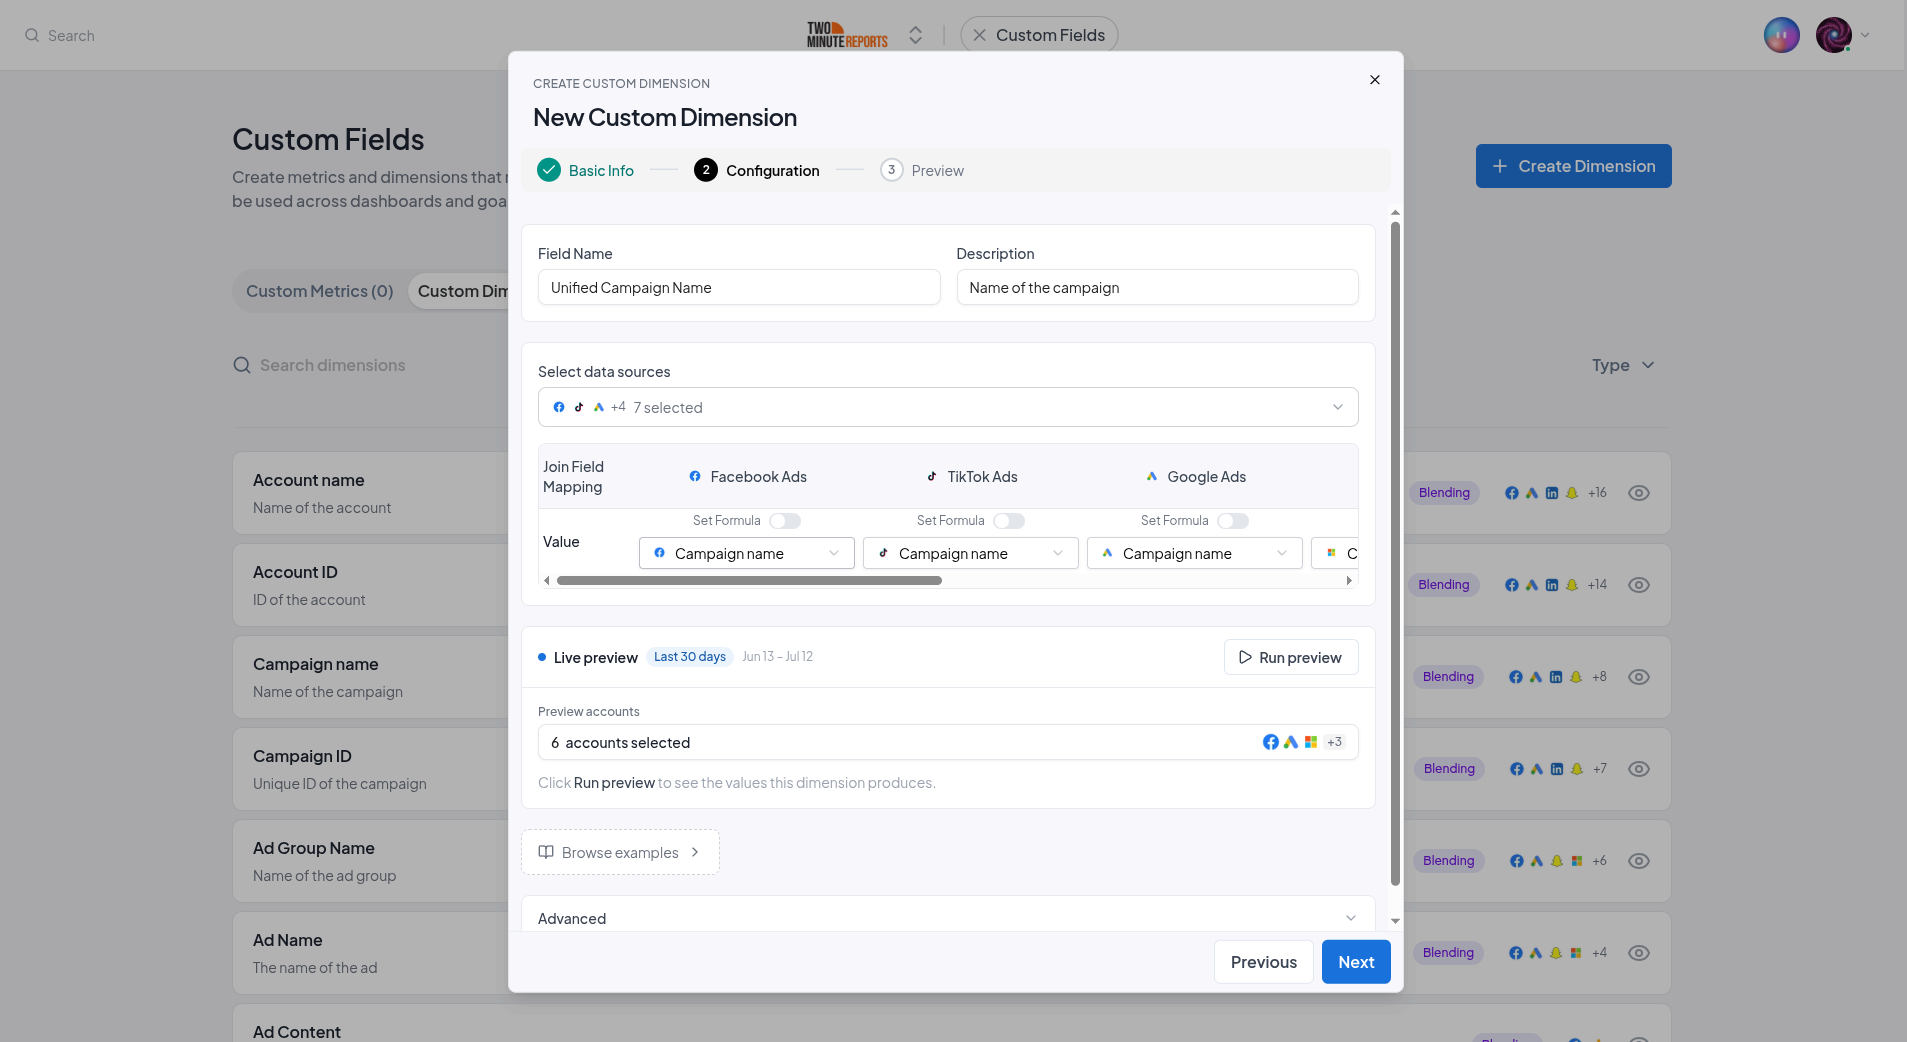
For each selected connector, you can map either:
- A single field - pick the equivalent field from that connector, or
- A formula - turn on Set formula to build a calculation for that connector (and even add conditional rules for it)
Metrics are summed
For a custom metric, the values from each connector are added together into one total. Mapping "amount spent" from Meta, "cost" from Google, and "spend" from TikTok gives you a single blended Spend metric across all three.
Dimensions are unified
For a custom dimension, each connector's mapped field flows into one unified column. Mapping each platform's campaign-name field produces a single "Campaign name" dimension you can group by, whichever platform a row came from.
Set it up
Choose the method
In the builder, select Blending. Then select Next.
Select your connectors
Under Select connectors, choose the connectors this field should span.
Map each connector
For every selected connector, map the field (or build a formula) that represents this value on that platform. Each selected connector must be mapped before you can save.
Preview and save
Use the live preview to confirm the blended values look right, then save.
Next steps
- Formulas and conditions - Add per-connector calculations and rules
- Split text - Extract fragments from a naming convention
- Use custom fields - Use blended fields in dashboards and goals
Formulas and conditions
Build custom metrics with math operators and custom dimensions by combining fields and text, then add conditional rules to return values only when conditions match.
Split text
Split a dimension value by a delimiter and extract a specific fragment, ideal for pulling region, channel, or strategy out of a campaign naming convention.