Data Options
Data Options let you control how query results are written to your spreadsheet and how metrics are calculated. Access them from the Data Options section at the bottom of any query in the TMR sidebar.
Merge new data with old
By default, running a query overwrites the data in your sheet. Append new data adds rows at the end, but re-running the same query repeatedly creates duplicates.
Merge new data with old solves this: existing rows are updated in place with the latest values, and only genuinely new records are appended — so your sheet stays clean with no duplicates.
How it works
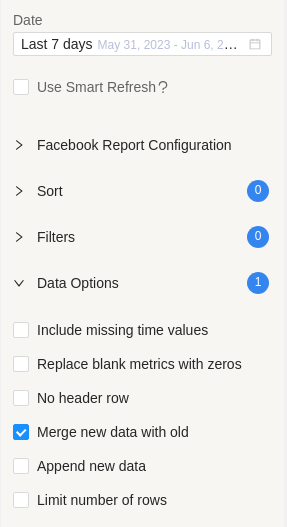
Enable Merge new data with old in the Data Options section before running your query.
On each subsequent run:
- Rows that match records already in the sheet are updated with the latest values
- Records that didn't exist before are added at the end
- No duplicate rows are created
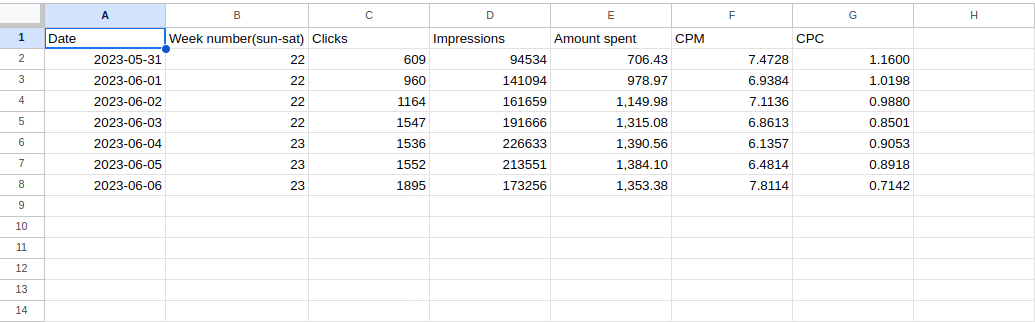
Example: You query "Last 7 days" on Monday and get 7 rows:
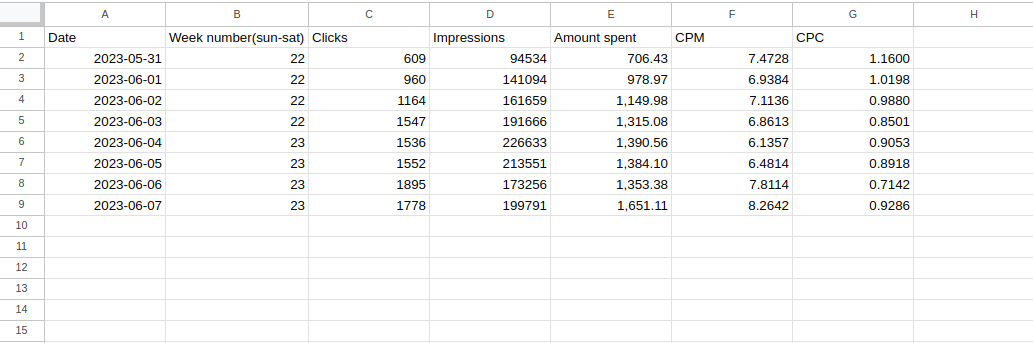
On Tuesday you run the same query again. TMR updates the 6 overlapping days with the latest values and appends Tuesday as a new row — giving you 8 days of clean, deduplicated data:
Currency conversion
Currency conversion lets you convert cost-based metrics (such as amount spent) from their native currency into any preferred currency, directly within Google Sheets.
How TMR converts currency
TMR multiplies each day's spend by that day's exchange rate. This means fluctuations are reflected accurately across your date range. Do not try to convert a cumulative total using a single rate — always let TMR apply the daily rate per row.
Example: $100 USD/day converted to EUR over a week:
| Day | Exchange rate | EUR |
|---|---|---|
| Day 1 | 0.85 | €85 |
| Day 2 | 0.84 | €84 |
| Day 3 | 0.87 | €87 |
| Day 4 | 0.85 | €85 |
| Day 5 | 0.88 | €88 |
| Day 6 | 0.86 | €86 |
| Day 7 | 0.87 | €87 |
Total: $700 USD → €602 EUR (not $700 × a single exchange rate)
How to use it
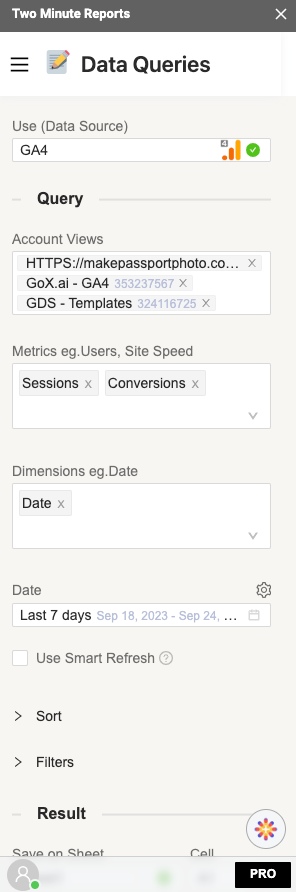
- In the TMR sidebar, go to Data Queries and create or edit a query for Facebook Ads or Pinterest Ads
- Select your metrics and dimensions
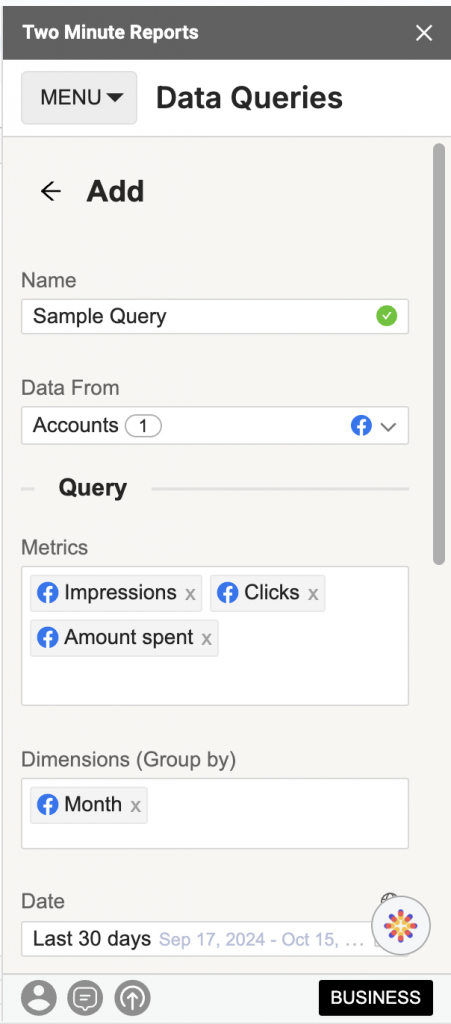
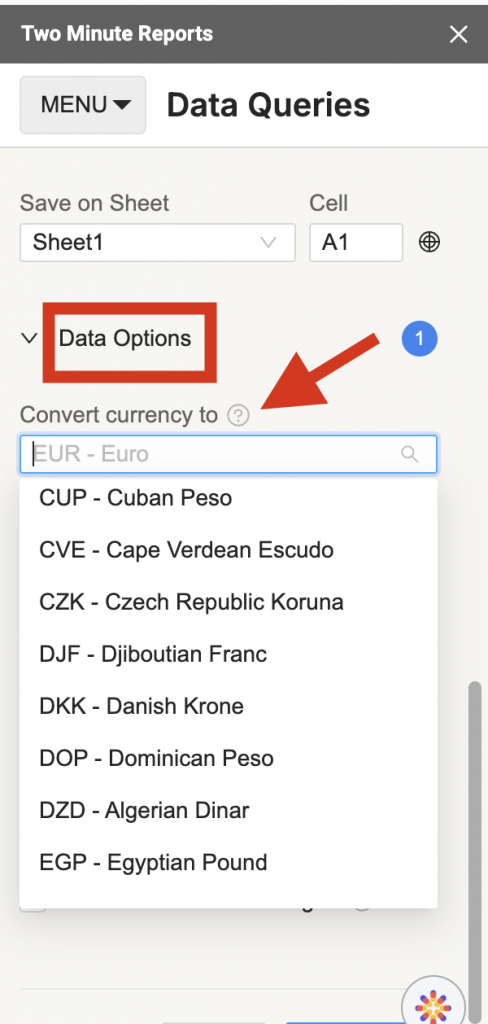
- Open the Data Options dropdown at the bottom of the query panel
- Select your target currency from the Currency Conversion dropdown
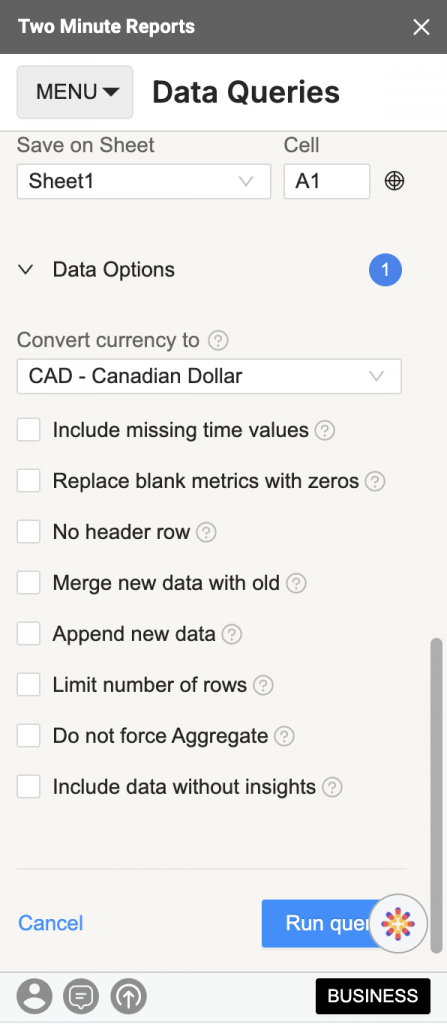
- Click Run Query
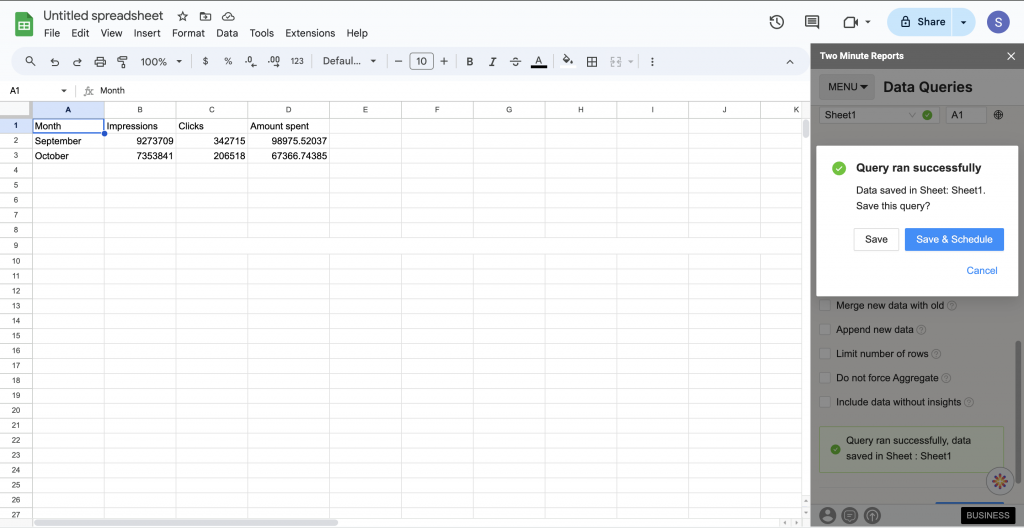
The output will show monetary metrics converted to your selected currency:
You can switch currencies by selecting a different option from the dropdown and re-running the query:

Do not force aggregate
What are non-aggregatable metrics?
Some metrics cannot be meaningfully summed or averaged across multiple accounts. For example, adding sessions from three separate GA4 properties doesn't produce a reliable total — sessions are unique per property. TMR calls these non-aggregatable metrics.
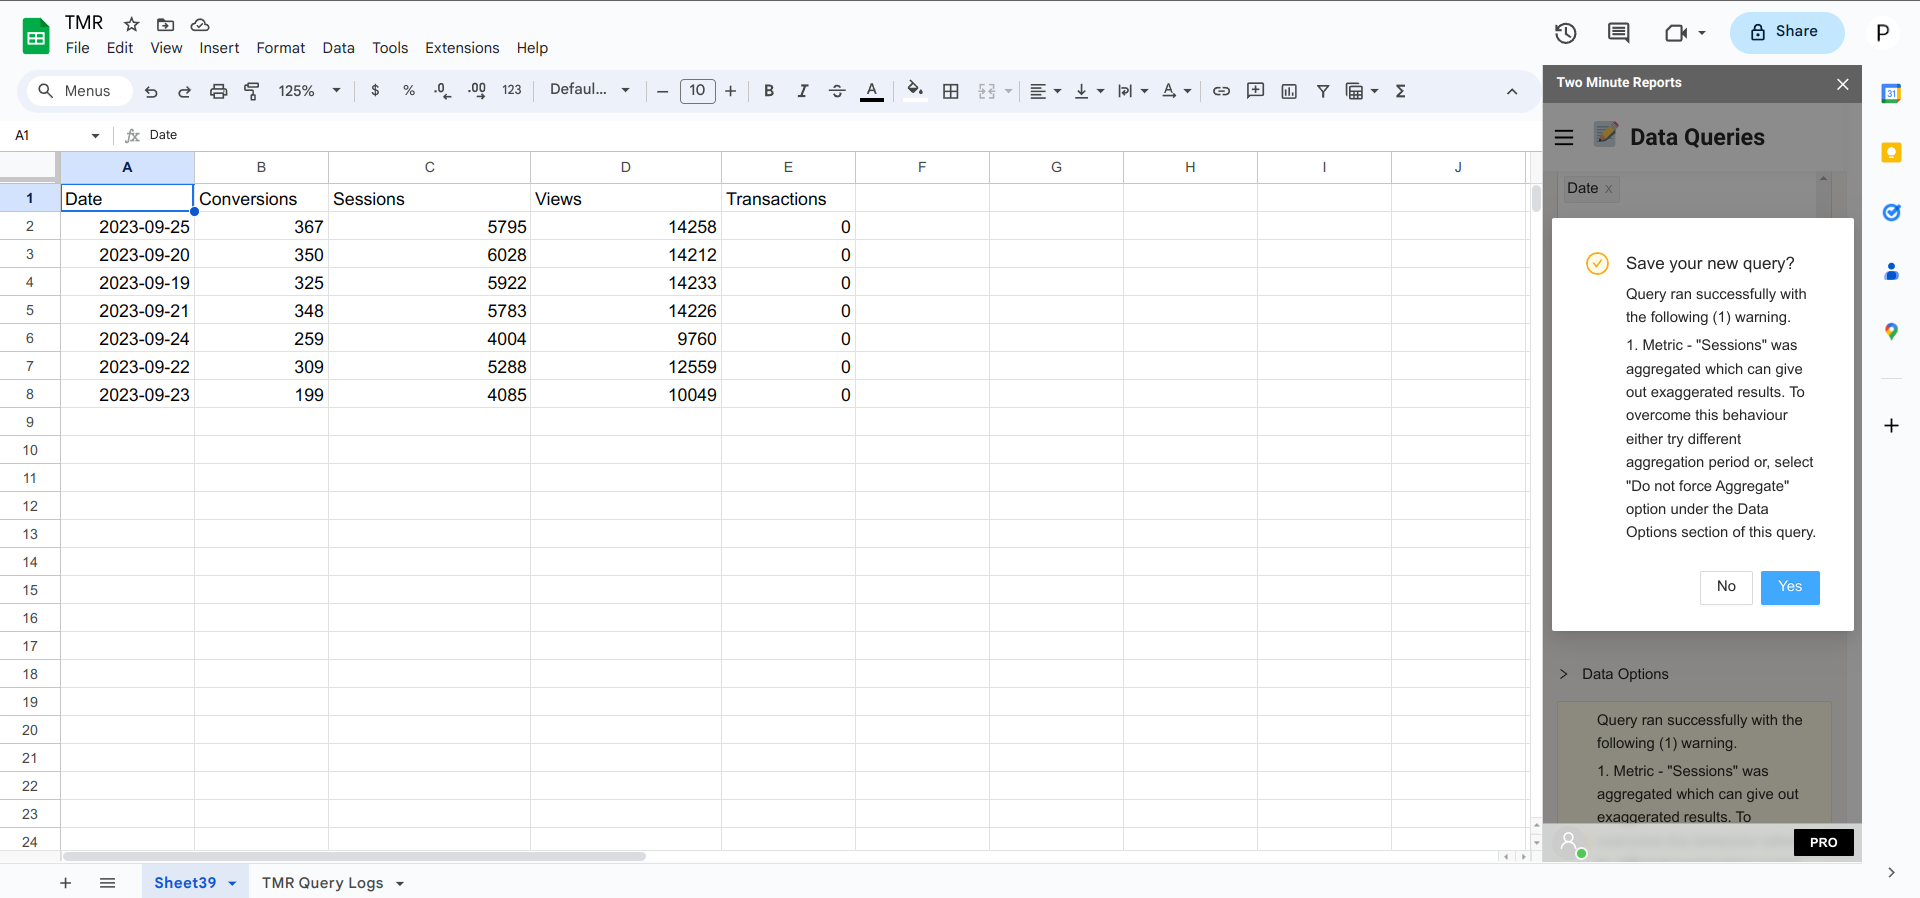
By default, TMR aggregates (sums or averages) all metrics across all selected accounts. This is correct for additive metrics like Conversions, but produces inaccurate results for non-aggregatable ones.
For example, a GA4 query across 3 properties with Sessions and Conversions:
When to use this setting
Enable Do not force aggregate when:
- You are querying multiple accounts or properties simultaneously
- One or more selected metrics are non-aggregatable (unique counts, ratio-based, or calculated metrics)
- You want per-account or per-property rows rather than a blended total
How it works
| Setting | Result |
|---|---|
| Force aggregate (default) | Metric values are summed or averaged across all accounts into one row per date |
| Do not force aggregate | Each account or property gets its own rows; non-aggregatable metrics show their actual individual values |
With force aggregate on (default), all values are combined into one row per date — Sessions appears summed across all 3 properties:
With Do not force aggregate enabled, each property gets its own rows and non-aggregatable metrics show UNKNOWN:
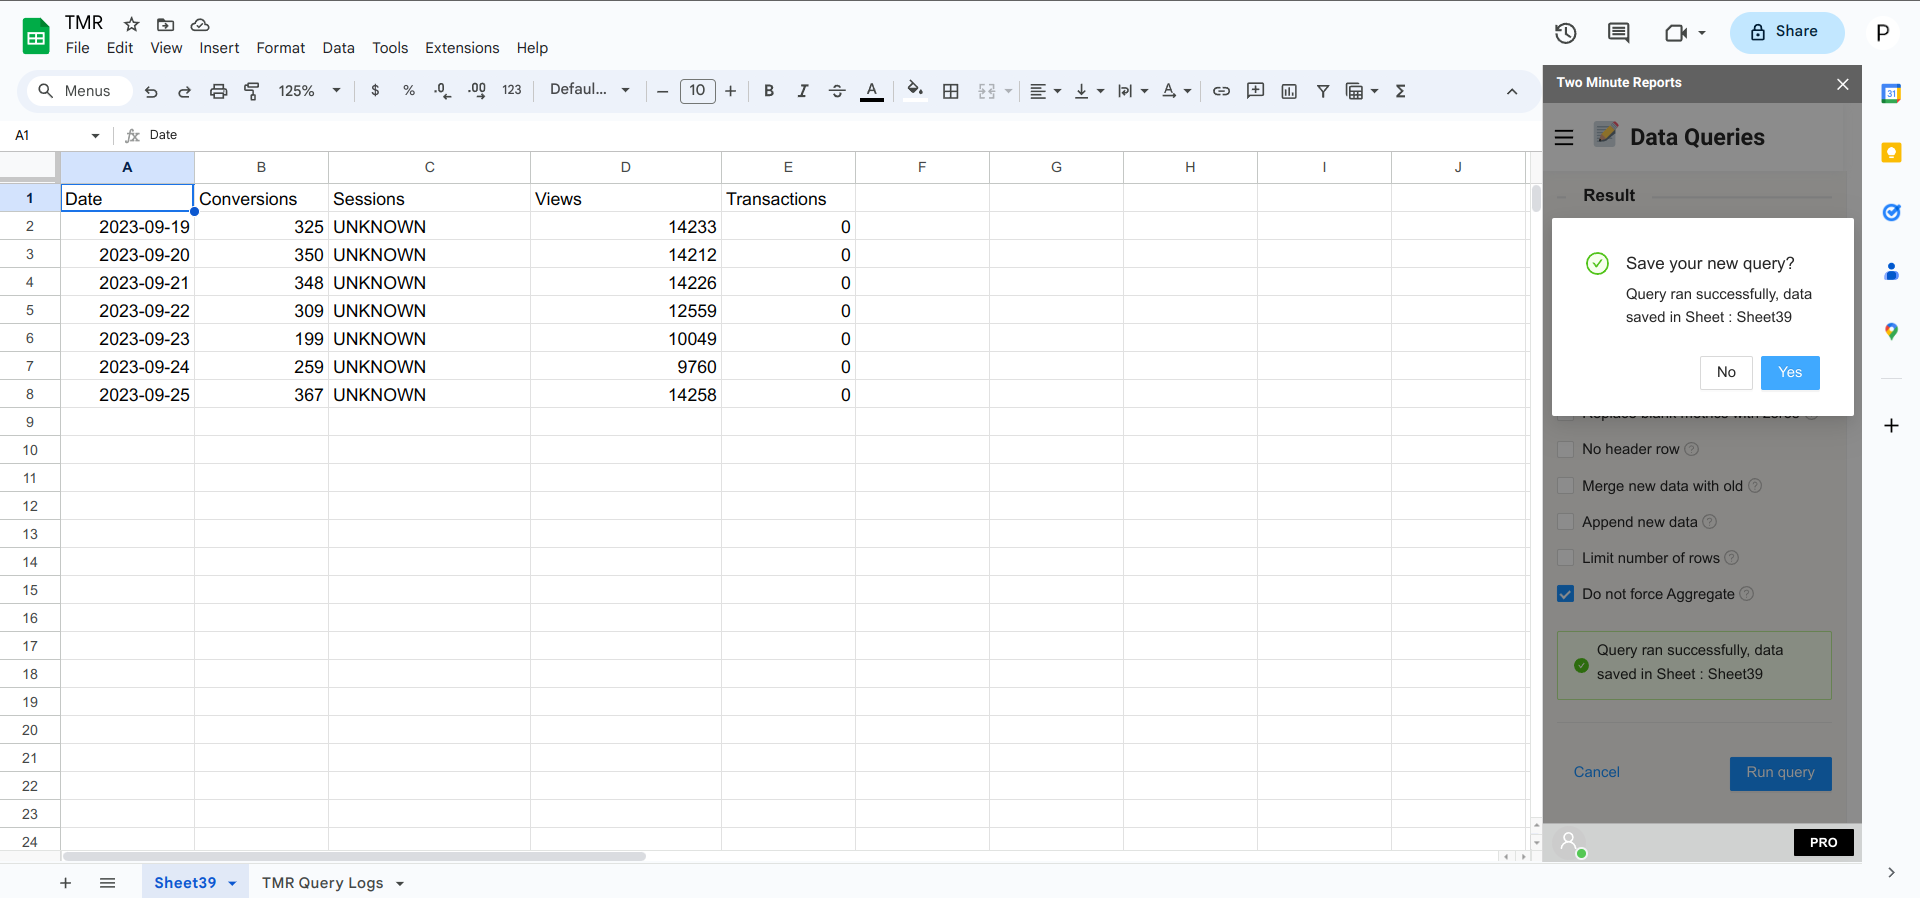
UNKNOWN indicates that TMR does not have a reliable aggregation formula for that metric across your selected accounts.
How to enable it
In the Data Options section of your query, toggle on Do not force aggregate, then run the query.