

Edit with Dash
Dash is the Two Minute Reports AI assistant. On a dashboard, Dash can generate a whole dashboard or page, add and restyle widgets, and rearrange pages. It can also summarize what your data shows, all from a chat. This page covers what Dash can do with dashboards. The rest of the Dashboards docs cover doing the same things by hand.
What you can do
- Ask Dash to generate a full dashboard or a new page from a prompt
- Add, edit, duplicate, move, and resize widgets by asking
- Restyle a single widget or the whole dashboard
- Add, rename, and reorder pages
- Change the date range and the accounts
- Get plain-language summaries and insights about your data
- Have Dash add a summary widget or a downloadable chart for a client
Meet Dash
Select the Dash icon in the top bar (its tooltip says Ask Dash), or press ⌘J (Mac) or Ctrl+J (Windows) anywhere in the Hub. On a dashboard, you can also select Edit with Dash in the header. Dash is context-aware: when a dashboard is open, it can see the dashboard's pages, widgets, and layout, so you can say "this widget" or "add a page here" and it knows what you mean.
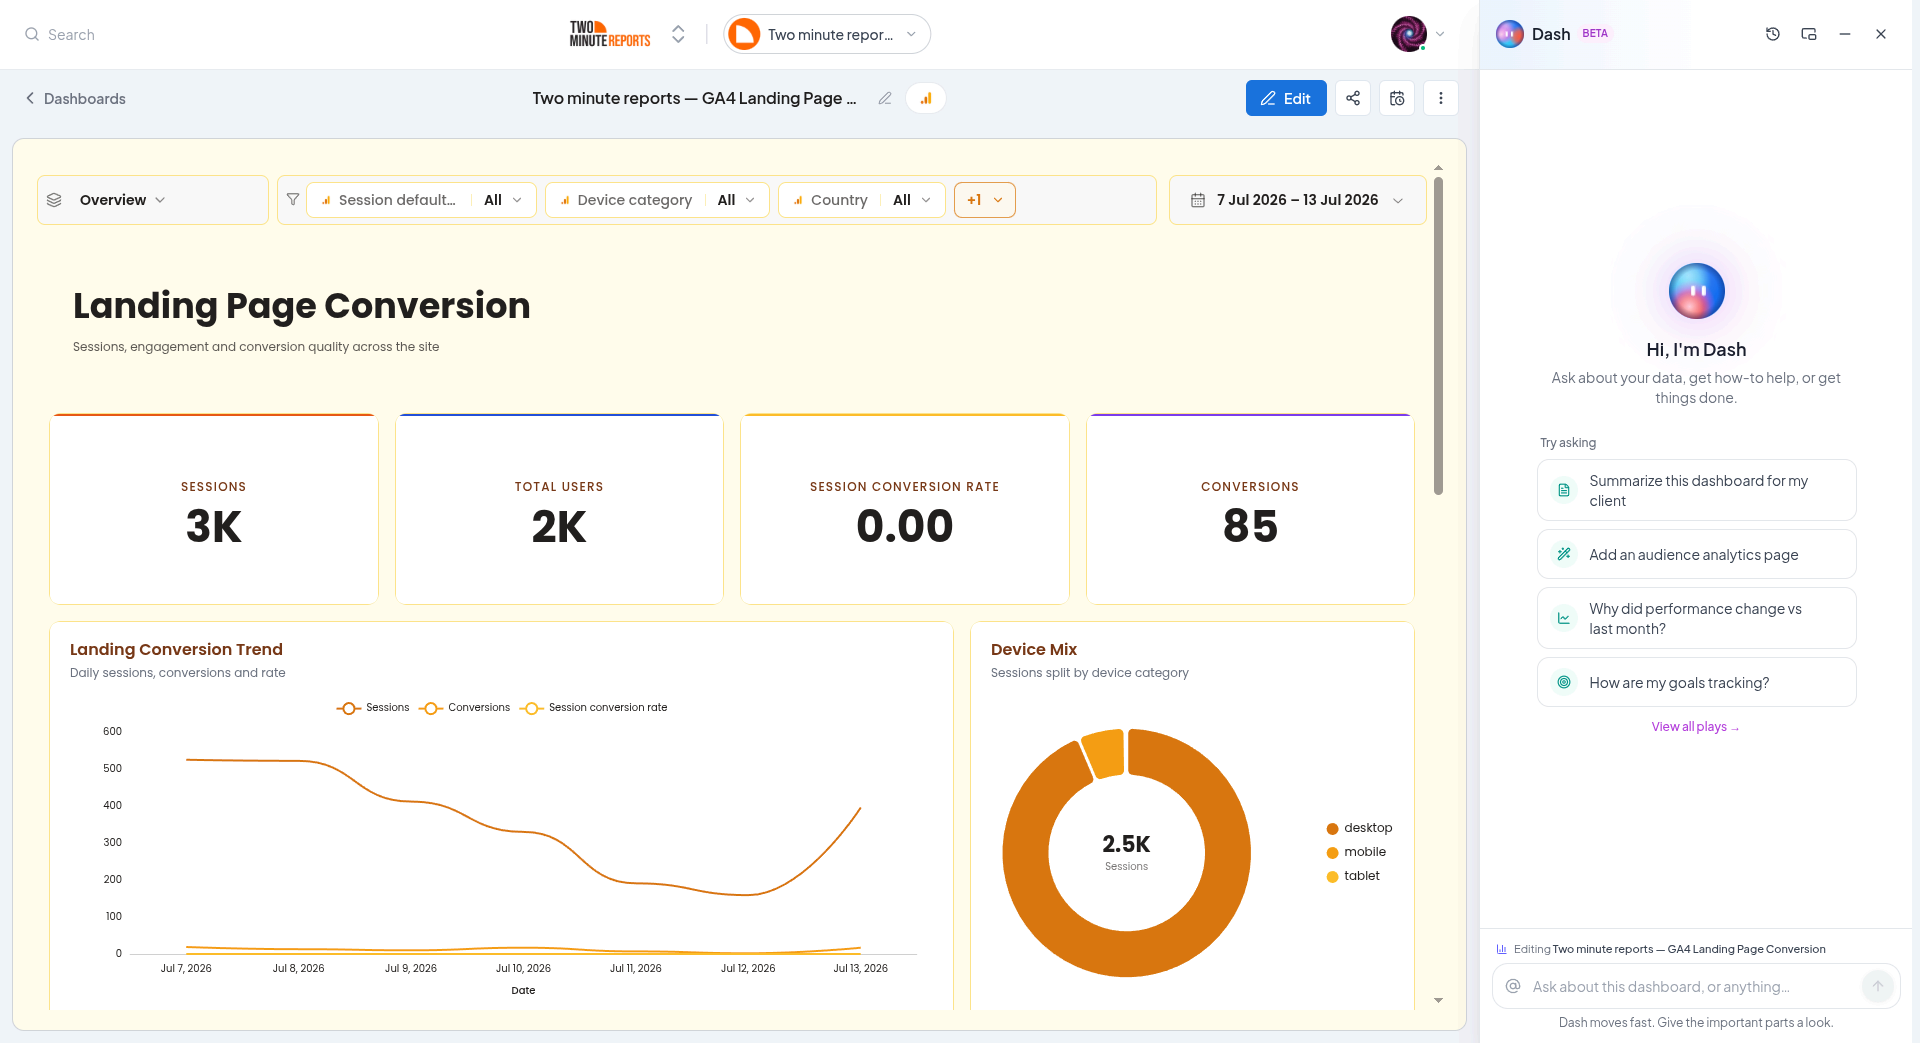
On a dashboard the composer prompts you with "Ask about this dashboard, or anything…". You can type a request, pick a starter prompt, or use @ to point Dash at a specific dashboard, client, or goal.
Build and edit dashboards
When a dashboard is open, Dash makes its changes in that dashboard while you watch. Every change:
- shows on the dashboard as Dash makes it
- is auto-saved, like any manual edit
- is undoable with the editor's undo/redo
You stay in control: Dash applies changes, and you can undo anything you don't like.
Generate a dashboard or page
For anything big, Dash builds it in one step:
- A whole new dashboard - "Build a new GA4 and Google Ads dashboard." Dash designs a complete, multi-page dashboard and opens it for you.
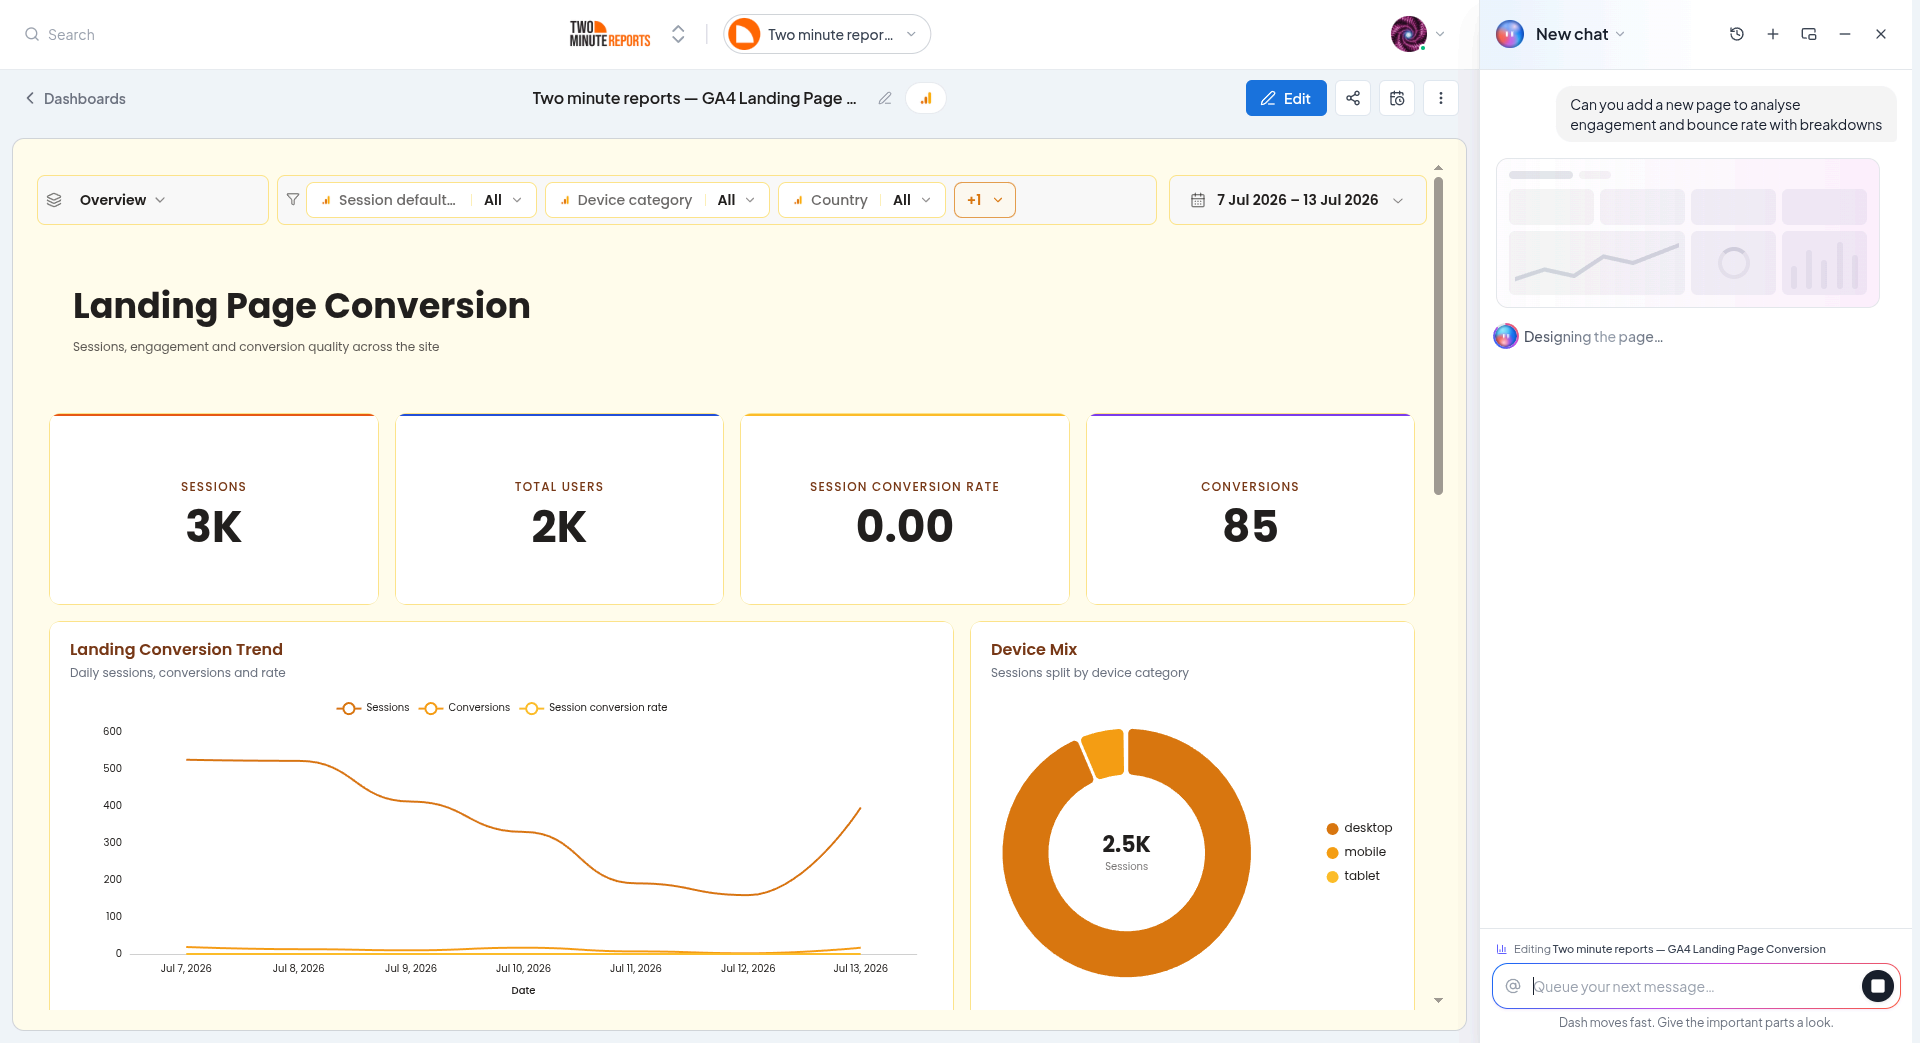
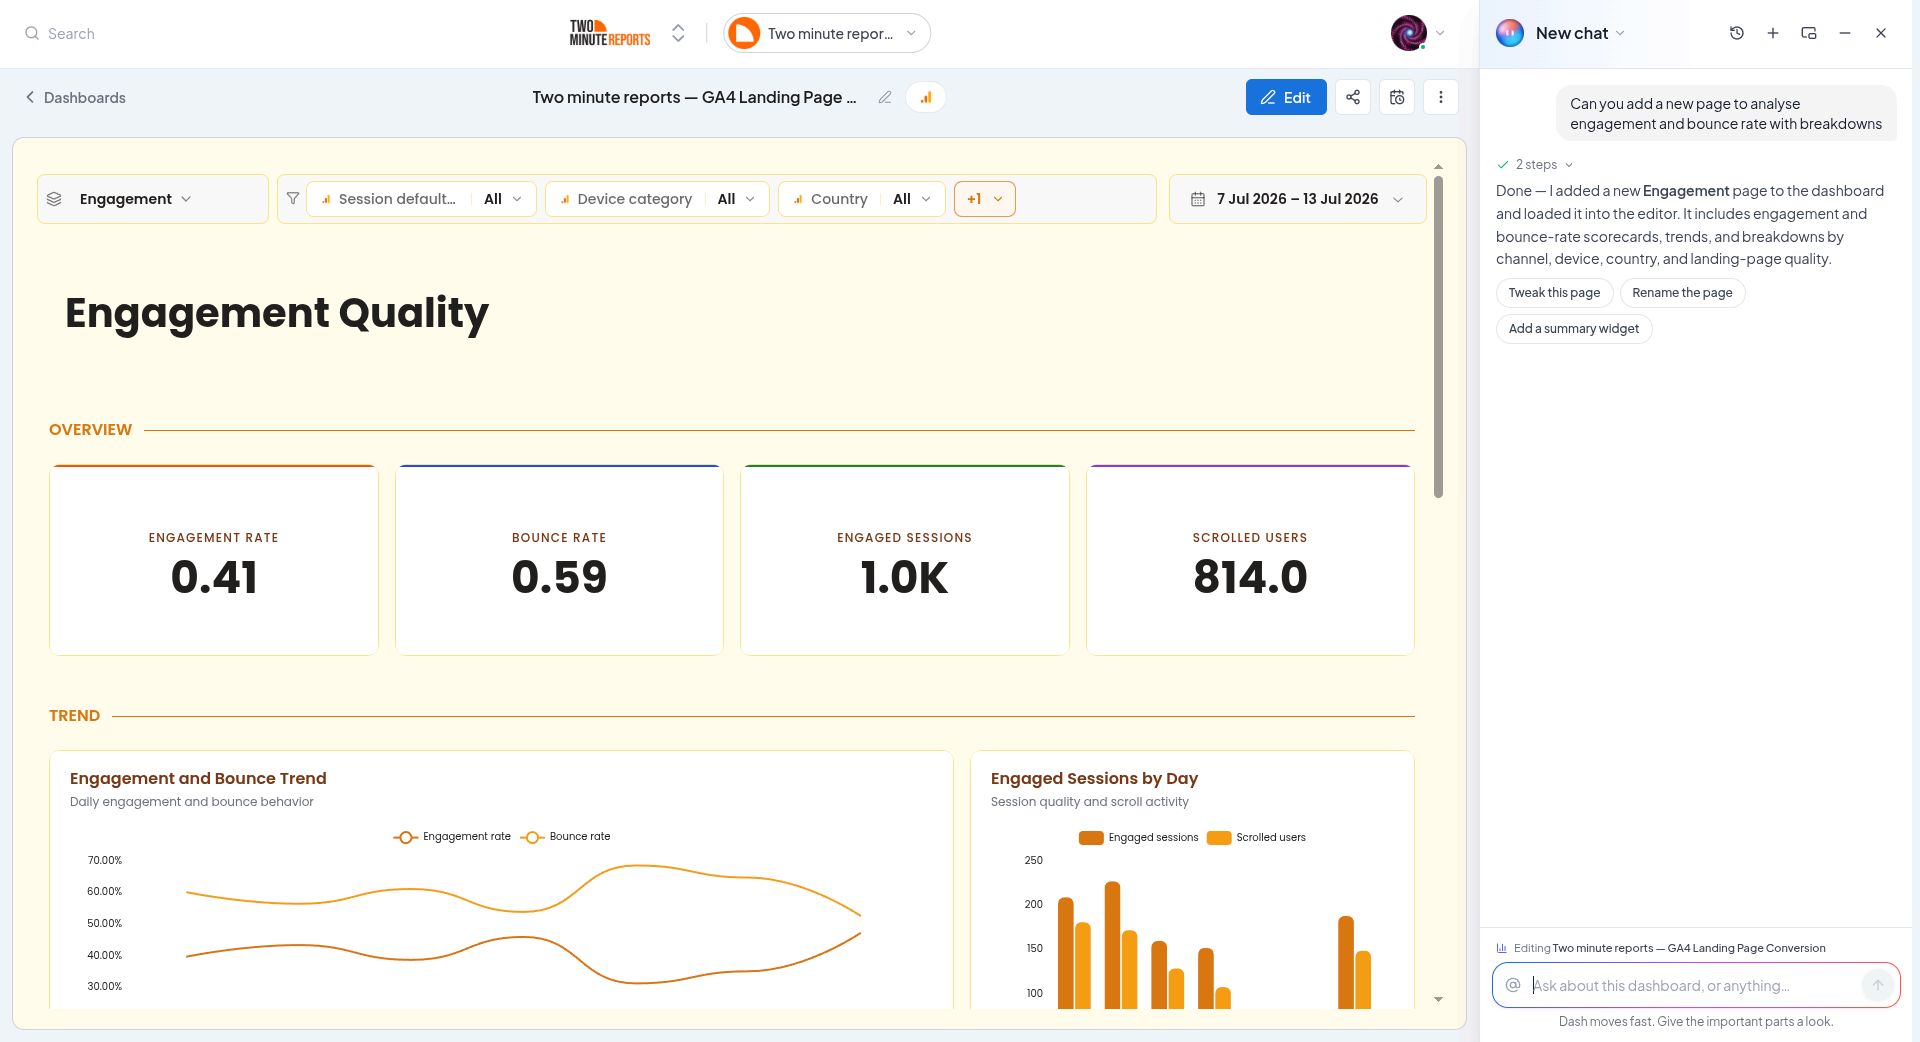
- A whole new page - "Add an audience analytics page to this dashboard." Dash designs a laid-out page (section headers, scorecards, charts) and adds it to the dashboard.
Edit widgets
For a single widget or a quick change, ask:
- Add - "Add a scorecard for total conversions."
- Edit - "Change the spend chart to a bar chart and break it down by campaign."
- Duplicate - "Duplicate the ROAS scorecard."
- Move - "Put the sessions chart at the top."
- Resize - "Make the revenue table full width."
Restyle
- One widget - "Make the revenue scorecard use our brand color."
- The whole dashboard - "Apply a clean, dark theme to this dashboard."
Manage pages, dates, and accounts
- Pages - "Add a page called SEO", "Rename this page to Paid Media", "Move the Overview page first."
- Date range - "Set this dashboard to last 30 days."
- Accounts - "Use my Acme Google Ads and Meta accounts."
Summarize and get insights
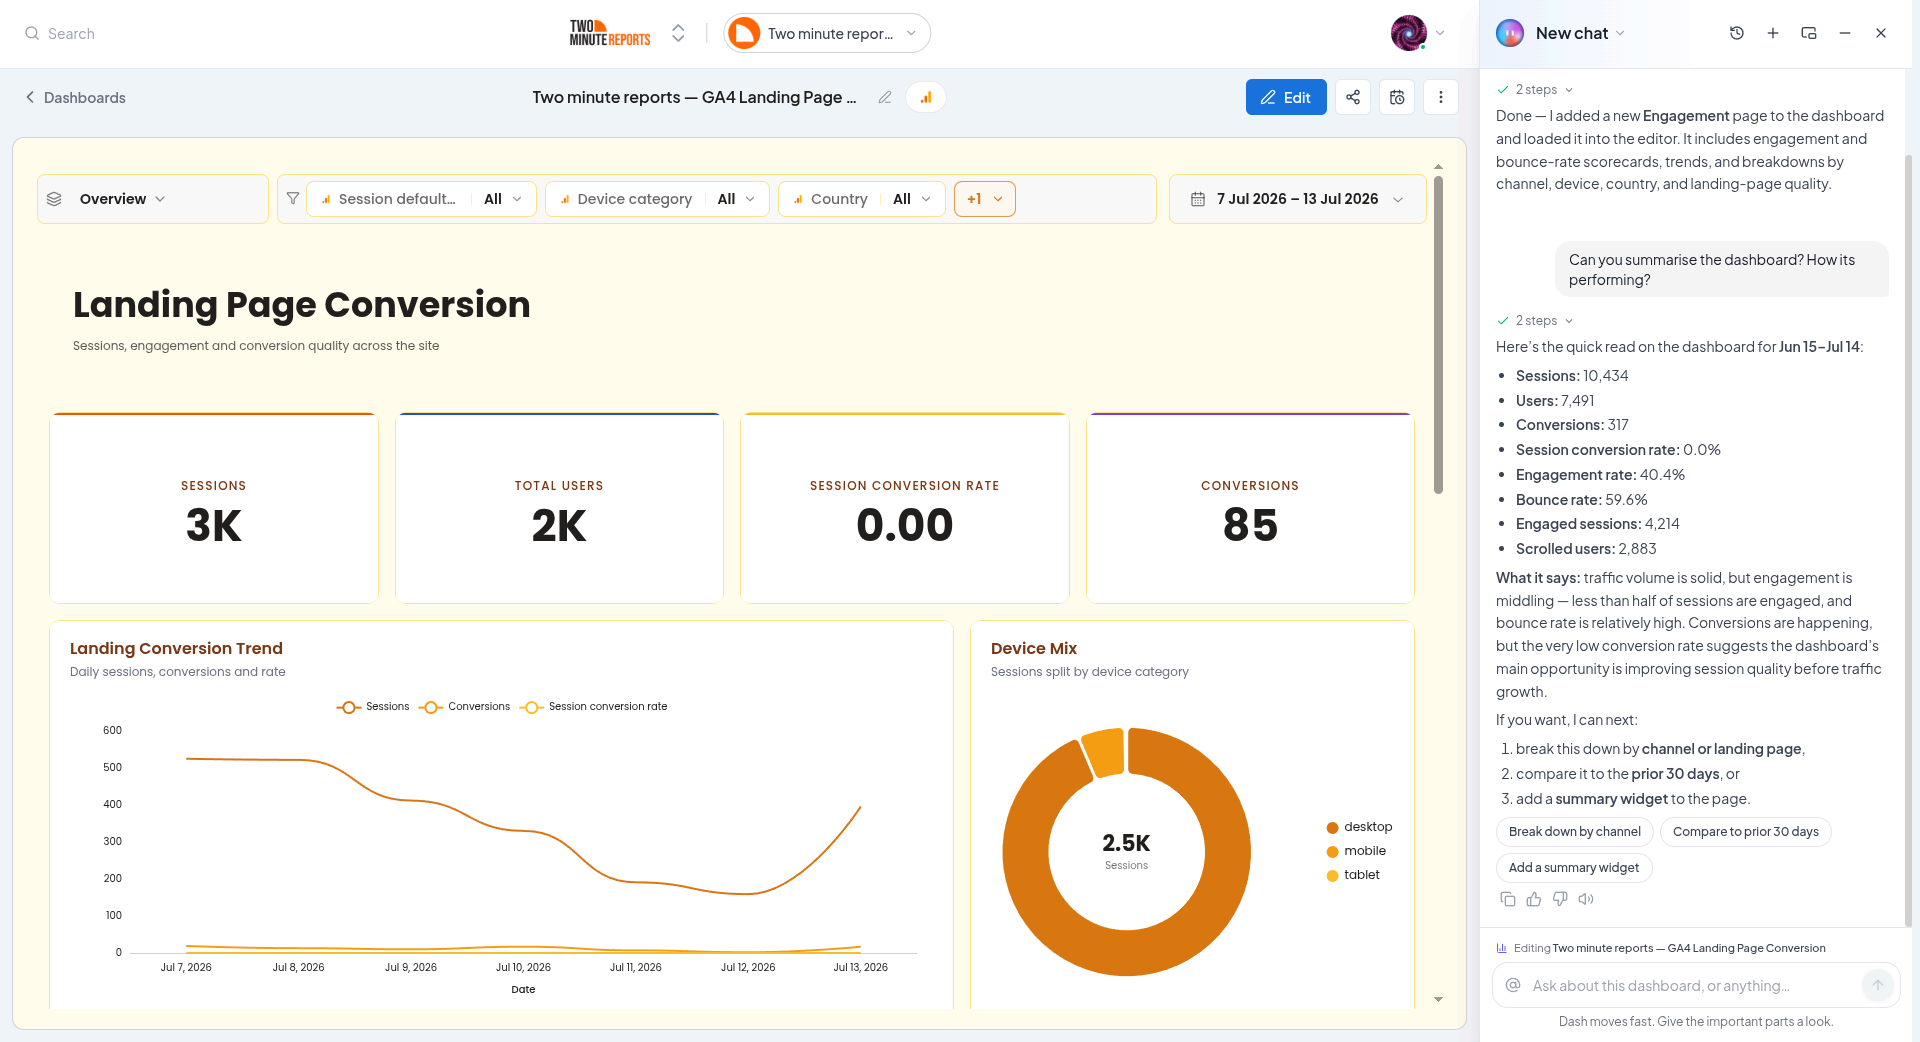
Dash can also read your dashboard's data and explain it. Dash queries your connected data for the numbers it gives you.
Ask in the chat
- "Summarize this dashboard for my client."
- "What changed this week?"
- "Why did sessions drop last week?"
- "What stands out in my data this month?"
Dash pulls the numbers, compares periods where it helps, and replies with a short, plain-language answer you can share.
Add a summary widget
Ask Dash to put the analysis onto the dashboard itself, for example "Add a key-insights summary to the top of this page." Dash queries the real numbers and adds a text widget with the finished, client-ready summary.
Downloadable charts
Dash can render a chart or a short summary as an artifact, a self-contained visual that opens beside the chat. Open it in the canvas and select Download as image to use it in a client deck or email.
Example prompts
Good starting points on a dashboard:
Build
- "Build a new GA4 + Google Ads dashboard"
- "Add an audience analytics page"
- "Chart my top 10 landing pages"
- "Add a summary text widget to this dashboard"
Analyze
- "Summarize this dashboard for my client"
- "What changed this week?"
- "Why did performance change vs last month?"
- "What stands out in my data this week?"
Tips
- Be specific. Name the metrics, breakdowns, and accounts you care about for the best results.
- Point Dash with
@. Mention a specific dashboard, client, or goal to give it exact context. - Undo is your safety net. Ask Dash to try something, and step back with undo if it's not what you wanted.
- Big changes, one ask. For several widgets or a whole page, ask Dash to generate it rather than adding pieces one by one.
- Review before sharing. Check AI-built widgets and summaries against your data before sending them to a client.
Next steps
- Widgets and charts - Fine-tune what Dash builds
- Layout and pages - Arrange the canvas by hand
- Share and export dashboards - Share the finished dashboard
Share and export dashboards
Choose who can open a dashboard: only people you add, your client's contacts, or anyone with the link. Or export it to PDF or PNG.
Dashboard briefings
Email your clients updates on their dashboards, once or on a schedule. Write the email yourself or let Dash draft it, attach a PDF, and require approval if your team wants it.