

Migrating Existing Reports
Already have a report you like in Google Sheets or Google Data Studio? You don't have to rebuild it widget by widget. Upload the report as a PDF or a screenshot, and AI recreates its layout as a live Two Minute Reports dashboard. It runs on your own connected accounts.
What you get is a native dashboard: always current, and yours to edit, theme, and share like any other.
Before - the report in Google Data Studio
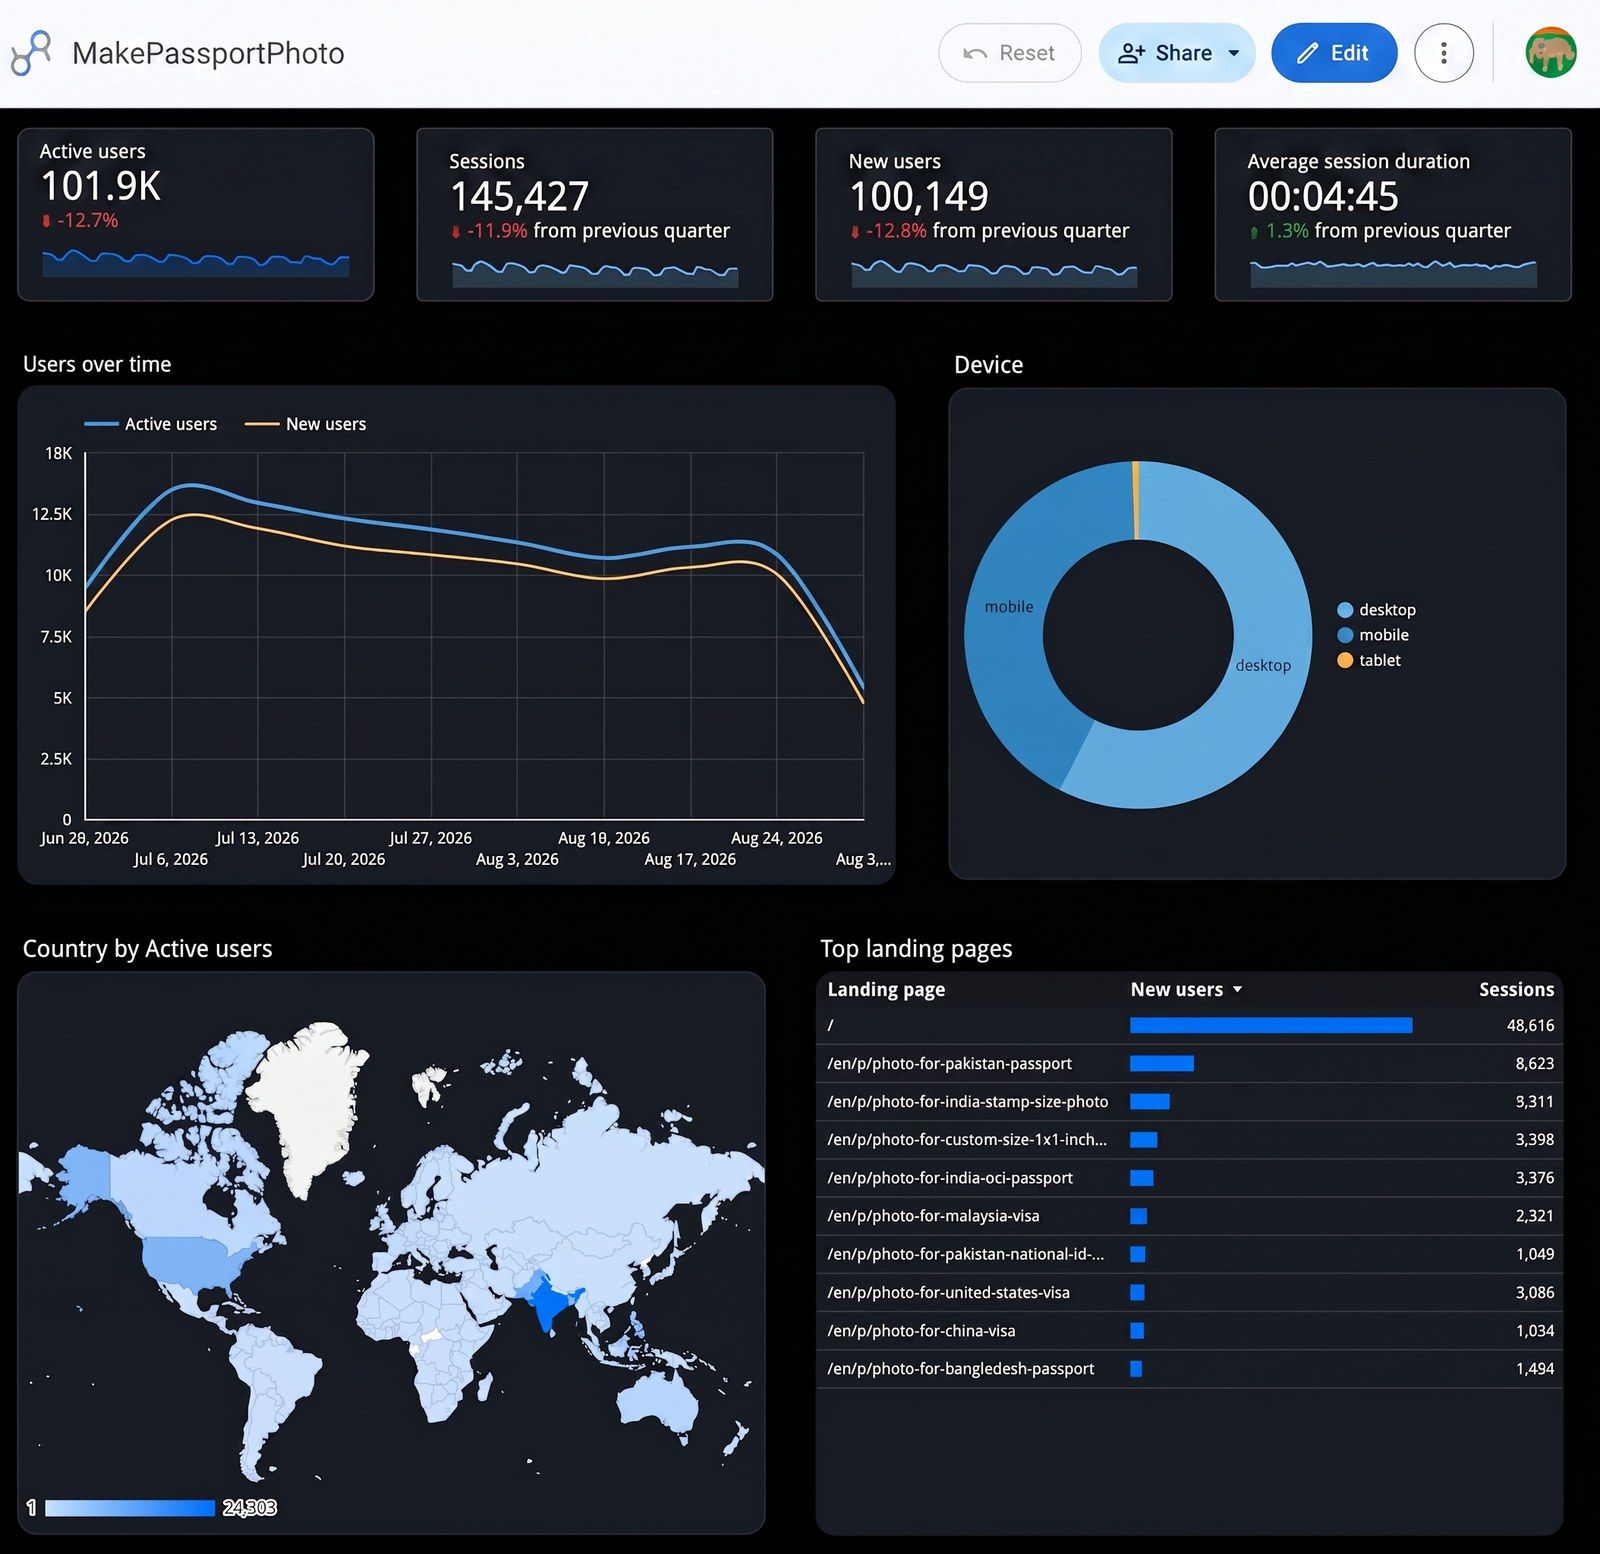
After - the same report migrated to a Two Minute Reports dashboard
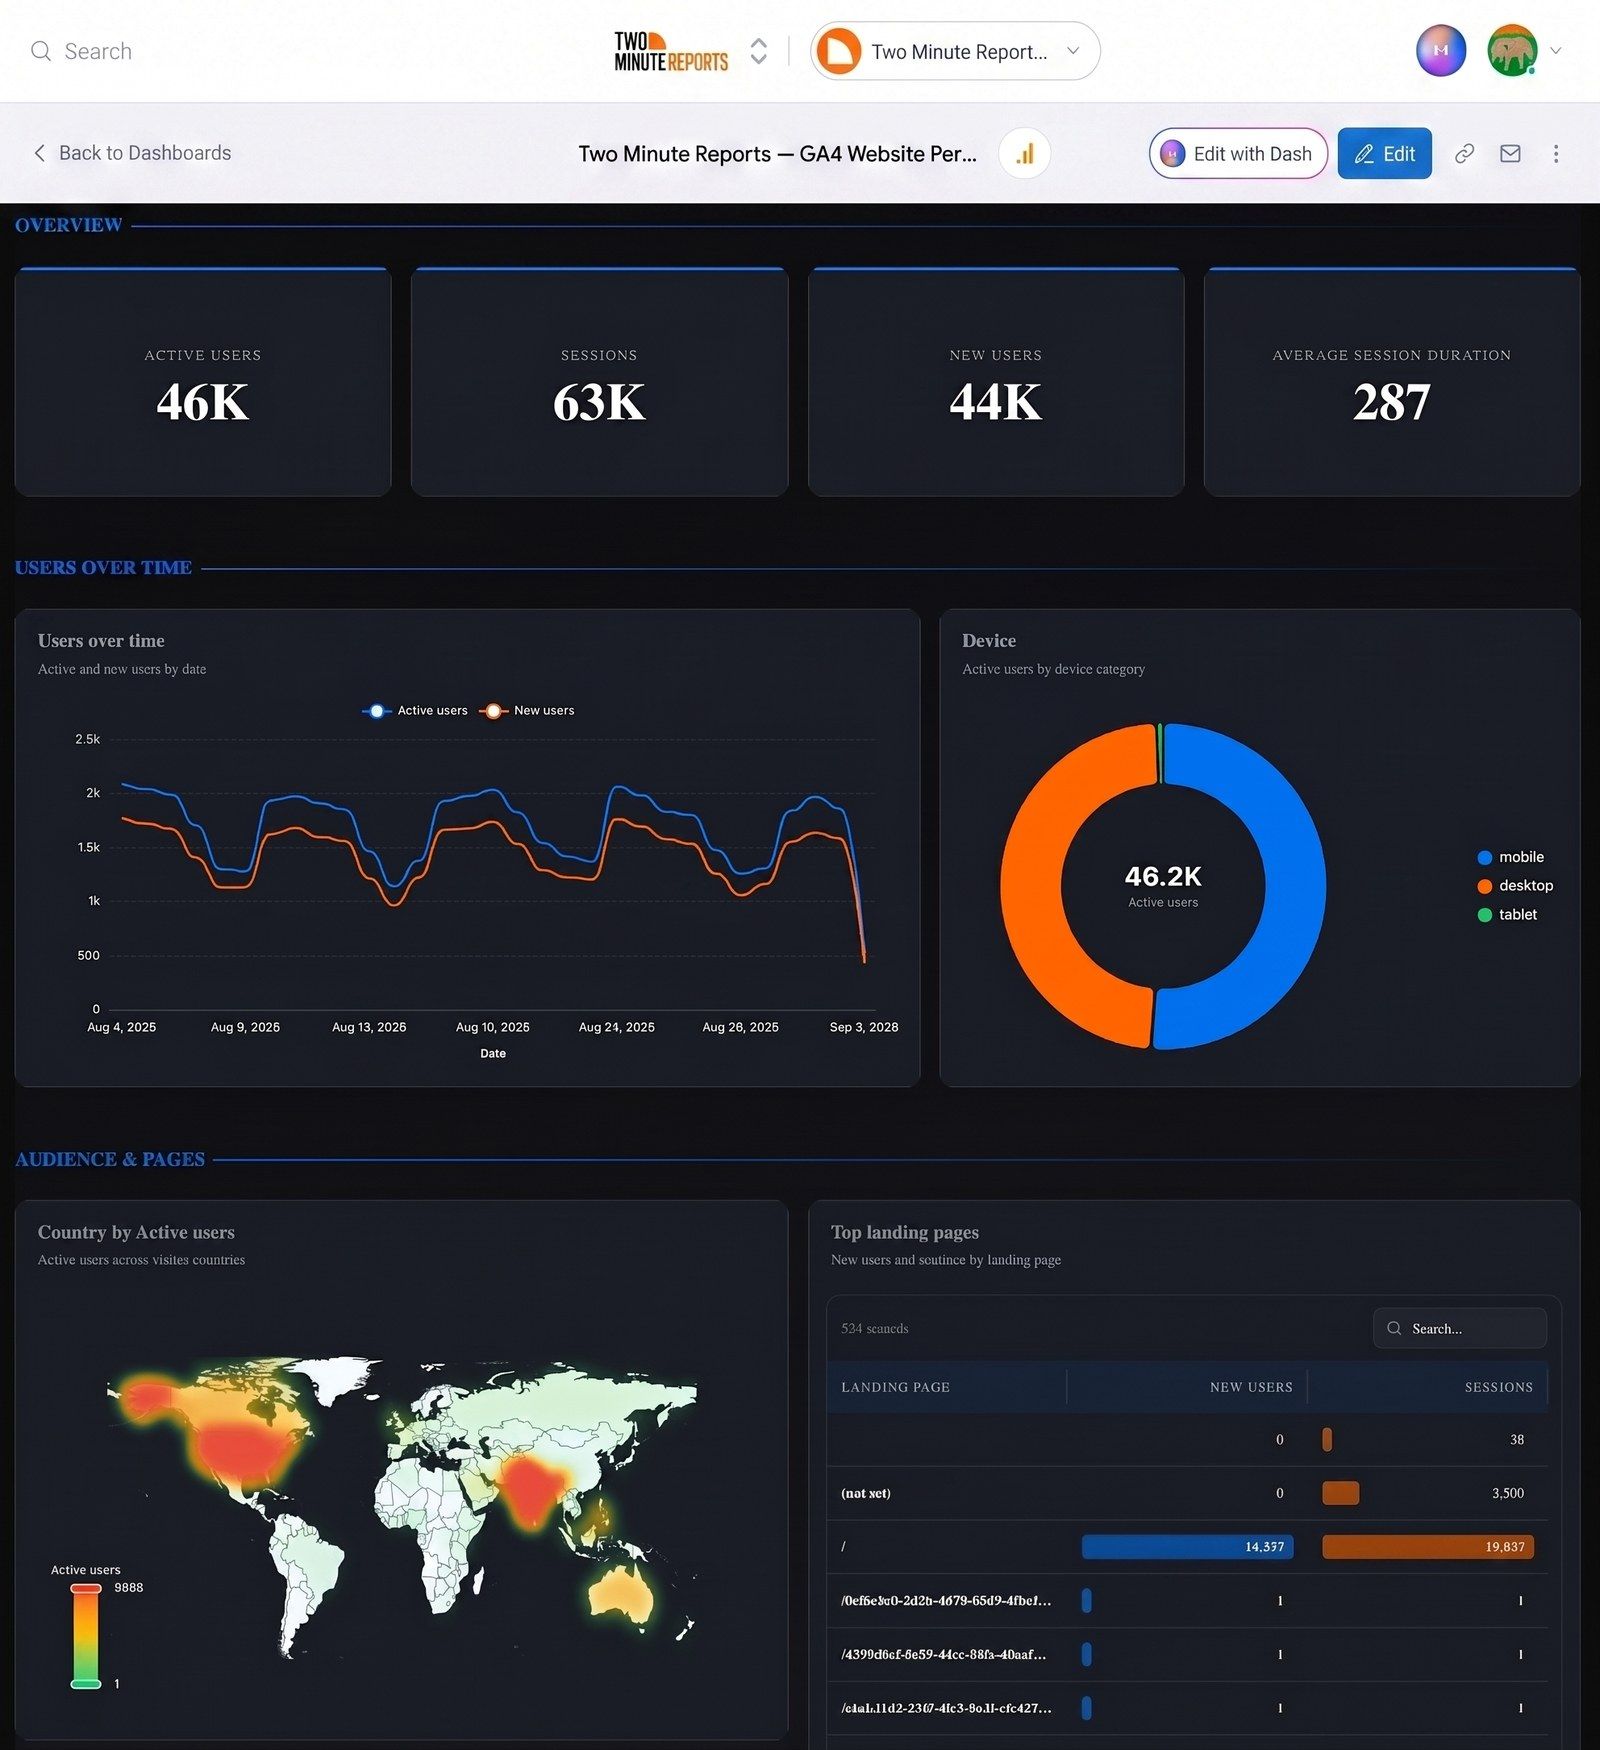
What You Can Do
- Recreate a Google Sheets or Google Data Studio report as a Two Minute Reports dashboard
- Use a PDF or screenshots as the visual reference
- Migrate up to 8 reference pages in a single generation
- Tell AI to Recreate the reference closely, or Take inspiration from it
- Match the reference's colors, or apply one of your saved themes instead
- Test the layout on sample accounts before using production accounts
- Refine the generated dashboard page by page with Dash
What You Can Upload
| Reference | Accepted format | Limit |
|---|---|---|
.pdf | 25 MB per file; up to 8 pages read per PDF | |
| Images | JPEG, PNG, WebP | 5 MB per image |
| Total | Any mix of the above | Up to 8 reference pages per generation |
A PDF can contribute several reference pages, while each uploaded image counts as one. Your PDF is read in your browser and converted to page images before anything is uploaded.
Choose Recreate or Take Inspiration
Once you add a reference, the Use this report to… switch controls how closely AI follows it.
- Recreate - match the original layout and style as closely as possible. AI follows the page structure, the widget order, and the titles in your reference. It also samples the reference's color palette, so the rebuild resembles the original.
- Take inspiration - treat the reference as a visual guide and let AI design a new layout. Choose this when you want the new dashboard to feel similar without reproducing the original structure.
For a true migration, use Recreate.
Before You Start
Three things to check before you generate. They're independent, so handle them in any order.
Connect the Data Sources
AI builds widgets against real accounts, so connect the platforms your old report used before you generate. A Google Data Studio report powered by Google Ads and GA4 needs both connected here first. See Browse Connectors.
Check Connector Eligibility
AI dashboard generation relies on connectors that expose a standard set of metrics and dimensions, so a few can't be selected in the AI flow:
API Bridge, ChatGPT, Apple App Store, Firebase - Cloud Firestore, Google Trends, MariaDB, MySQL, Page Speed Insights, and PostgreSQL.
If your old report relied on one of these, plan to rebuild that part by hand after generation.
Check Your Role
Creating a dashboard with AI requires an editor role or higher. Viewers can't generate dashboards. See Role Types for how team roles are assigned.
Prepare Your Existing Report
The quality of your reference sets the quality of the result. Upload the presentation layer of your report, not a raw data export.
From Google Data Studio
The report's own PDF export is the cleanest input:
- Download the report as a PDF - use Share → Download report, which produces one PDF page per report page. Upload that PDF directly.
- Or screenshot each page - open the report in view mode and capture one screenshot per page.
From Google Sheets
Sheets reports usually mix raw data tabs with a presentation tab. Upload the presentation tab:
- Print the summary tab to PDF - use File → Print and set the range to the tab holding your charts and KPI cells
- Download individual charts as images - on any chart, use the chart menu and Download → PNG image
- Or screenshot the dashboard tab - the tab with your charts and headline numbers
Run the Migration
Open Create with AI
From the dashboard list, click New Dashboard, then choose Create with AI under How would you like to start?. You can also use the Create with AI button directly.
Describe What You're Migrating
On the Describe step, fill in What should the dashboard show? and say explicitly that you're migrating an existing report. Your reference carries the visual structure; the prompt carries the intent. See Migration Prompts below, or click one of the Try an example prompts and edit it.
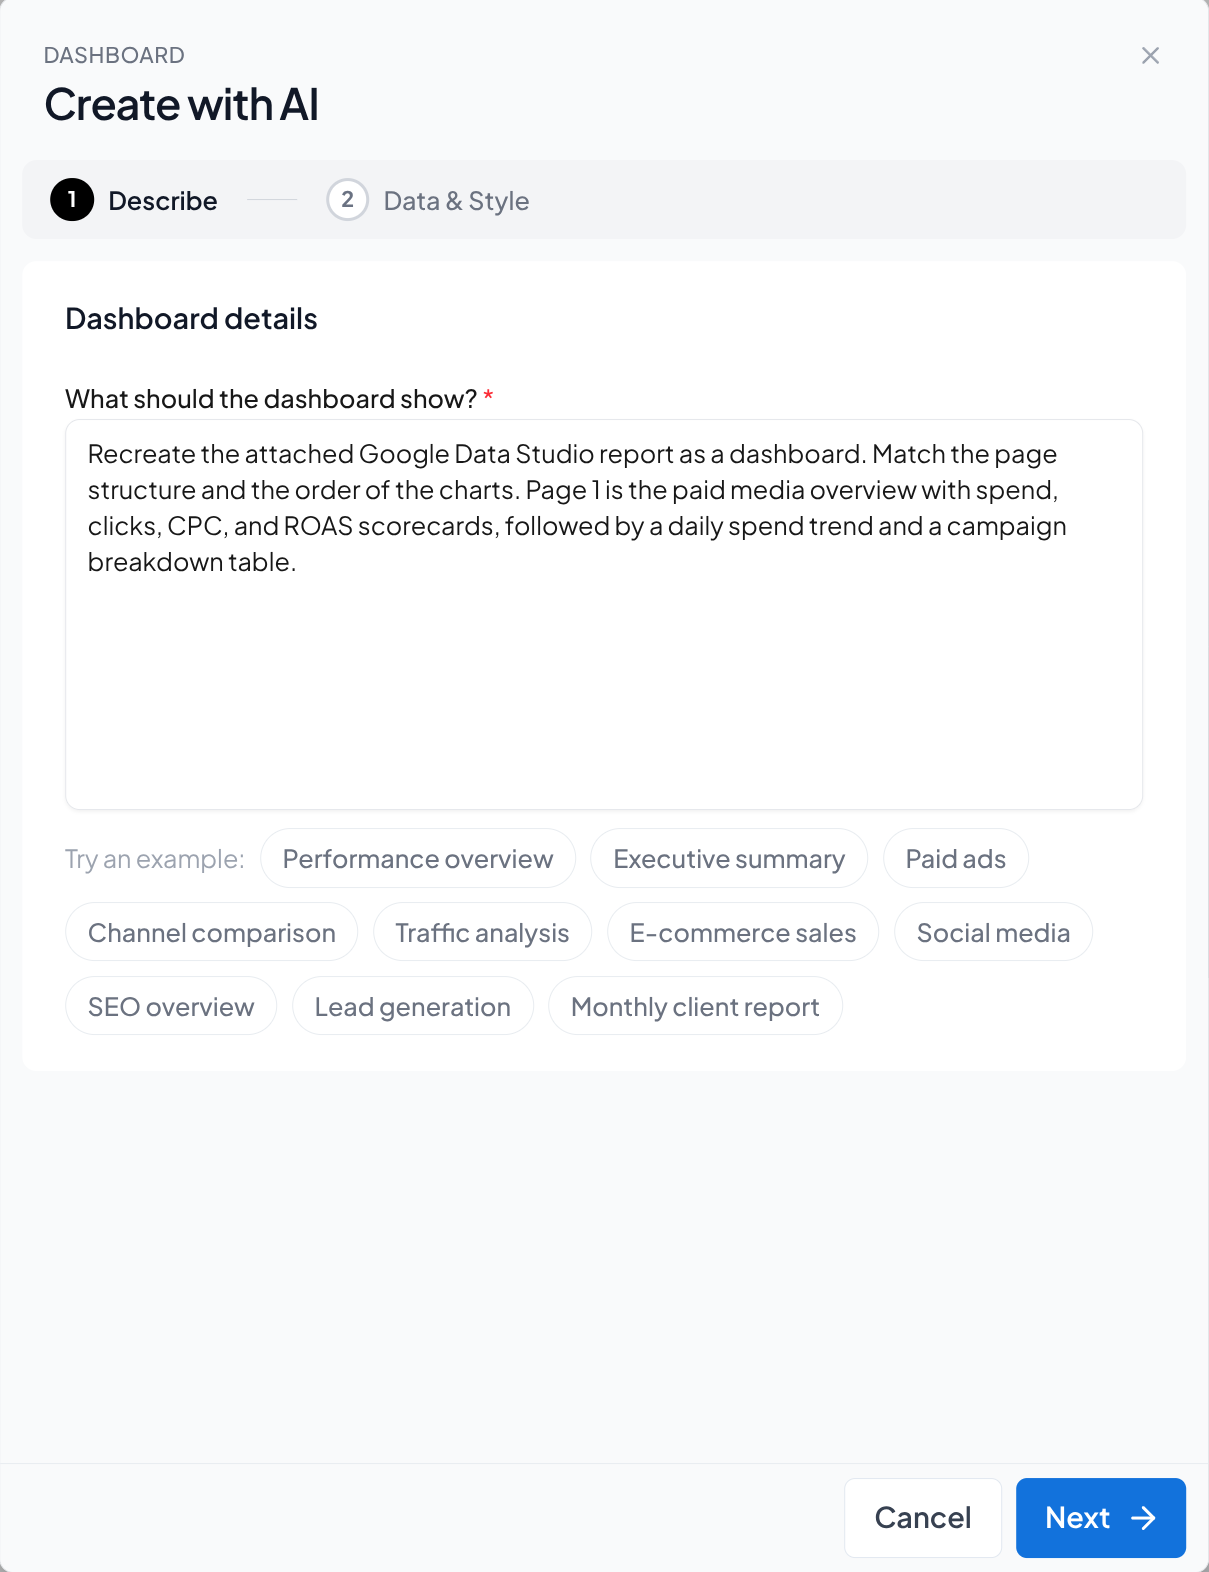
Click Next to continue to Data & Style.
Upload the Report
Under Recreate an existing report (optional), click or drag your PDF or images onto the upload area. Add pages in the order they should appear, then set Use this report to… to Recreate.
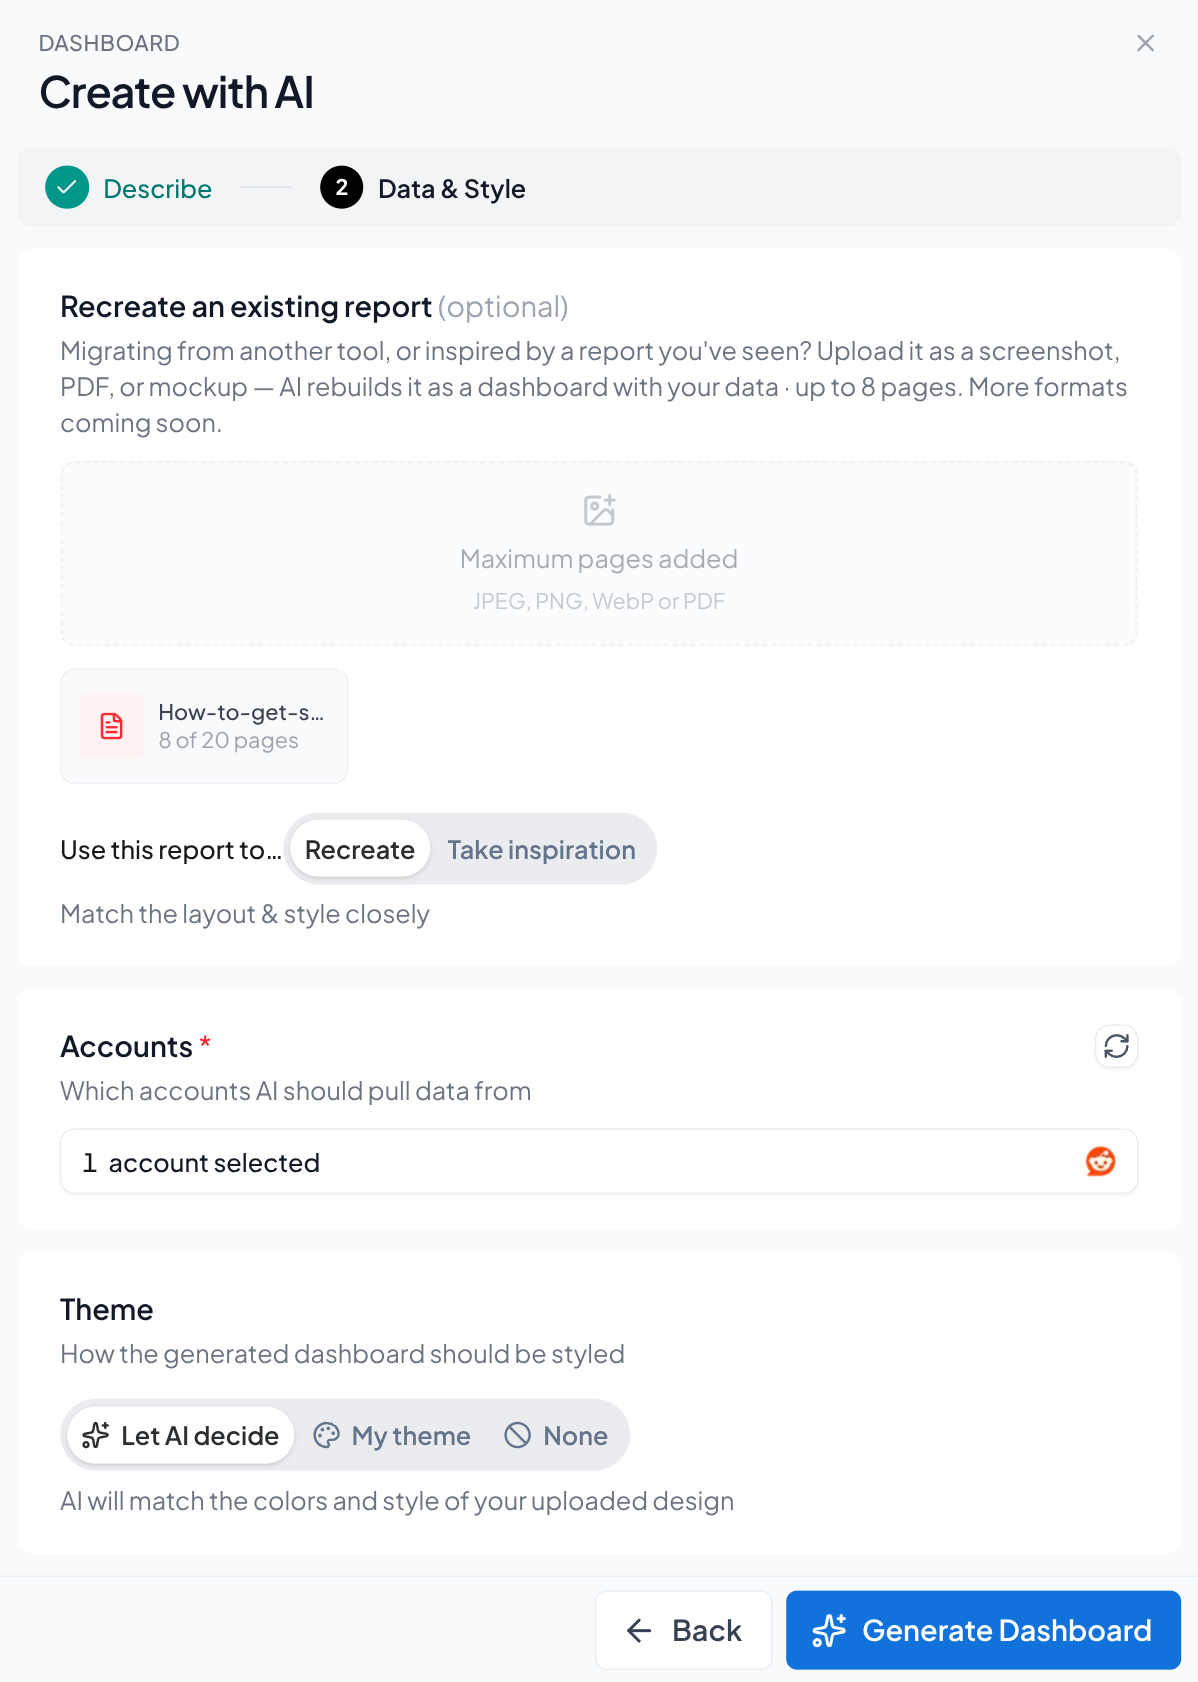
Select Your Accounts
Under Accounts, choose the accounts AI should pull data from. Pick the ones that correspond to your old report's sources so the rebuilt widgets show comparable numbers. If you've just connected an account, reload the list with the refresh icon in the top-right of the Accounts card. Its tooltip reads Refresh accounts.
Choose a Theme
- Let AI decide - in Recreate mode with a reference uploaded, AI matches the colors and style of your upload. Let AI decide is usually the right choice for a migration.
- My theme - apply one of your saved themes or a preset instead. Use this when agency or client branding should outrank the source report's appearance.
- None - generate a plain layout with no theme applied.
Generate and Review
Click Generate Dashboard. Generation usually takes 45 to 90 seconds while AI reads your reference, designs the layout, and builds each widget.
We recommend reviewing the result before you share it with clients or stakeholders. Check the page structure, the fields on each widget, the filters, the calculations, and the numbers against the original.
Migration Prompts
Be explicit about what should be recreated, and name the fields you care about.
Migrate a Data Studio report
Recreate the attached Google Data Studio report as a dashboard. Match the page structure and the order of the charts. Page 1 is the paid media overview with spend, clicks, CPC, and ROAS scorecards, followed by a daily spend trend and a campaign breakdown table.
Migrate a Sheets report
Rebuild the attached Google Sheets report as a dashboard. The top row of cells are KPI scorecards, the chart below is monthly revenue, and the table at the bottom is top products by revenue.
Migrate and improve at the same time
Recreate the attached report, but replace the pie chart with a bar chart and add a period-over-period comparison to every scorecard.
Reuse the layout with a different source
Use the attached report as a layout reference only. Build the same structure against my GA4 account instead of the analytics source in the reference.
Test the Migration with Sample Accounts
You can try the whole flow before pointing it at live customer data. Sample accounts appear in the Accounts selector alongside your connected ones, labeled [Sample Account] {Connector} with a violet Sample badge. When your team has both kinds, the selector separates them under Connected and Sample only headings.
Sample accounts are available for Facebook Ads, Facebook Insights, Instagram Insights, LinkedIn Pages, GoHighLevel, Shopify, WooCommerce, Reddit Ads, TikTok Ads, TikTok Organic, Amazon Seller, and Amazon Ads.
Migrate Reports Longer Than 8 Pages
The 8-page budget covers most reports. Migrate a longer one in stages:
Generate the Core Pages
Upload the most important pages, up to eight, and generate the dashboard.
Add the Remaining Pages with Dash
Open the dashboard and ask Dash to build each remaining page. For example: "Add an audience analytics page with sessions by channel, device breakdown, and top landing pages." Dash designs a laid-out page and adds it live.
Reorder the Pages
Ask Dash to reorder them, for example "Move the Overview page first", or drag the tabs into place yourself. See Layout & Pages.
After the Migration
A migrated dashboard is a starting point. Run through these checks before you share it:
- Verify the numbers. Compare several widgets against the original report over the same date range and accounts.
- Fix mismatched fields. Where AI chose a near-match metric or dimension, open the widget and select the right field. See Widgets & Charts.
- Check for missing widgets. A widget whose query can't be validated against your accounts is left out rather than added broken. A chart from the original may therefore be absent.
- Match the default date range. Set the dashboard to the period your old report ran on. See Data, Dates & Filters.
- Recreate calculated fields. Formulas your old report worked out for itself need rebuilding. See Recreate Calculated Fields below.
- Replace the old delivery. Swap a scheduled spreadsheet email for a live share link or a scheduled briefing.
Recreate Calculated Fields
Rebuild a Data Studio calculated field or a Sheets formula column as a custom field, defined once and then available to every dashboard and goal:
| In your old report | Rebuild it as |
|---|---|
| A calculated metric such as CPA, ROAS, or conversion rate | A formula, for example spend ÷ conversions |
A CASE statement or channel grouping | Conditional rules on a dimension |
| A metric combined across several platforms | Blending across sources |
| A value extracted from a campaign naming convention | Split text |
Build one on the Custom Fields page, or ask Dash - "Create a custom metric called CPA as spend ÷ conversions" - then point the affected widgets at it.
Troubleshooting
| What you see | What it means | What to do |
|---|---|---|
You can add up to 8 reference pages. | The upload would exceed the reference-page budget. | Remove a page, or upload a shorter PDF. |
Each PDF must be 25 MB or smaller. | The PDF is too large. | Re-export it at a lower quality, or split it. |
Each image must be 5 MB or smaller. | The image is too large. | Re-save the screenshot as JPEG to compress it. |
Couldn't read that PDF. or Couldn't process that PDF. | The PDF couldn't be processed. | Export it again from the source tool, or upload screenshots instead. |
| A dropped file doesn't appear | The format isn't supported. | Use PDF, JPEG, PNG, or WebP. |
Select at least one account for AI to pull data from. | No source account has been selected. | Pick at least one account under Accounts. |
Pick a theme, or switch the theme option above. | My theme was selected without a theme. | Pick a theme, or switch to Let AI decide or None. |
| The request times out with a 504 | Generation didn't finish inside the gateway's timeout window. | Wait a minute and check your dashboard list before retrying, as the generation may still complete. |
| The layout doesn't match the original | AI may not have had enough visual or prompt context. | Confirm Use this report to… is set to Recreate, re-upload a clean view-mode reference, and describe the page structure in the prompt too. |
| Widgets are empty | The accounts may have no data for the date range, or the field may not exist for that connector. | Check the account, the date range, and the widget's metric and dimension. |
Benefits
No rebuild from scratch: An existing report's structure transfers in one step instead of widget by widget.
Live instead of static: The migrated dashboard reads from your connected data, so there's no monthly export to repeat.
Familiar structure: Clients keep the report layout they already understand, on a platform you can share, brand, and automate.
Next Steps
- Creating a Dashboard - The three ways to start a dashboard
- Editing with Dash - Refine the migrated result by asking
- Widgets & Charts - Correct metrics and dimensions by hand
- Custom Fields - Rebuild formulas, conditional rules, and blended fields
- Share and export dashboards - Replace your old report delivery