

Amazon Vendor Central

The Amazon Vendor Central connector gets your Amazon Vendor Central data into Google Sheets and Google Data Studio. Use it to track your key metrics in a spreadsheet or a Google Data Studio report.
What you can report on
- Sales: ordered revenue, ordered units, shipped revenue, shipped cost of goods sold (COGS), shipped units, and customer returns
- Traffic: glance views
- Inventory: received inventory, open purchase order units, sellable and unsellable on-hand inventory, aged inventory, vendor lead time, confirmation rate, and sell-through rate
- Net pure product margin
- Demand forecasts: mean, P70, P80, and P90 forecast units
- Performance by ASIN and by marketplace
Prerequisites
- An Amazon Vendor Central account that is enrolled in Amazon Brand Registry
- Admin access to that Vendor Central account
How to create a connection
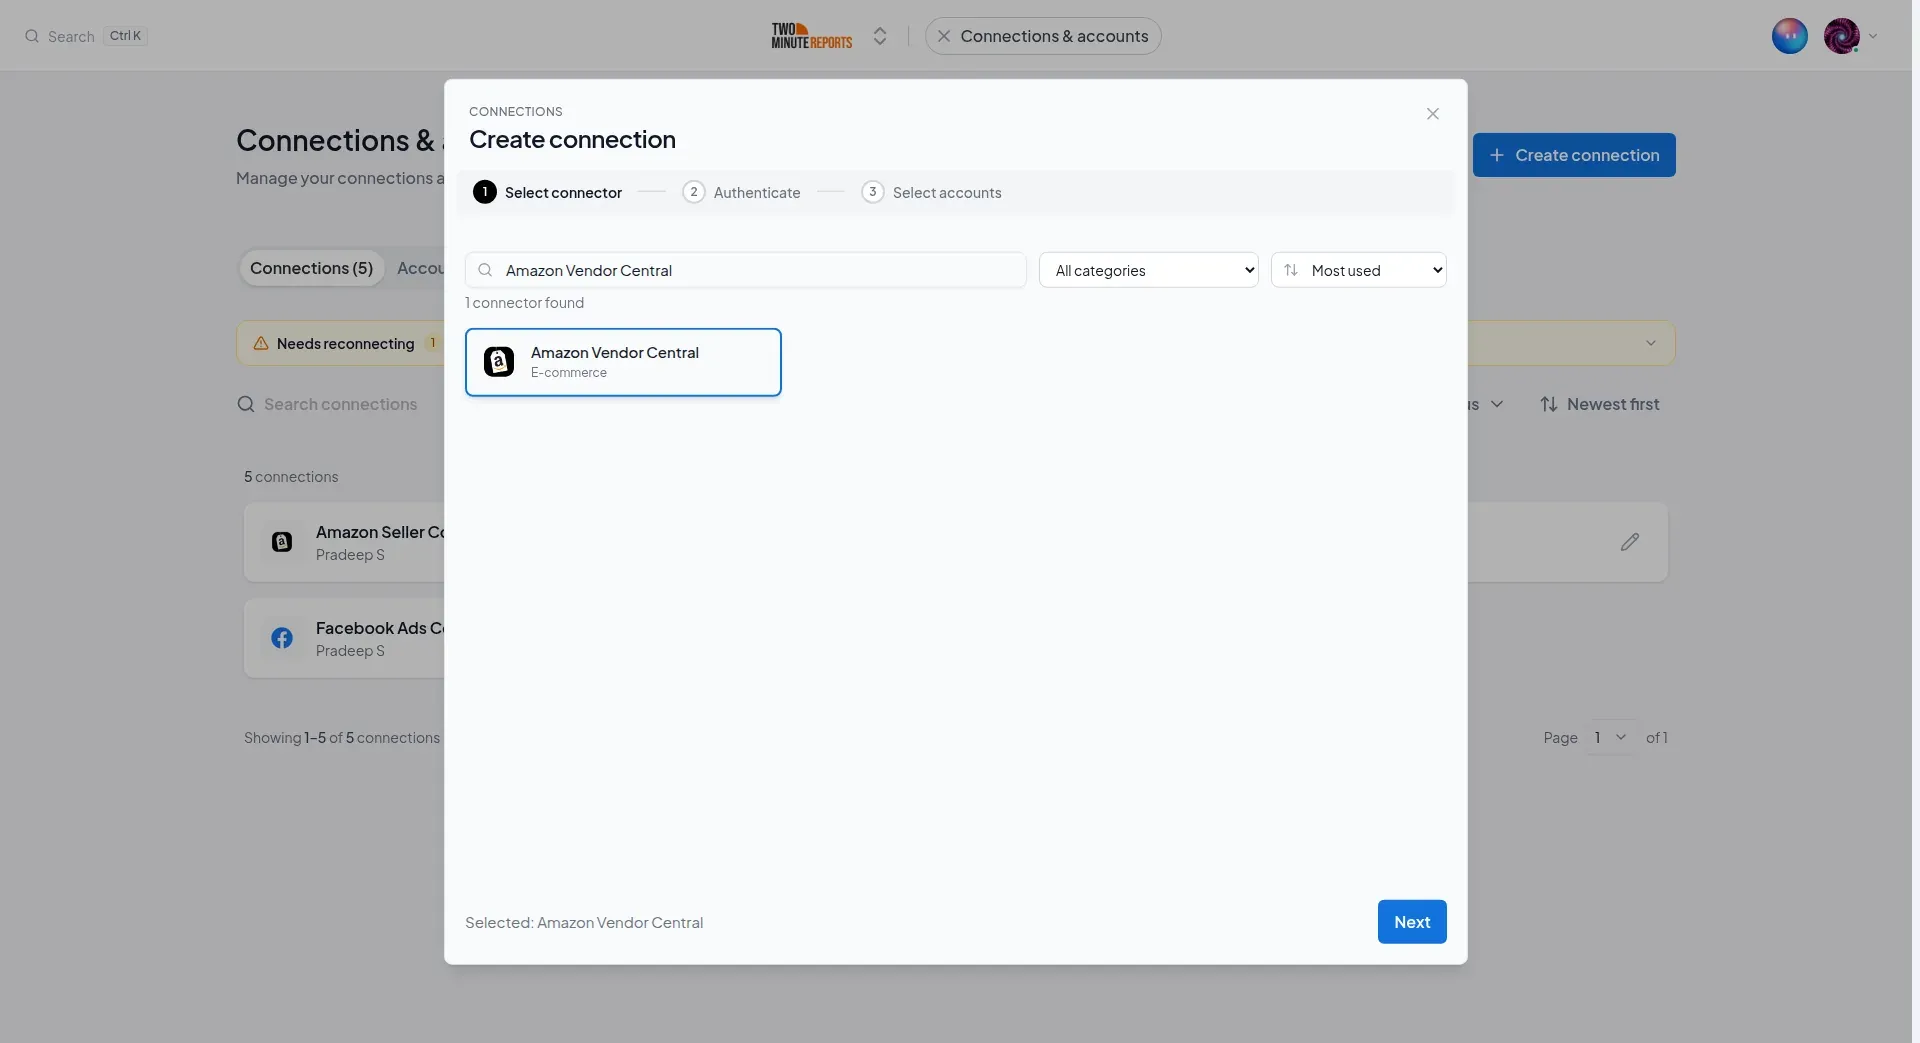
- In the Hub, open Connections & accounts.
- Select Create connection.
- Select Amazon Vendor Central in the connector list.
- Select Next.
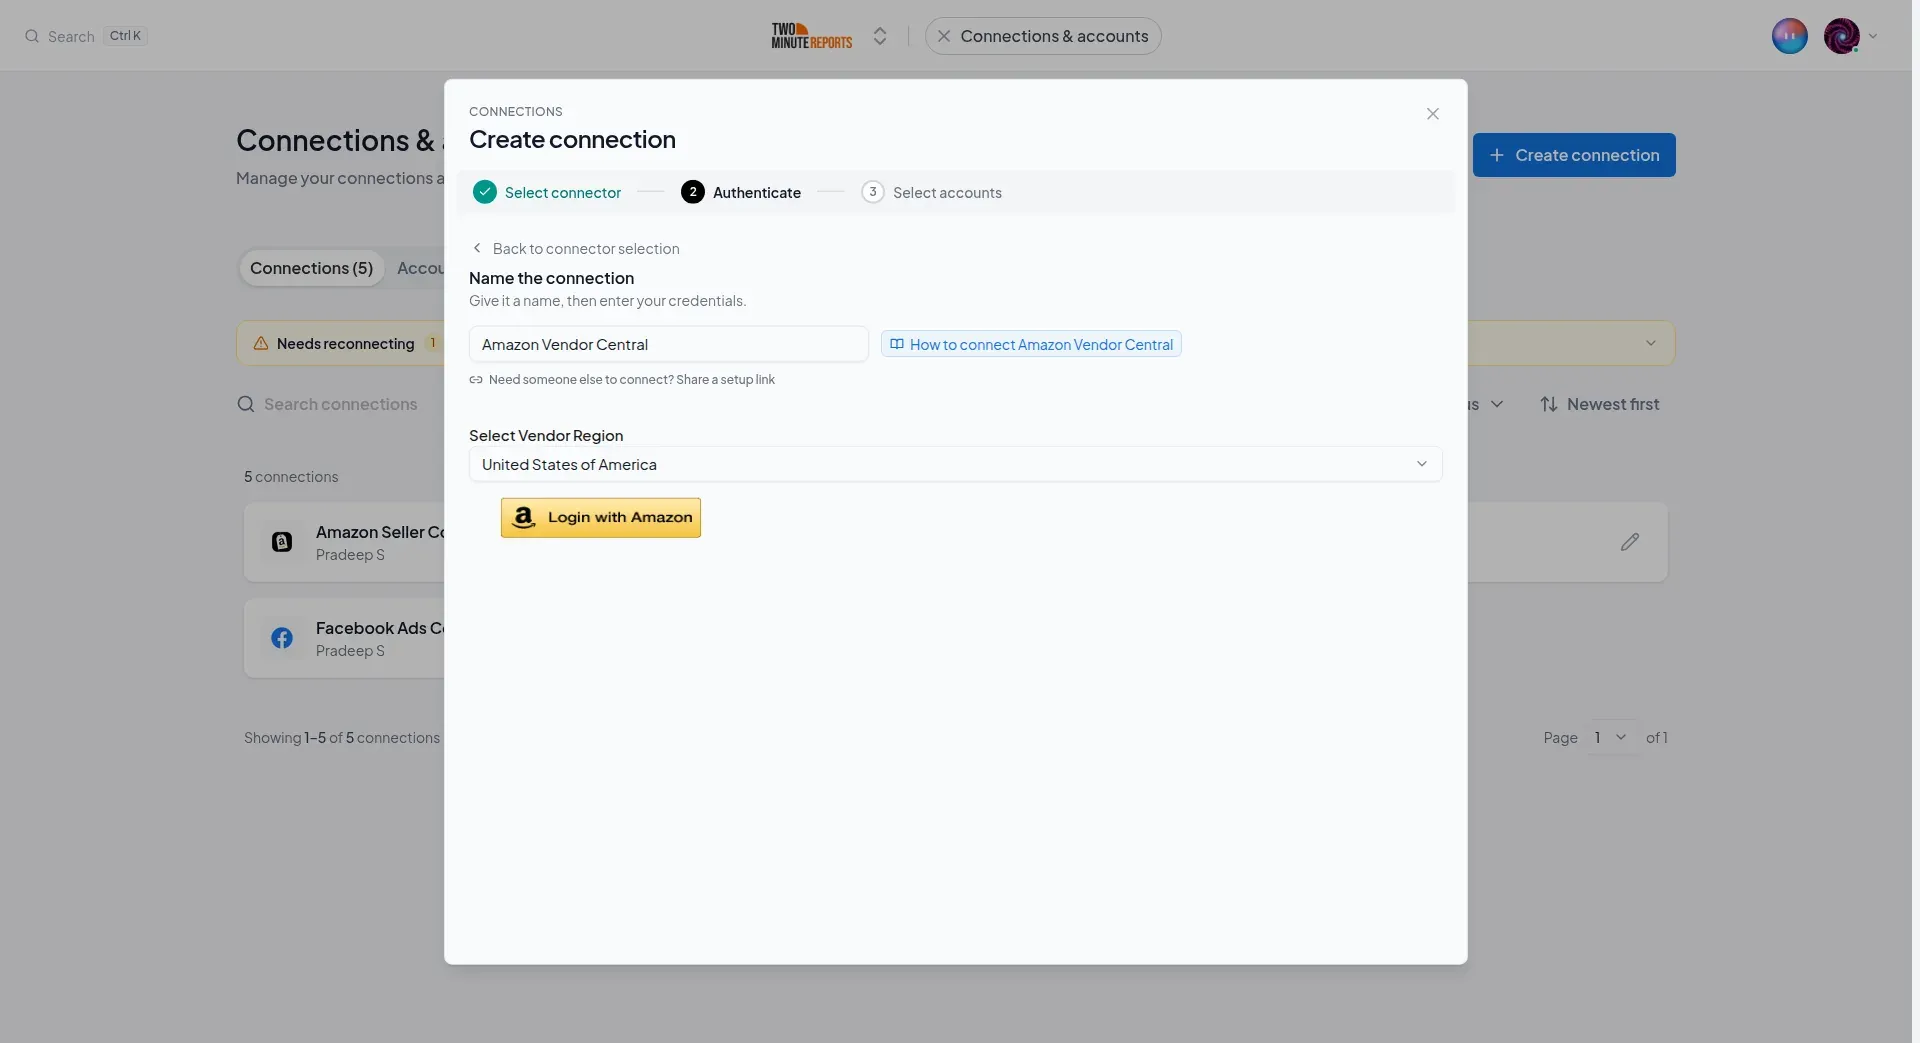
- In Name the connection, enter a name.
- In Select Vendor Region, select the marketplace that you want to report on.
- Select Login with Amazon. Sign in to Vendor Central, then allow Two Minute Reports access.
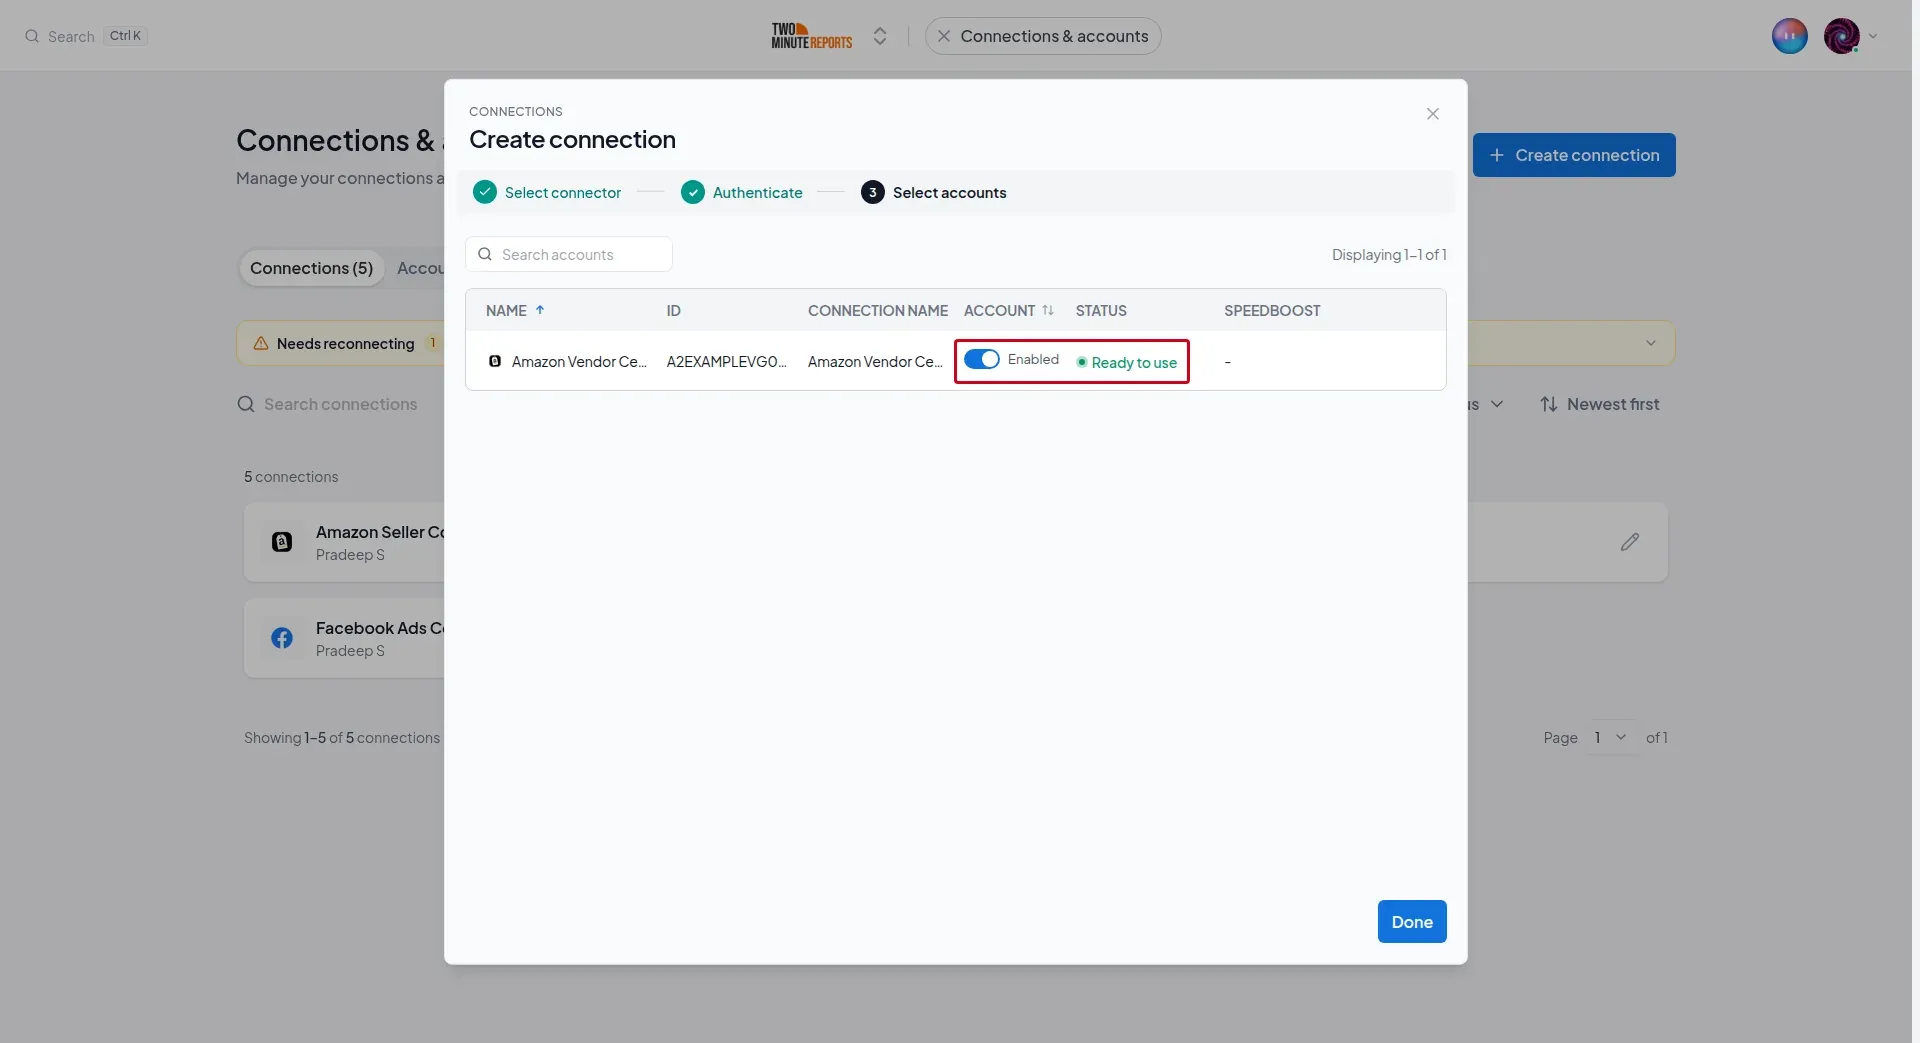
- Enable the account. The account name shows the connection name and the marketplace.
- Select Done.
How to get Amazon Vendor Central data into Google Sheets or Google Data Studio
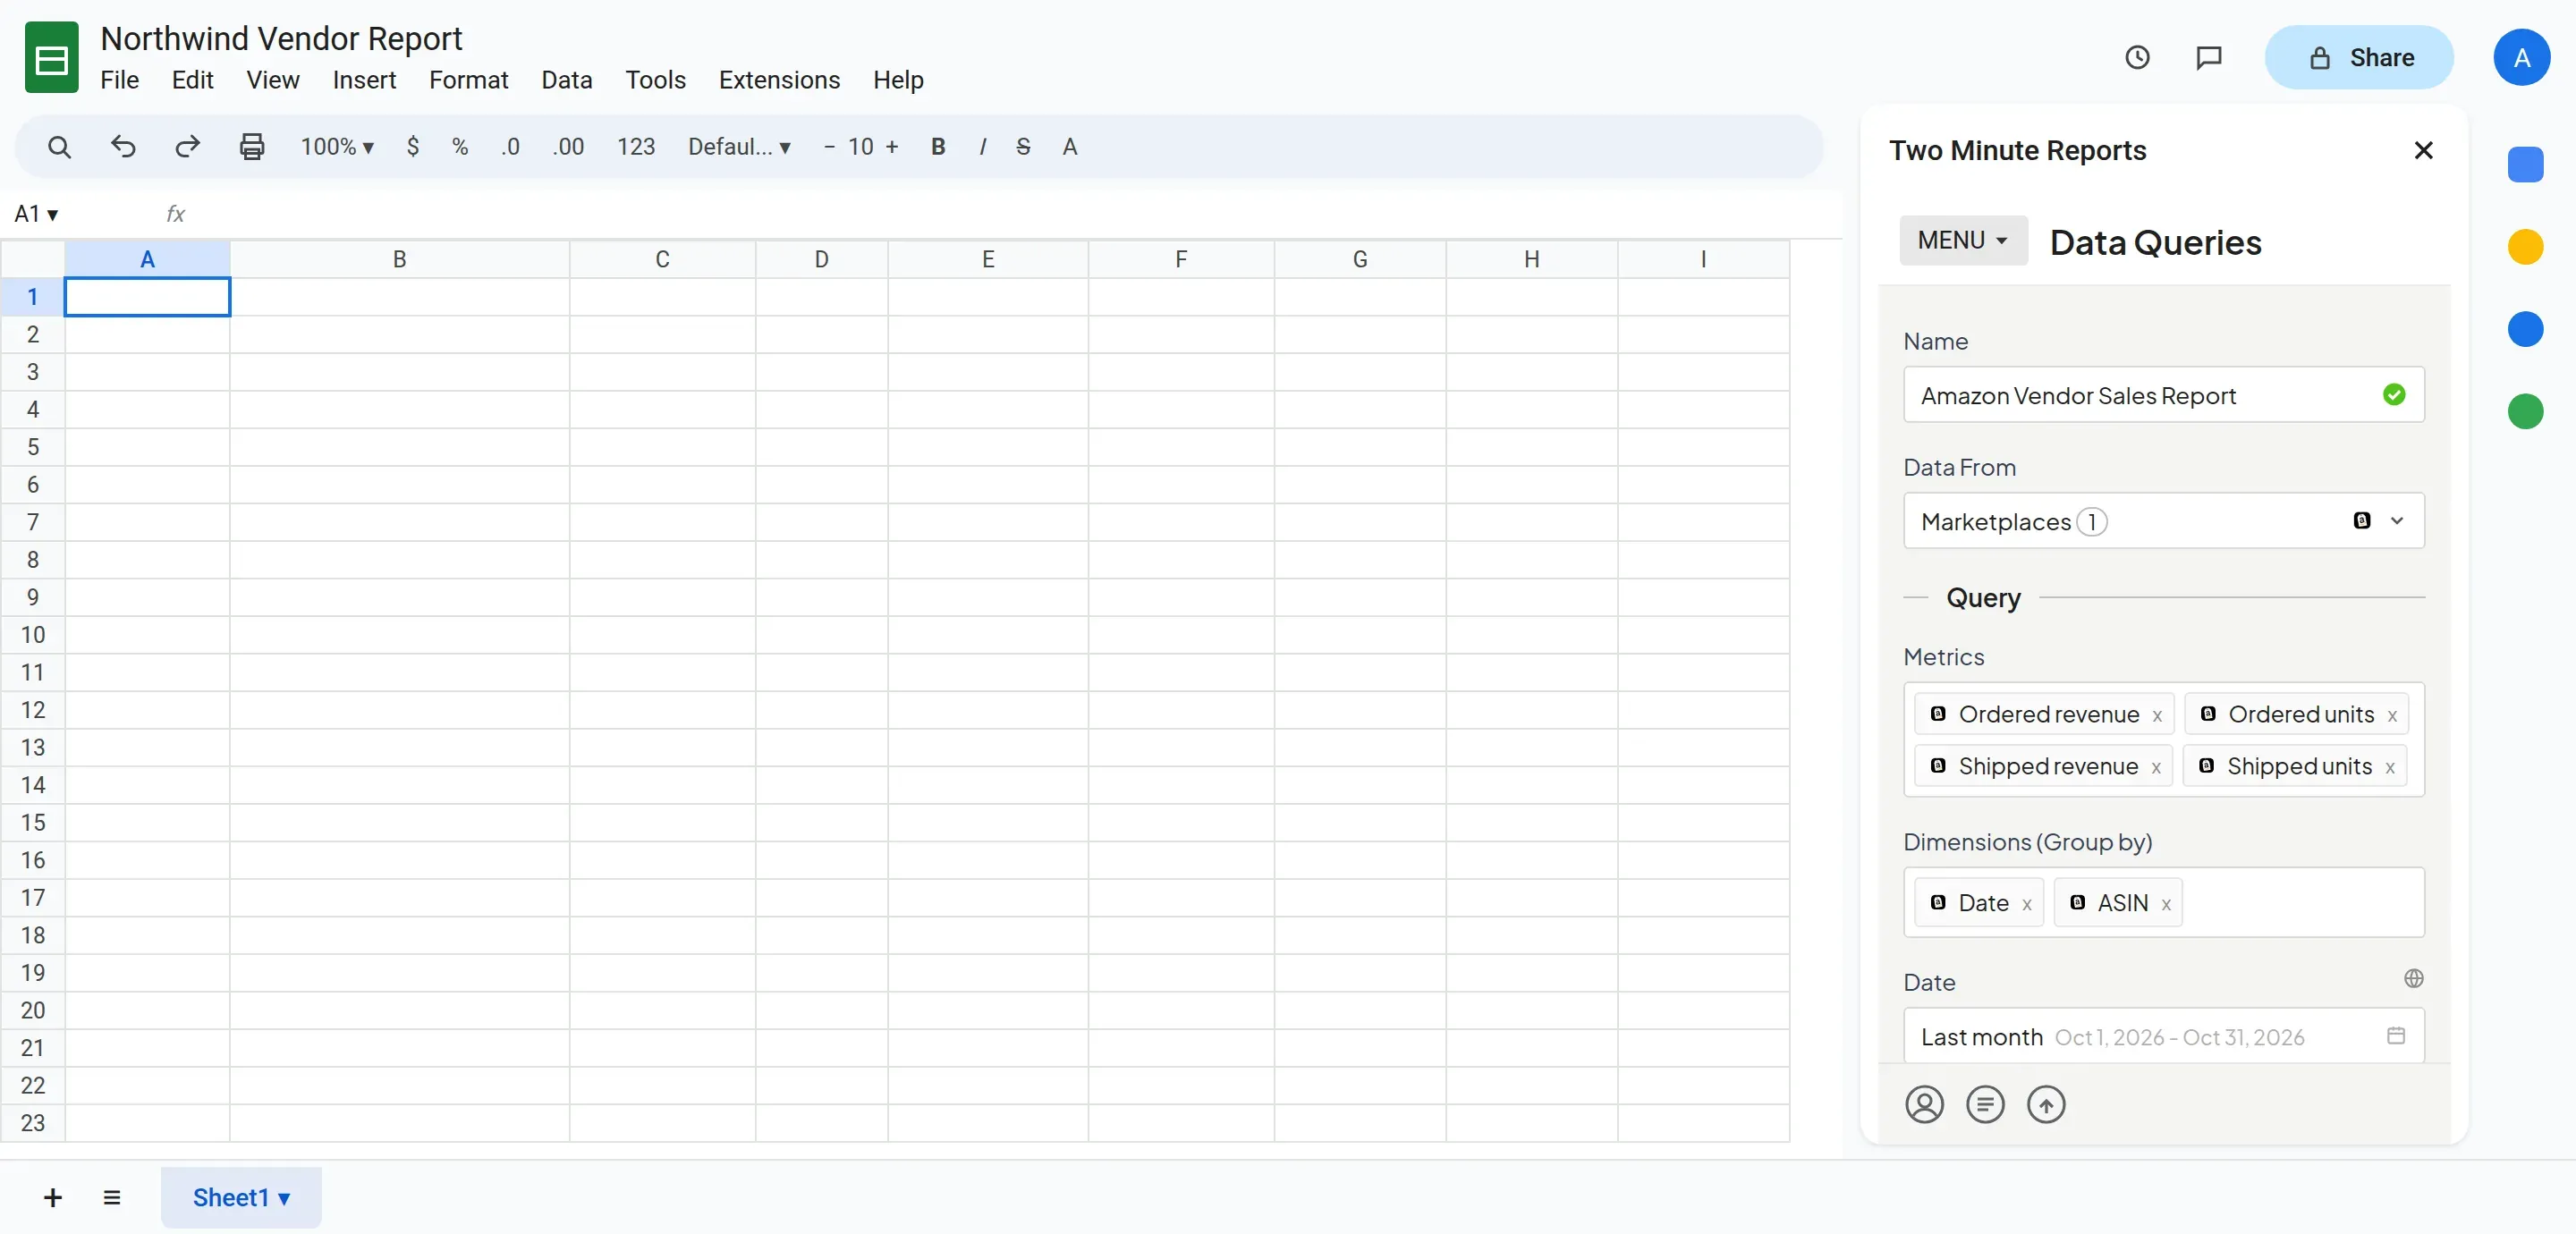
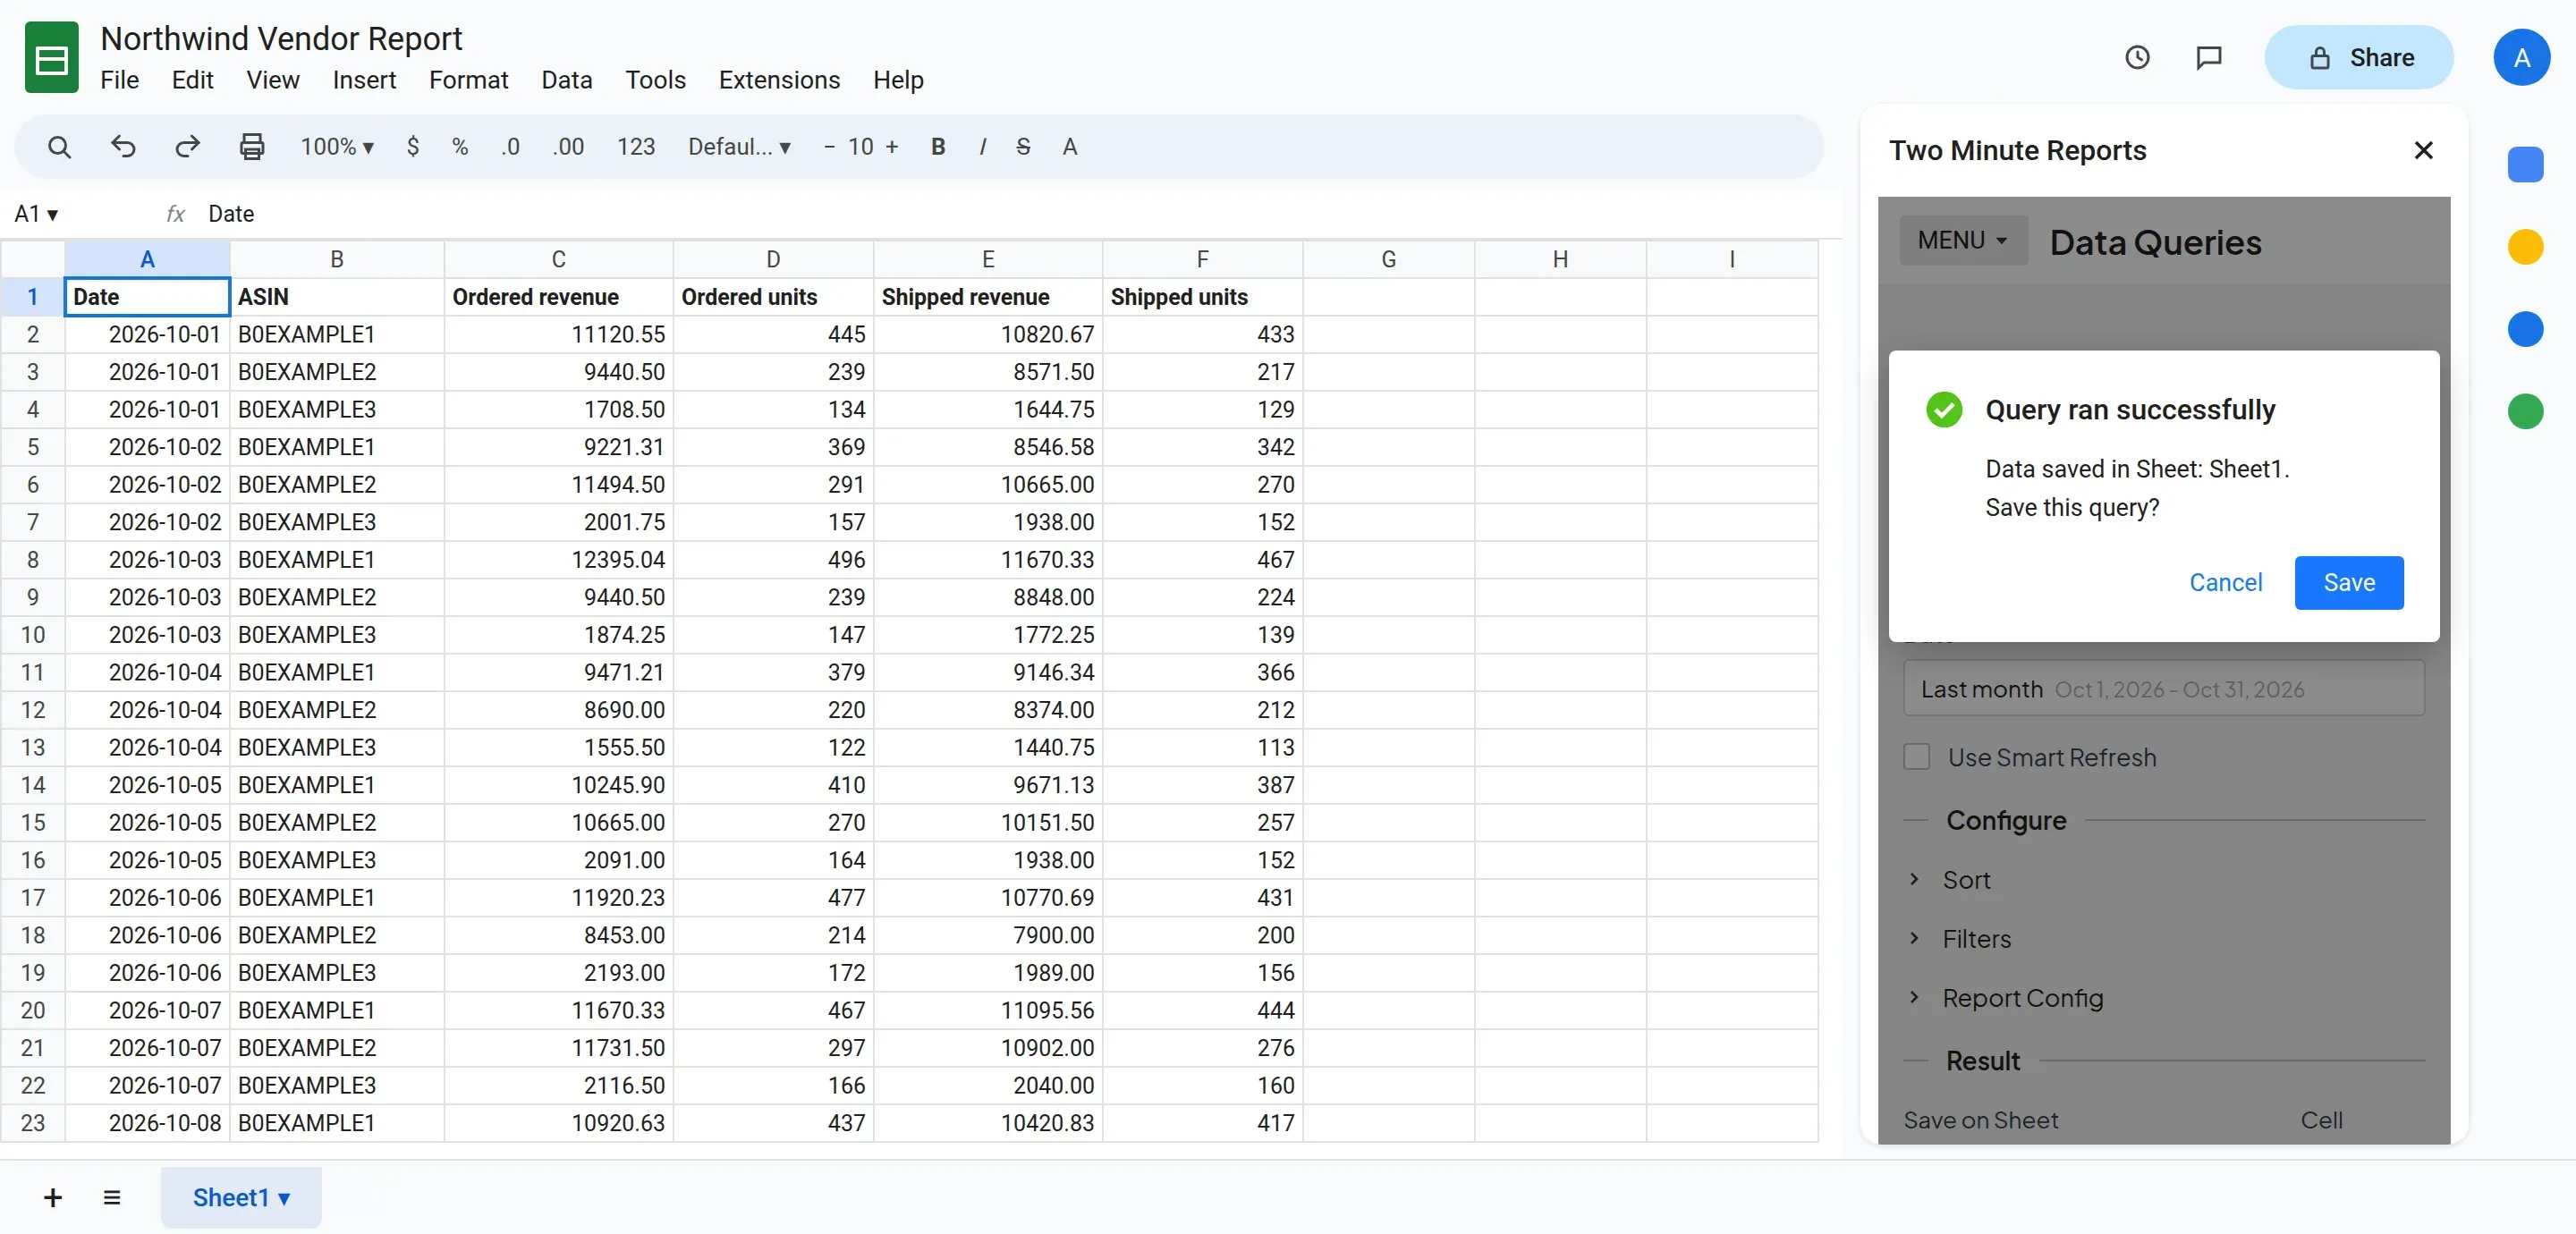
To get Amazon Vendor Central data into Google Sheets:
- In the Two Minute Reports sidebar, open Data Queries.
- Select Add.
- Select the marketplaces you want to report on. You can select more than one.
- Select your metrics and dimensions. Use the fields of one report only. See One report in each query.
- Select a date range that ends 3 or more days before today. See Data freshness.
- Set sorting and filters if you need them.
- Select Run query. Two Minute Reports adds the data to your sheet.
To get Amazon Vendor Central data into Google Data Studio:
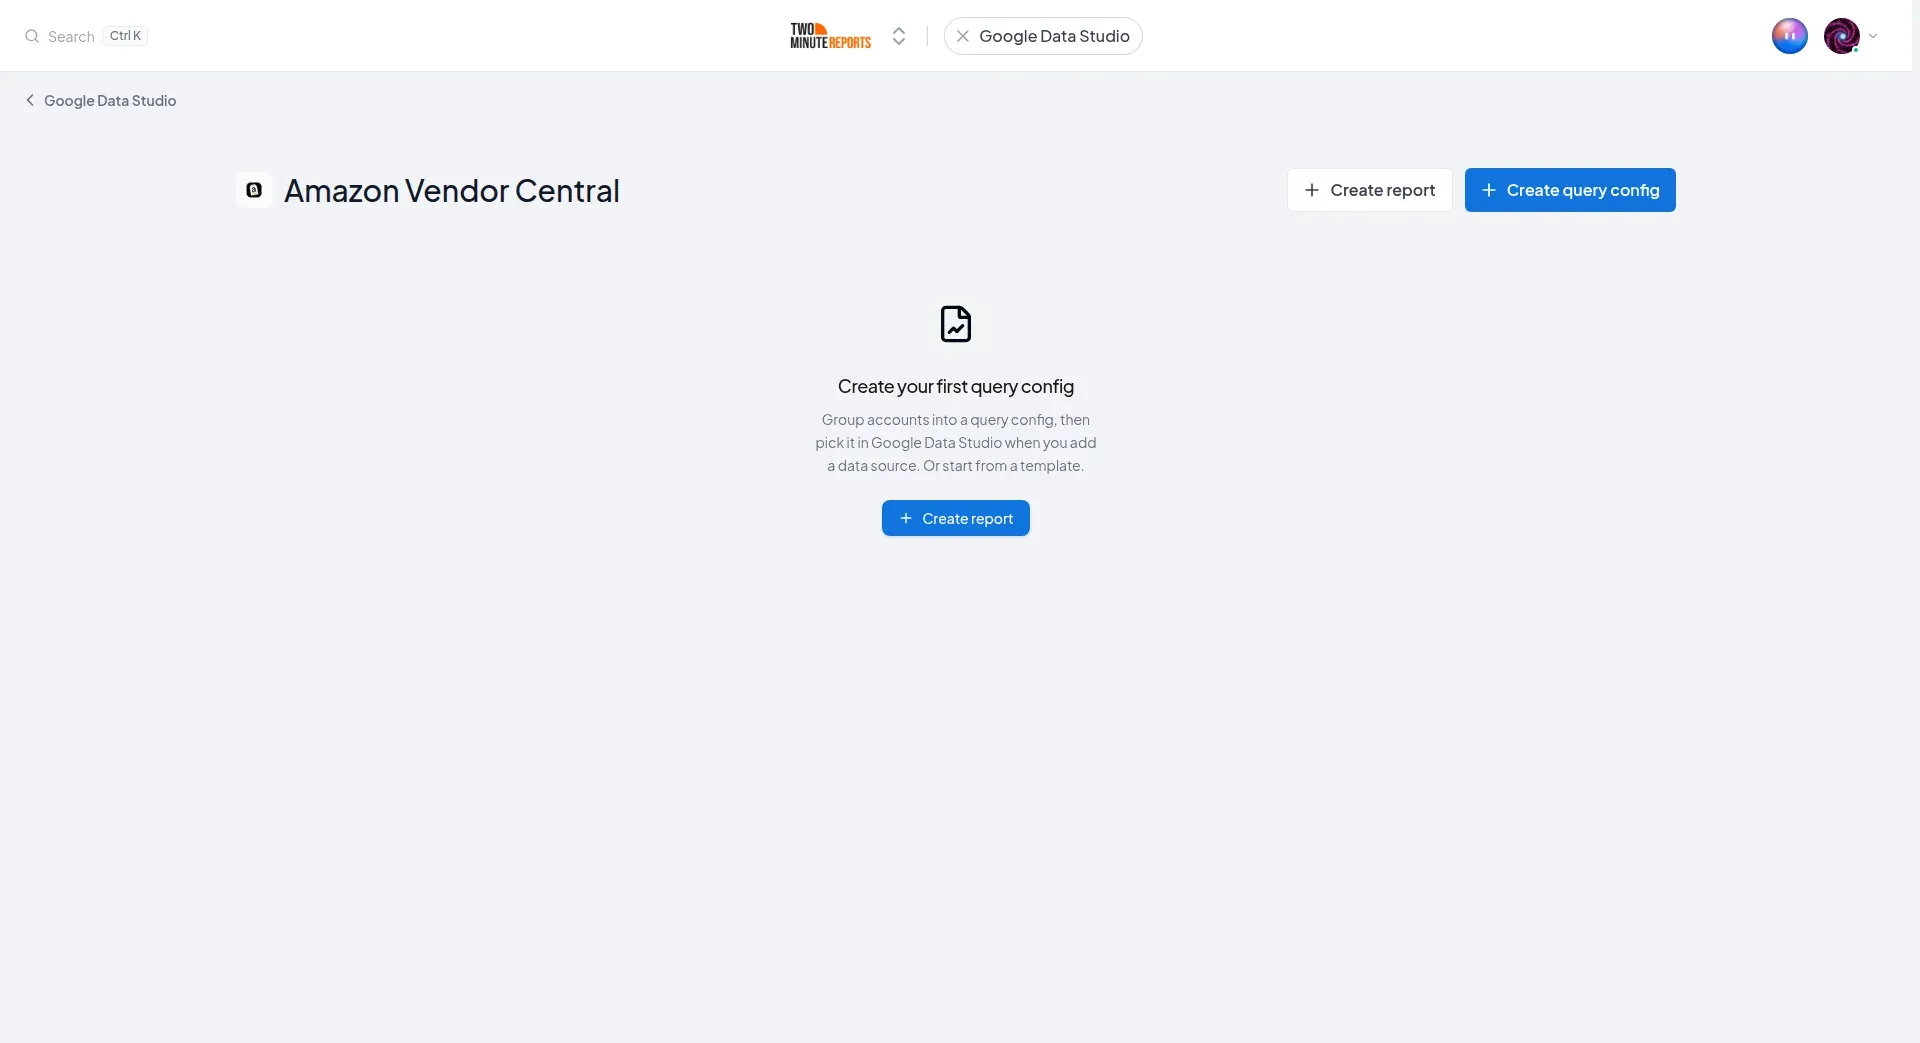
- In the Hub, open Google Data Studio › Amazon Vendor Central.
- Select Create report.
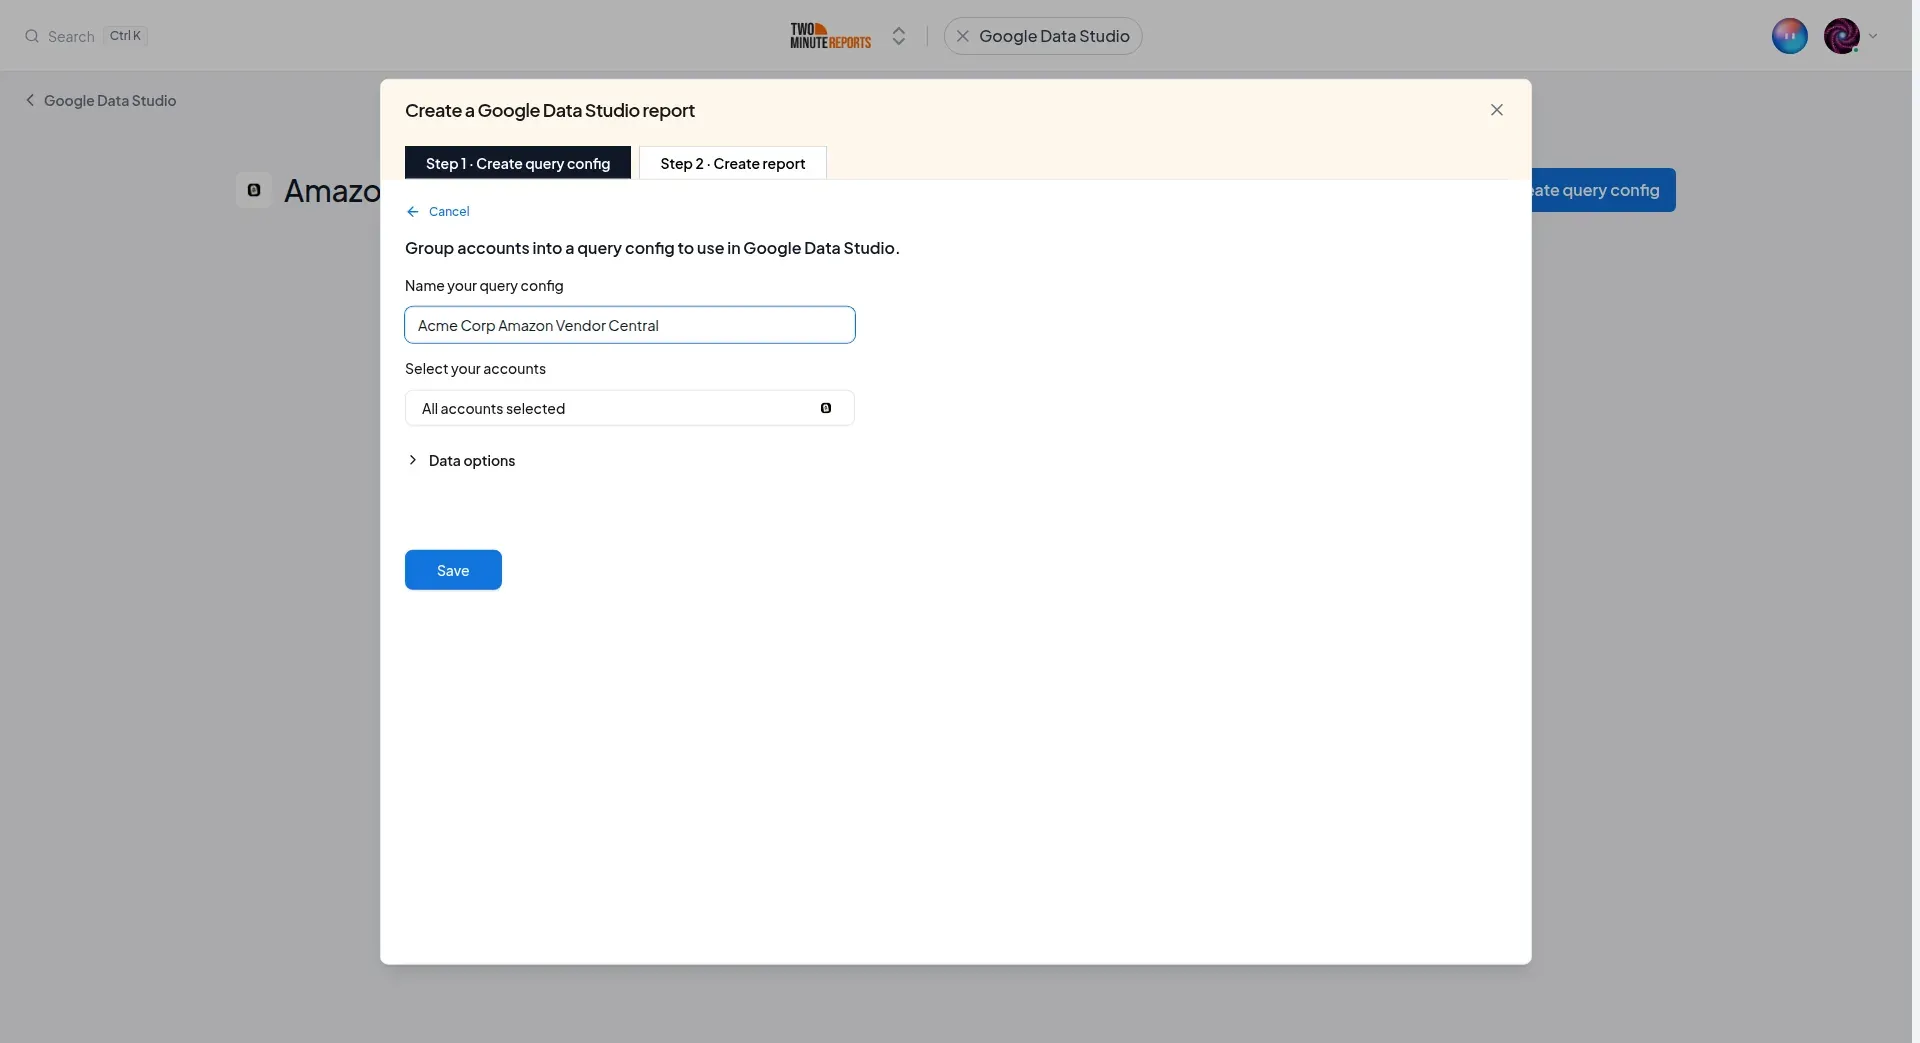
- Select or create a query config:
- To use a query config you have: select it in Choose your query config. Then select Save.
- To create a query config: if you already have one, first select Create new query config in the list. Enter a name in Name your query config, and select the marketplaces in Select your accounts. Select Save.
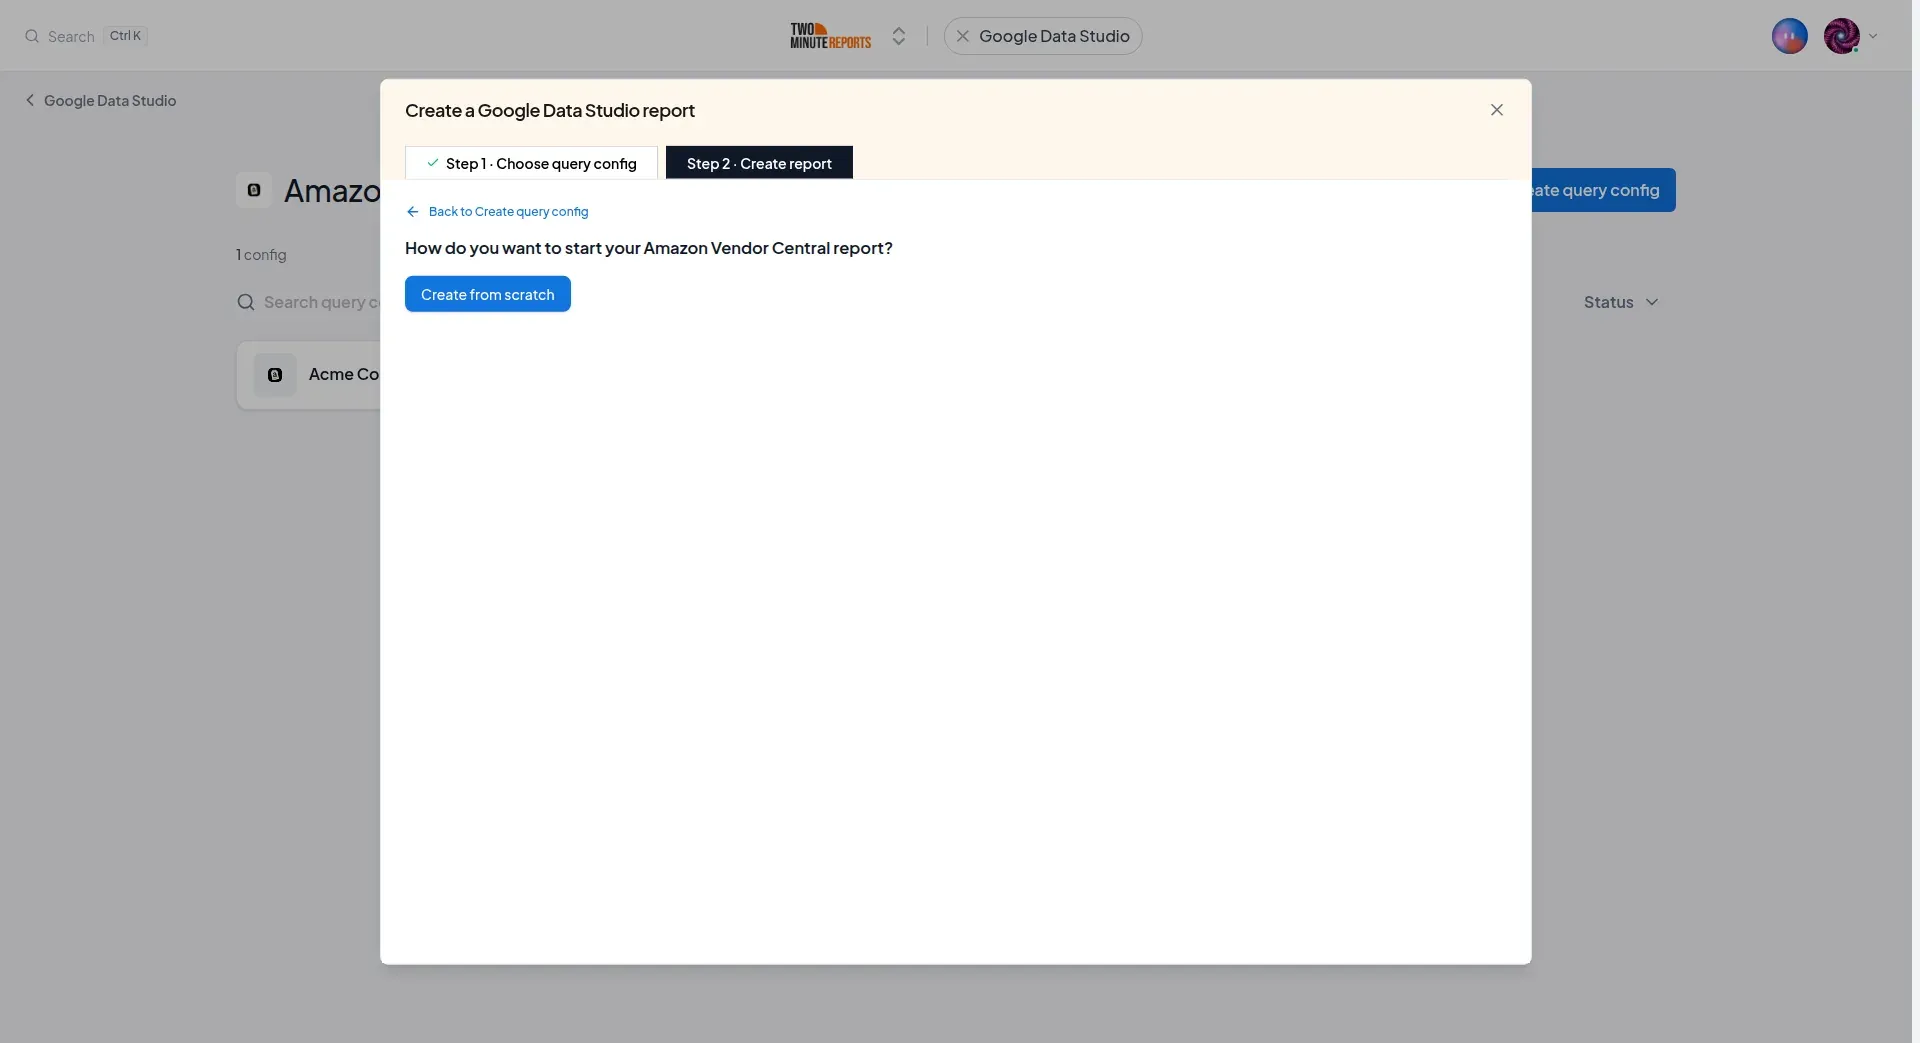
- Select Create from scratch.
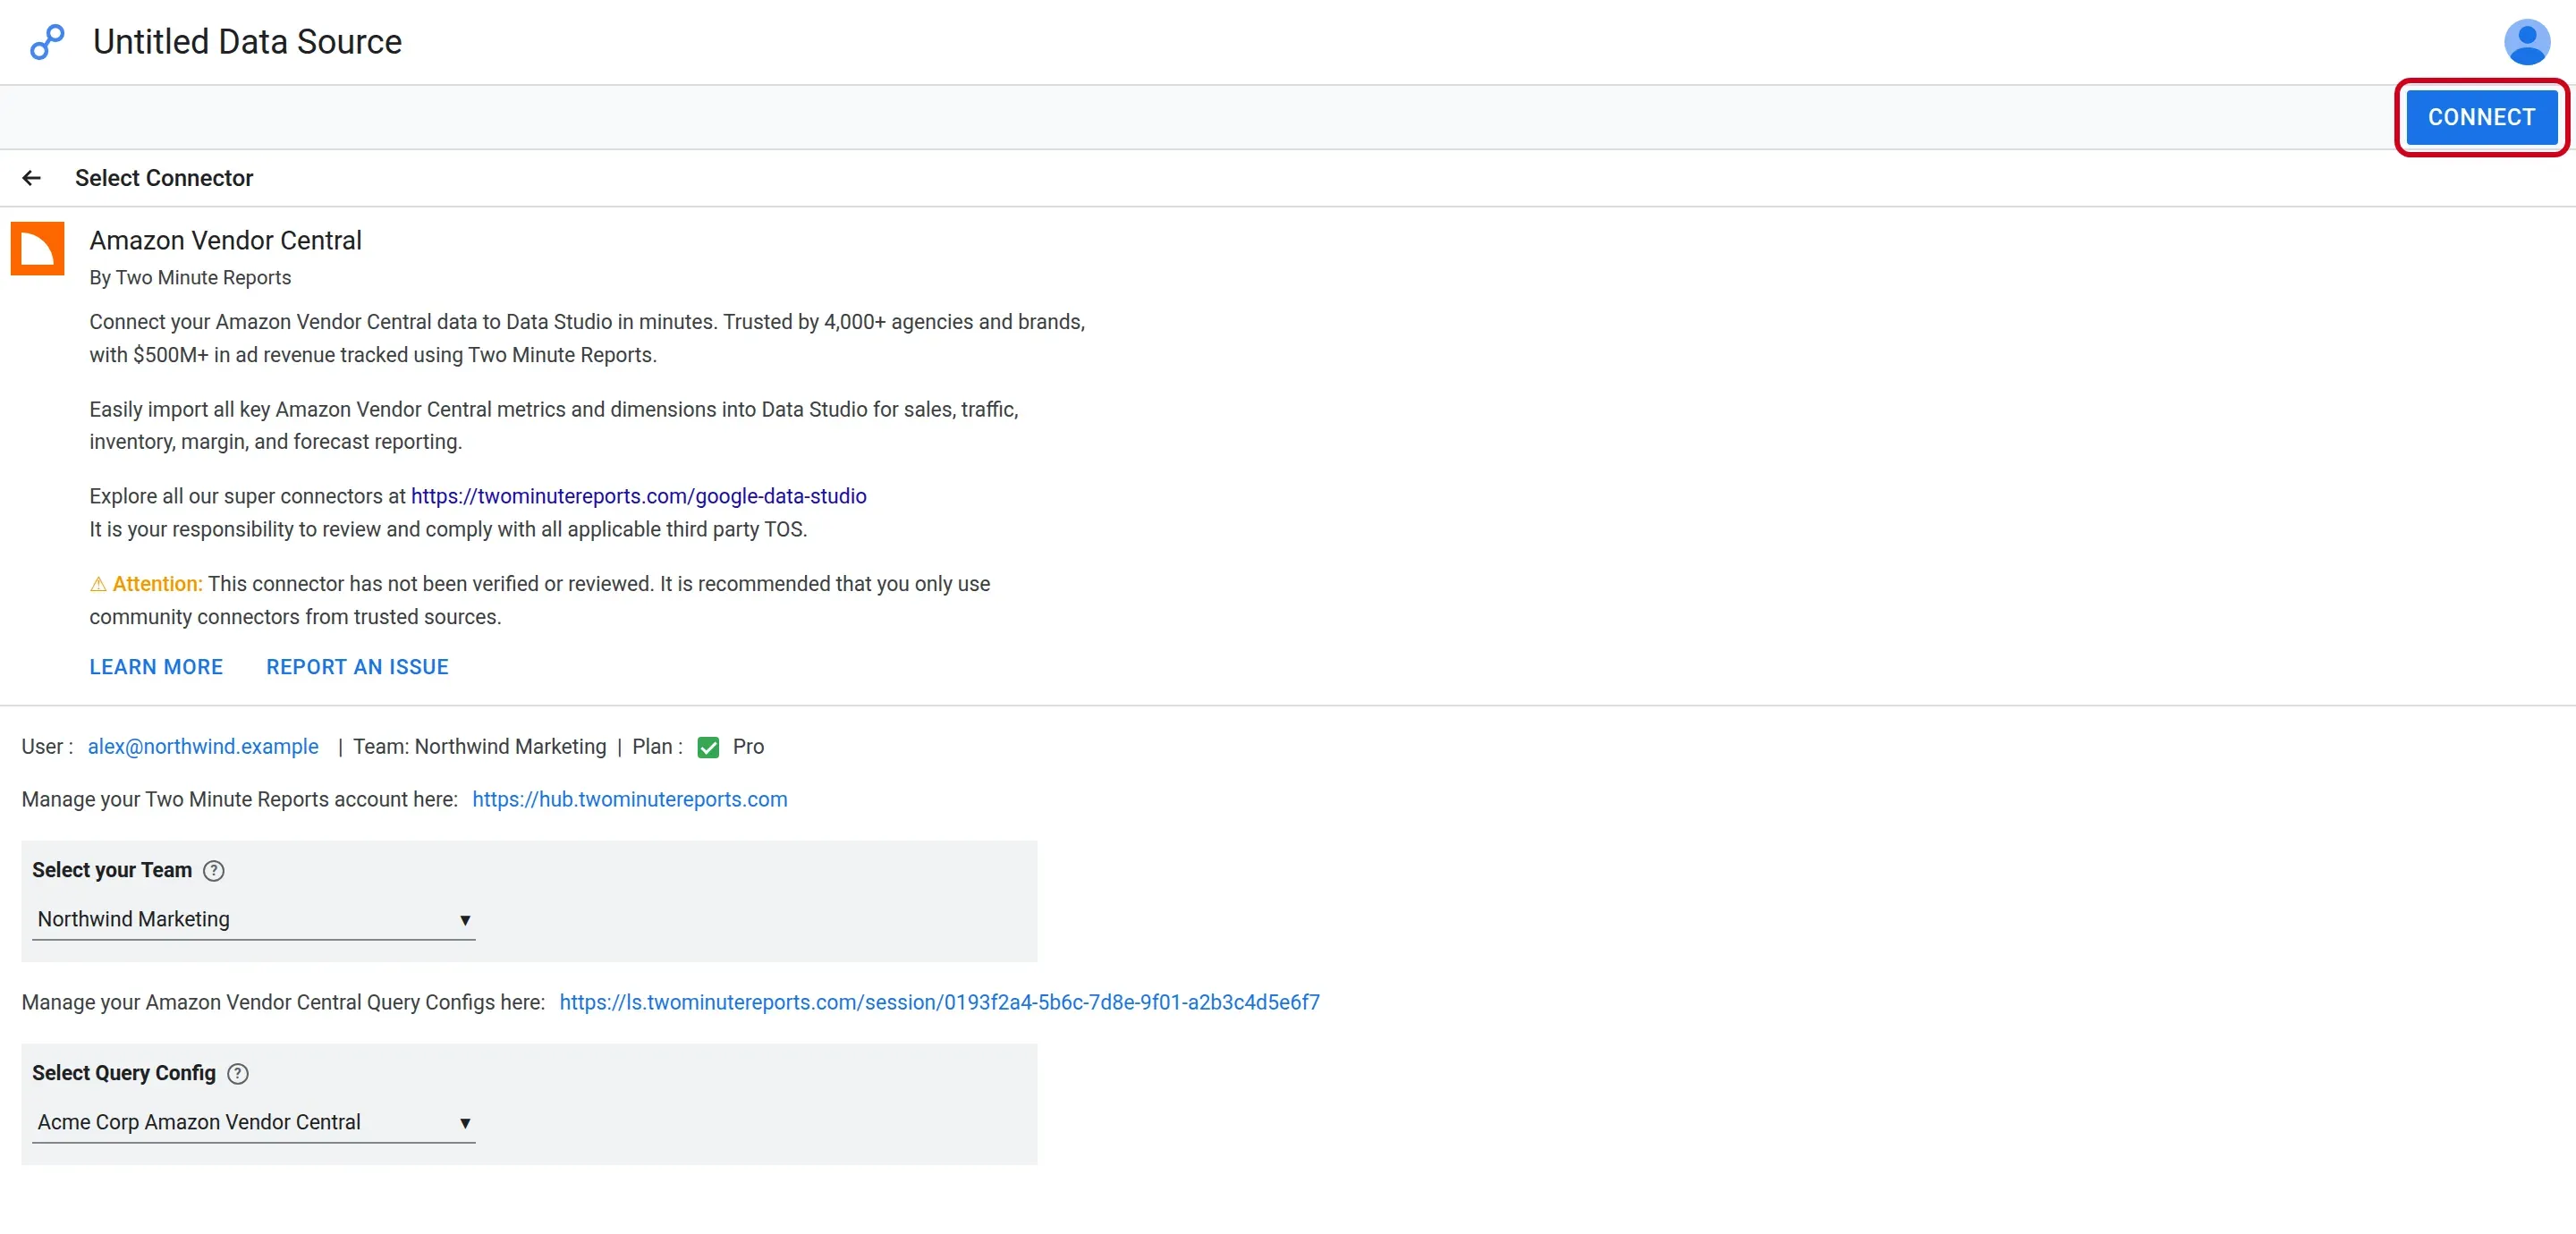
- Looker Studio (formerly Google Data Studio) opens in a new tab, with the Two Minute Reports connector. If you are in more than one team, select your team in Select your Team.
- In Select Query Config, select your query config.
- Select Connect in the top-right corner.
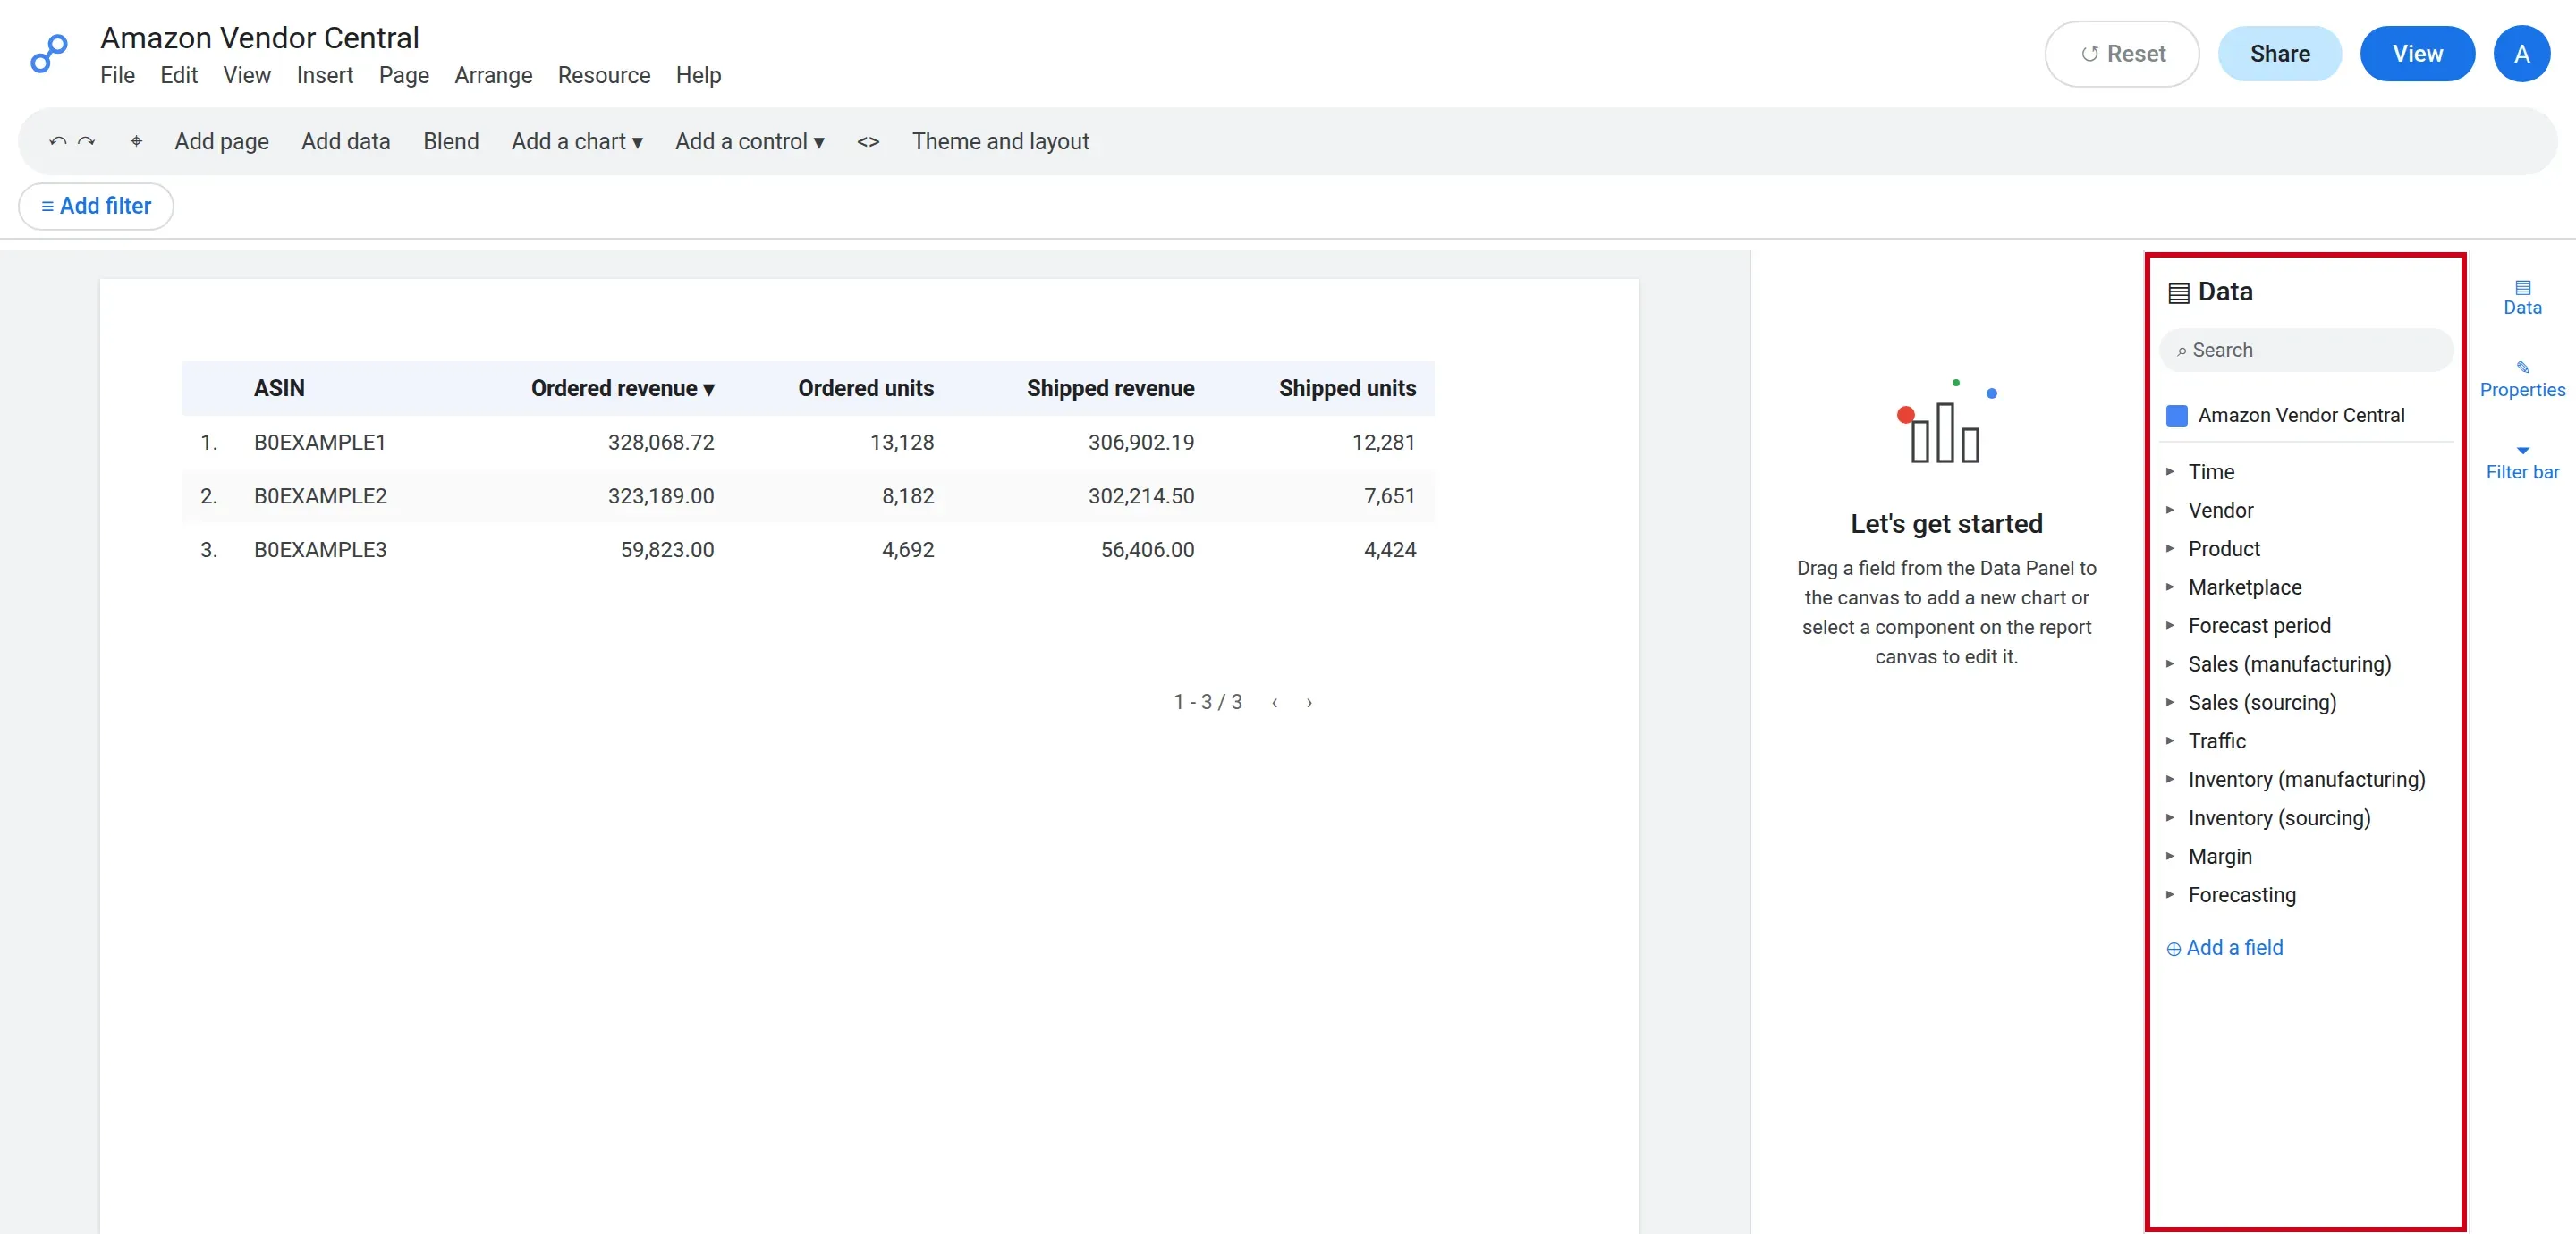
- In your new report, add Amazon Vendor Central metrics and dimensions to the canvas.
Good to know
Manufacturing and sourcing views
Amazon gives sales and inventory data in two views:
- Manufacturing shows the products that you make, also when Amazon gets them from a different supplier.
- Sourcing shows the products that Amazon gets from you.
Each view has its own field group: Sales (manufacturing) and Sales (sourcing), and Inventory (manufacturing) and Inventory (sourcing). Ordered revenue and Ordered units are in Sales (manufacturing) only.
One report in each query
Each metric group comes from a different Amazon report:
- Sales (manufacturing)
- Sales (sourcing)
- Traffic
- Inventory (manufacturing)
- Inventory (sourcing)
- Margin
- Forecasting
You can use the metrics of one group only in a query. A filter must also use a field of the same group. To get data from two groups, make one query for each group.
The Forecasting metrics show the demand that Amazon expects in the future. You cannot use them with the Time dimensions. Use the Forecast period dimensions instead.
Data freshness
Amazon publishes the data for a day 72 hours after the day ends. Because of this:
- If your date range end date is within the last 3 days, Two Minute Reports moves the end date back to the most recent day that Amazon published.
- If all of your date range is within the last 3 days, for example Today or Yesterday, the query shows an error.
Amazon reports each day in Pacific time. The first query for a new account can take some minutes, because Amazon makes each report on request.
Rates and averages
Average vendor lead time (days), Vendor confirmation rate, Sell through rate, and Net pure product margin are averages of the daily values. For a week, a month, or a year, the value can be different from the value in Vendor Central.
Stock levels
These inventory fields show the stock on one day, not the activity in a period:
- Sellable on hand inventory units and Sellable on hand inventory cost
- Unsellable on hand inventory units and Unsellable on hand inventory cost
- Aged 90+ days sellable inventory units and Aged 90+ days sellable inventory cost
- Unhealthy inventory units and Unhealthy inventory cost
- Open purchase order units
- Unfilled customer ordered units
Use them with the Date dimension. For a week, a month, a year, or a date range with no Date dimension, Two Minute Reports adds the values of the days together, so the value is higher than your stock. For example, Sellable on hand inventory units by ASIN for Last 30 days is approximately 30 times your stock.
Net received inventory units and Net received inventory cost show the inventory that Amazon received in the period. You can use them with any time dimension.
Troubleshooting
- "Amazon has not published this reporting period yet": use a date range that ends 3 or more days before today. See Data freshness.
- "This Amazon Vendor Central account cannot access retail analytics reports": make sure that the vendor is enrolled in Amazon Brand Registry. Then edit the connection, and sign in again with a user that has admin access to the Vendor Central account.
- "Amazon Vendor Central access was revoked or expired": Amazon asks you to authorize Two Minute Reports again every 365 days. Edit the connection, select Login with Amazon, and save the connection.
- "The filter on '…' belongs to a different Amazon Vendor Central report than the selected fields": change the filter to a field from the same group as your metrics. See One report in each query.
If you need help, contact [email protected].