

Create a report
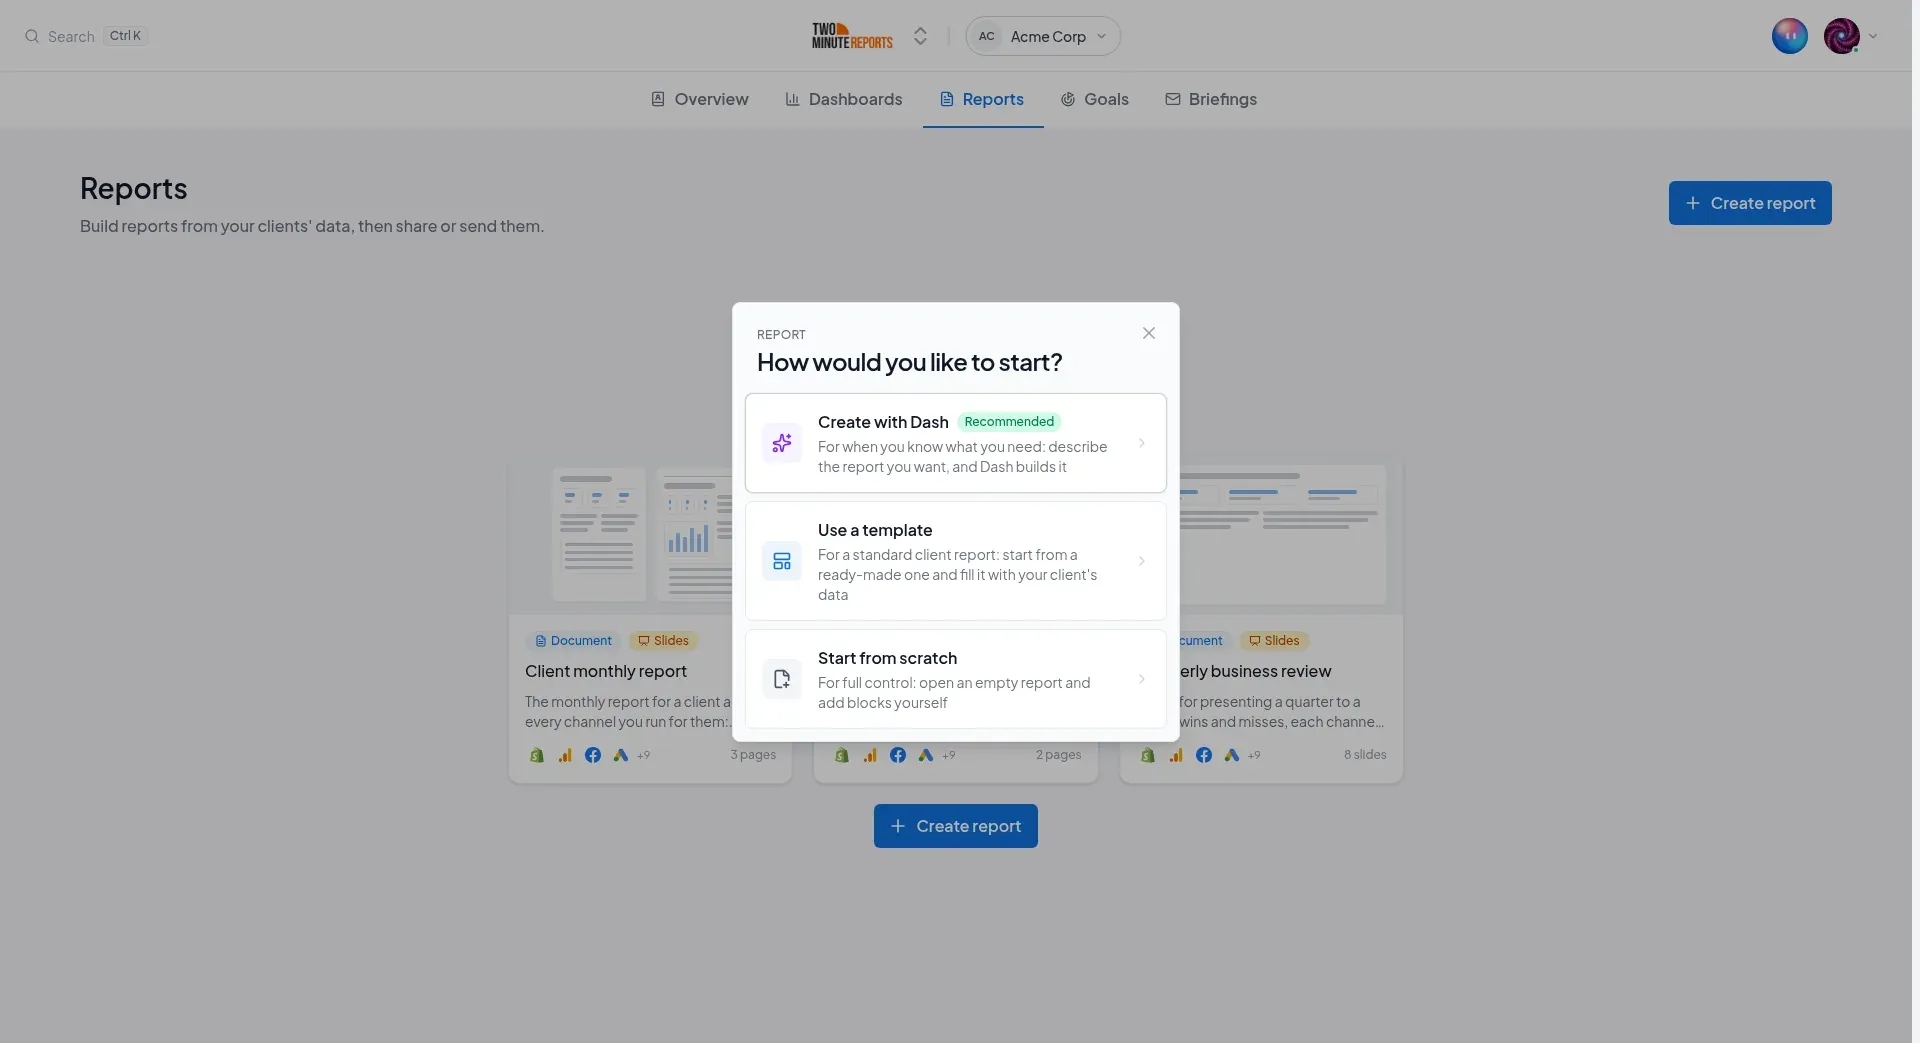
Open Reports and select Create report. Under How would you like to start?, choose one:
- Create with Dash (recommended): describe the report, check Dash's plan, and Dash builds it.
- Use a template: start from a ready-made report and fill it with your client's data.
- Start from scratch: open an empty report and add blocks yourself.
The dialog then has three steps: Layout, Describe (or Template), and Details. Start from scratch has no middle step.
1. Layout
Choose Document (A4 pages to read) or Slides (16:9 slides to present). You can't change the layout later.
2. Describe it, or choose a template
Describe (Create with Dash)
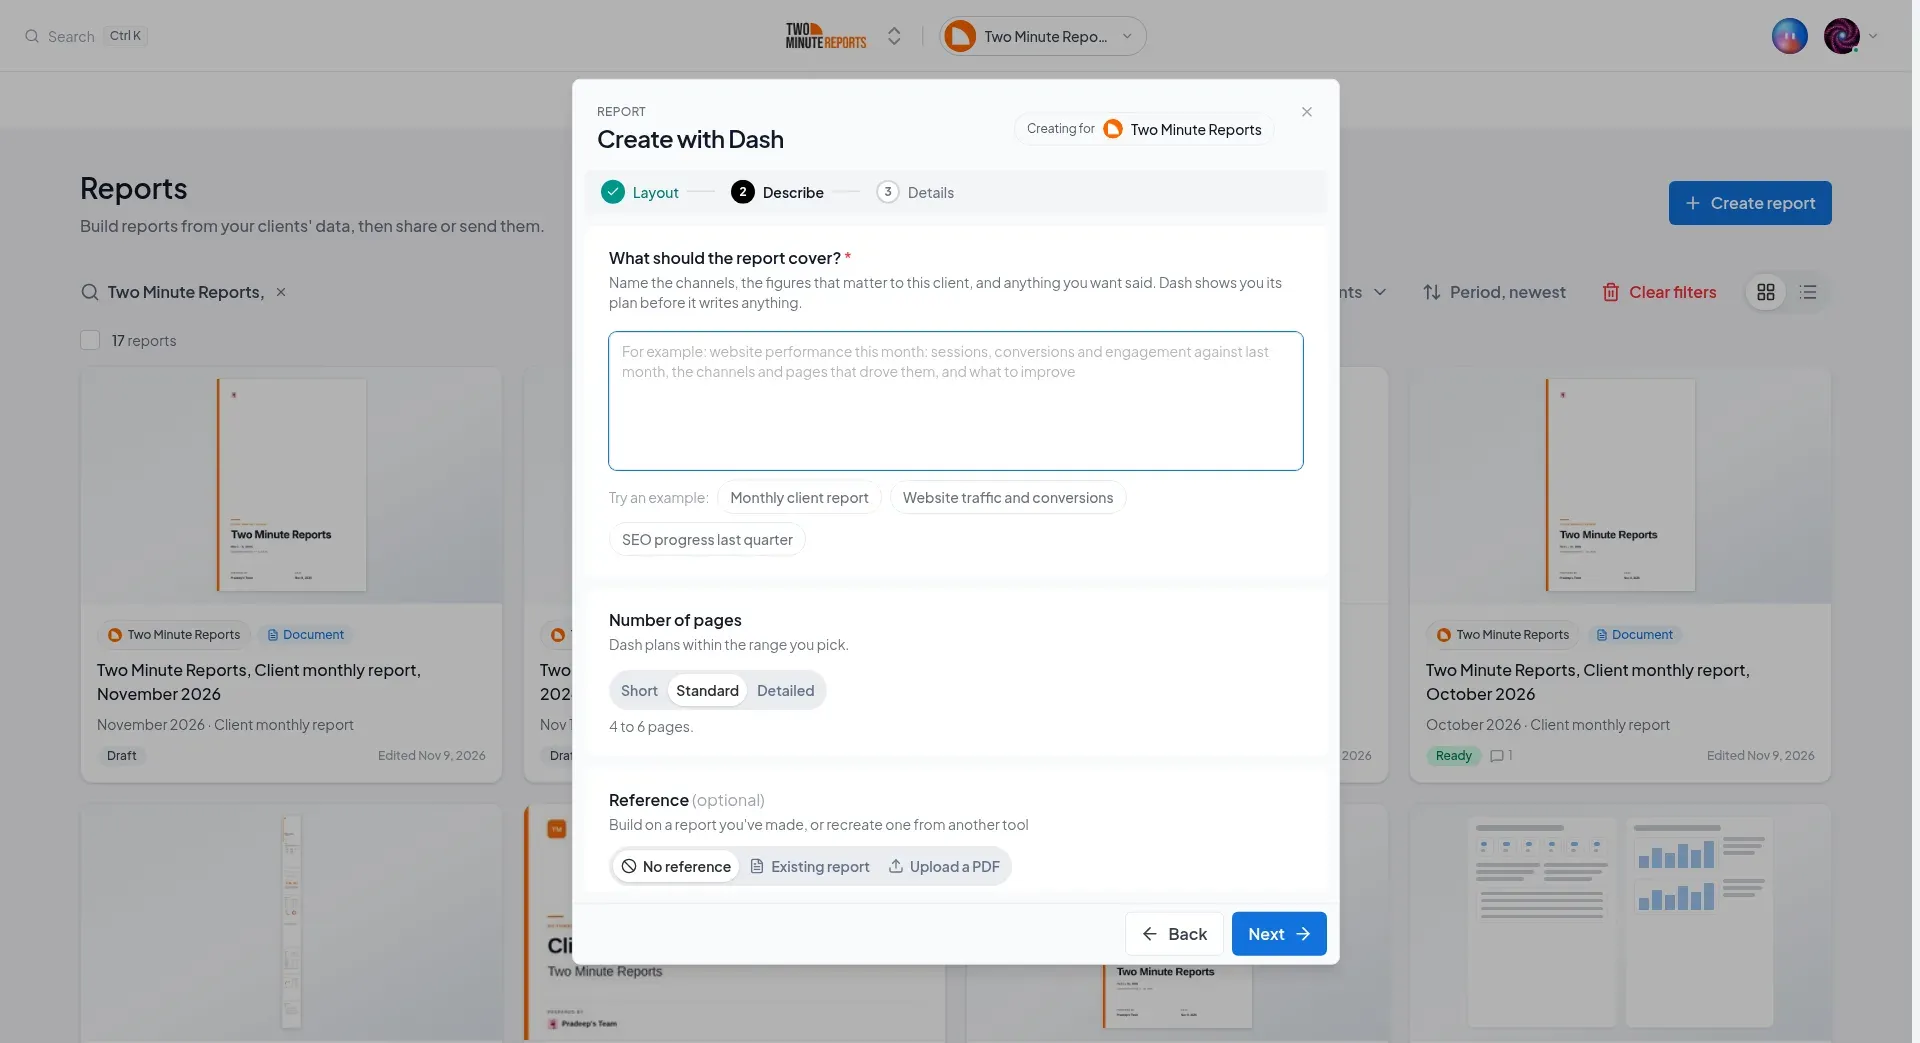
- In What should the report cover?, name the channels, the figures that matter to this client, and anything you want said. To start from an example, select one under Try an example. The examples are about the channels the client has accounts on. On All clients, they're about your team's connected channels.
- Under Number of pages (or Number of slides), choose a length:
Length Document Slides Short 2 to 3 pages 4 to 6 slides Standard 4 to 6 pages 7 to 11 slides Detailed 7 to 12 pages 12 to 18 slides - Optional: under Reference, choose what Dash builds on:
- No reference: Dash plans the report from your description.
- Existing report: choose a report you already made, in the same layout. Dash keeps that report's pages and design, fills them with this period's figures, and rewrites the commentary to follow what you wrote. The length is the length of that report.
- Upload a PDF: a report from another tool, as a PDF or as images (JPEG, PNG or WebP). A PDF can be up to 25 MB and an image up to 5 MB. Dash reads up to 8 pages. Under Use this report to…, choose Recreate to match its layout and style closely, or Take inspiration to use it loosely.
Dash shows you its plan before it writes anything. See Check Dash's plan.
Describe the look
You can also tell Dash how the report must look, in the same description. For example:
- "dark theme", or "make it look like a board deck"
- "use our brand orange", or "use our brand colors"
- "serif headings"
- "no cover", "a cover with a photo", or "a closing page"
- "start each section on its own page"
Dash applies the look only when you leave Theme on its suggestion in step 3. If you choose a theme yourself, your theme wins. The plan then tells you what your description asked for, and you can change the look later in Design.
Template (Use a template)
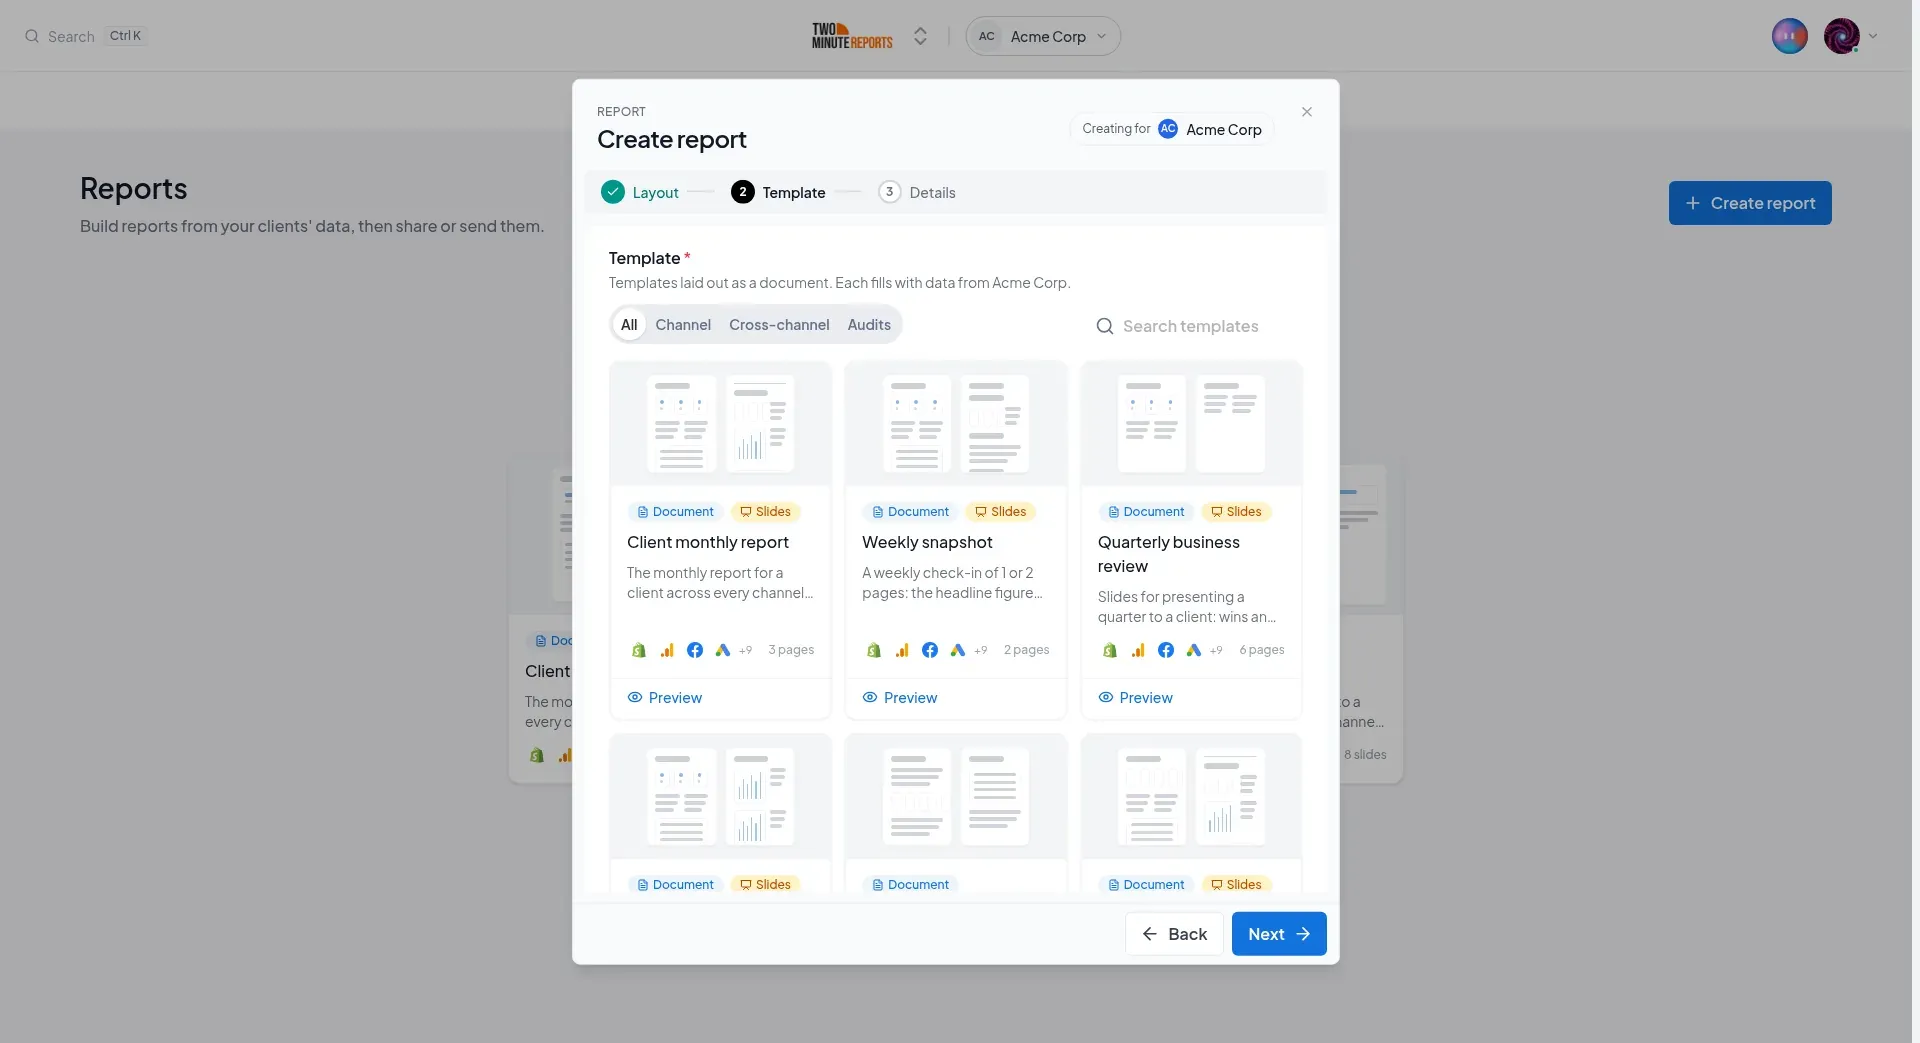
The gallery shows the templates that come in the layout you chose. It has tabs for All, Channel, Cross-channel and Audits, and a search box. Each card shows the template's pages, its length, and the connectors it reads.
Templates that the client has data for come first. A template that needs a connector the client doesn't have says Needs and the connector. You can still use it: it builds only the sections there's data for.
Select a template, then Next. To see every page of a template first, select Preview, then Use this template.
3. Details
- Name: starts with the client, the template and the period, for example "Acme, Meta Ads performance, October 2026". Change it here or later in the editor.
- Client: asked only when the client switcher is on All clients. Choose the client, or No client (team-wide).
- Accounts: the accounts the report reads. From a template, it starts with the client's accounts on the connectors that template reads. With Dash, it starts with all the client's accounts. With no client, choose at least one account.
- Period: the dates the report covers, and what they're compared with. See The period and the comparison. A template starts on its own period, for example last month, or the last 90 days for an audit. The dialog says so under the period.
- Theme: how the report looks. Select it to open the themes:
- For {client}: themes saved for this client, such as the light and dark brand themes a new client gets from its brand. A client with a brand color and no theme yet shows a theme made from that color. It's saved to Themes as the client's theme when you create the report.
- Team themes: the themes your team saved for reports. The team's default says (default).
- Presets: the built-in looks. Turn on Dark mode to see the dark ones.
The theme starts on the client's own theme, then the team's default, then the client's brand color, then the first preset. With Existing report as the reference, the report uses that report's design.
Select Create with Dash or Create report. The editor opens.
The period and the comparison
Under Compare to, choose:
- Last period: a calendar month compares with the month before it, a quarter with the quarter before it, and a year with the year before it. For example, October compares with September, not with the 31 days before October 31. Any other range compares with the same number of days just before it.
- Last year: the same dates one year earlier.
- None: no comparison.
When you change the period later, the comparison moves with it. A report that compares October with September compares September with August after you move it to September.
Check Dash's plan
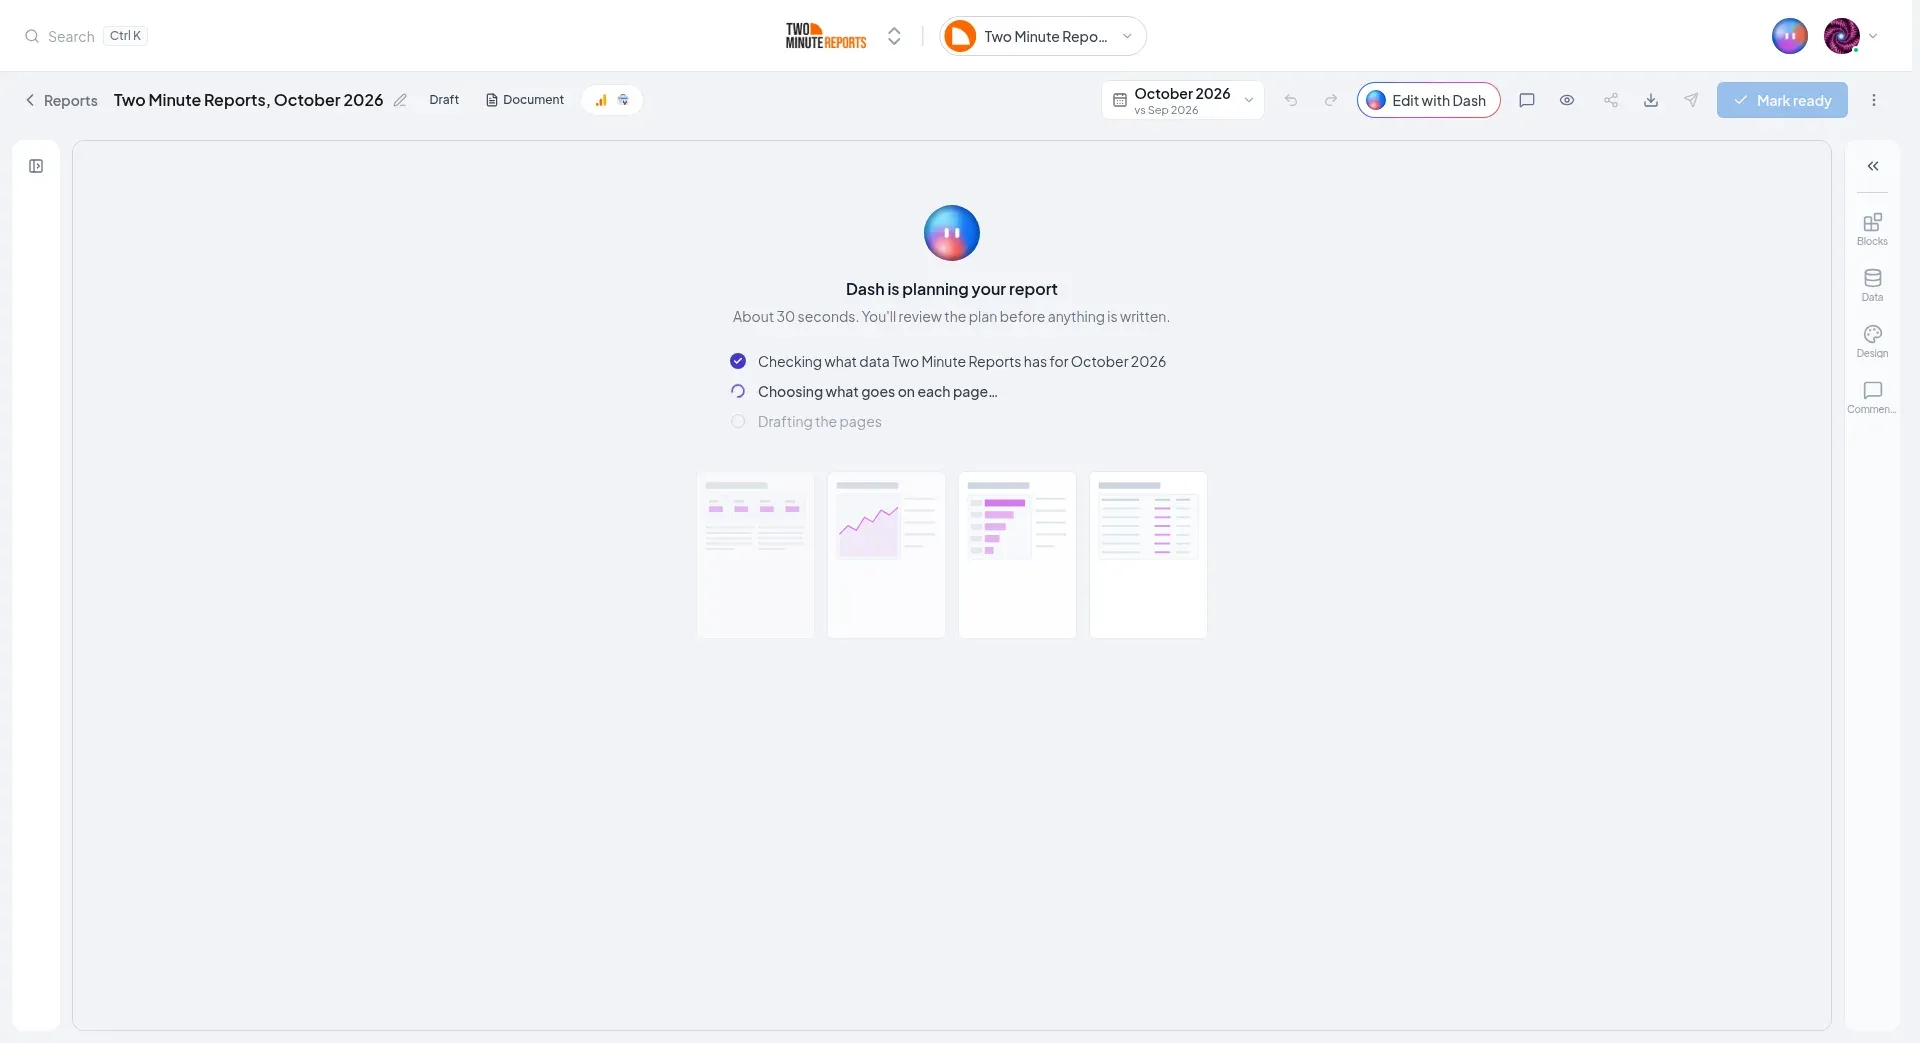
With Create with Dash, the editor first shows Dash is planning your report (or your slides). Planning takes about 30 seconds, and the screen shows the steps Dash goes through: checking what data the client has for the period, choosing what goes on each page, and drafting the pages.
Then the editor opens on Review the plan: the pages in order, what each one covers, and the blocks on each. Each page shows a small sketch of its layout, so you can see where the charts, tables and text go. Nothing is written until you build it. You can:
- Rename a page, move it up or down, or remove it
- Add a page
- Change a block to another type, or remove it
- Add a block to a page
If an account has no data for the period, the plan says so before you build. Select Change period, or leave the account out.
If your description asked for a look, the plan shows it under Design from your request, for example a dark preset and a serif heading font. Select Undo to go back to the theme you had. If you chose a theme yourself, the plan says Kept the theme you picked, and lists what your description asked for.
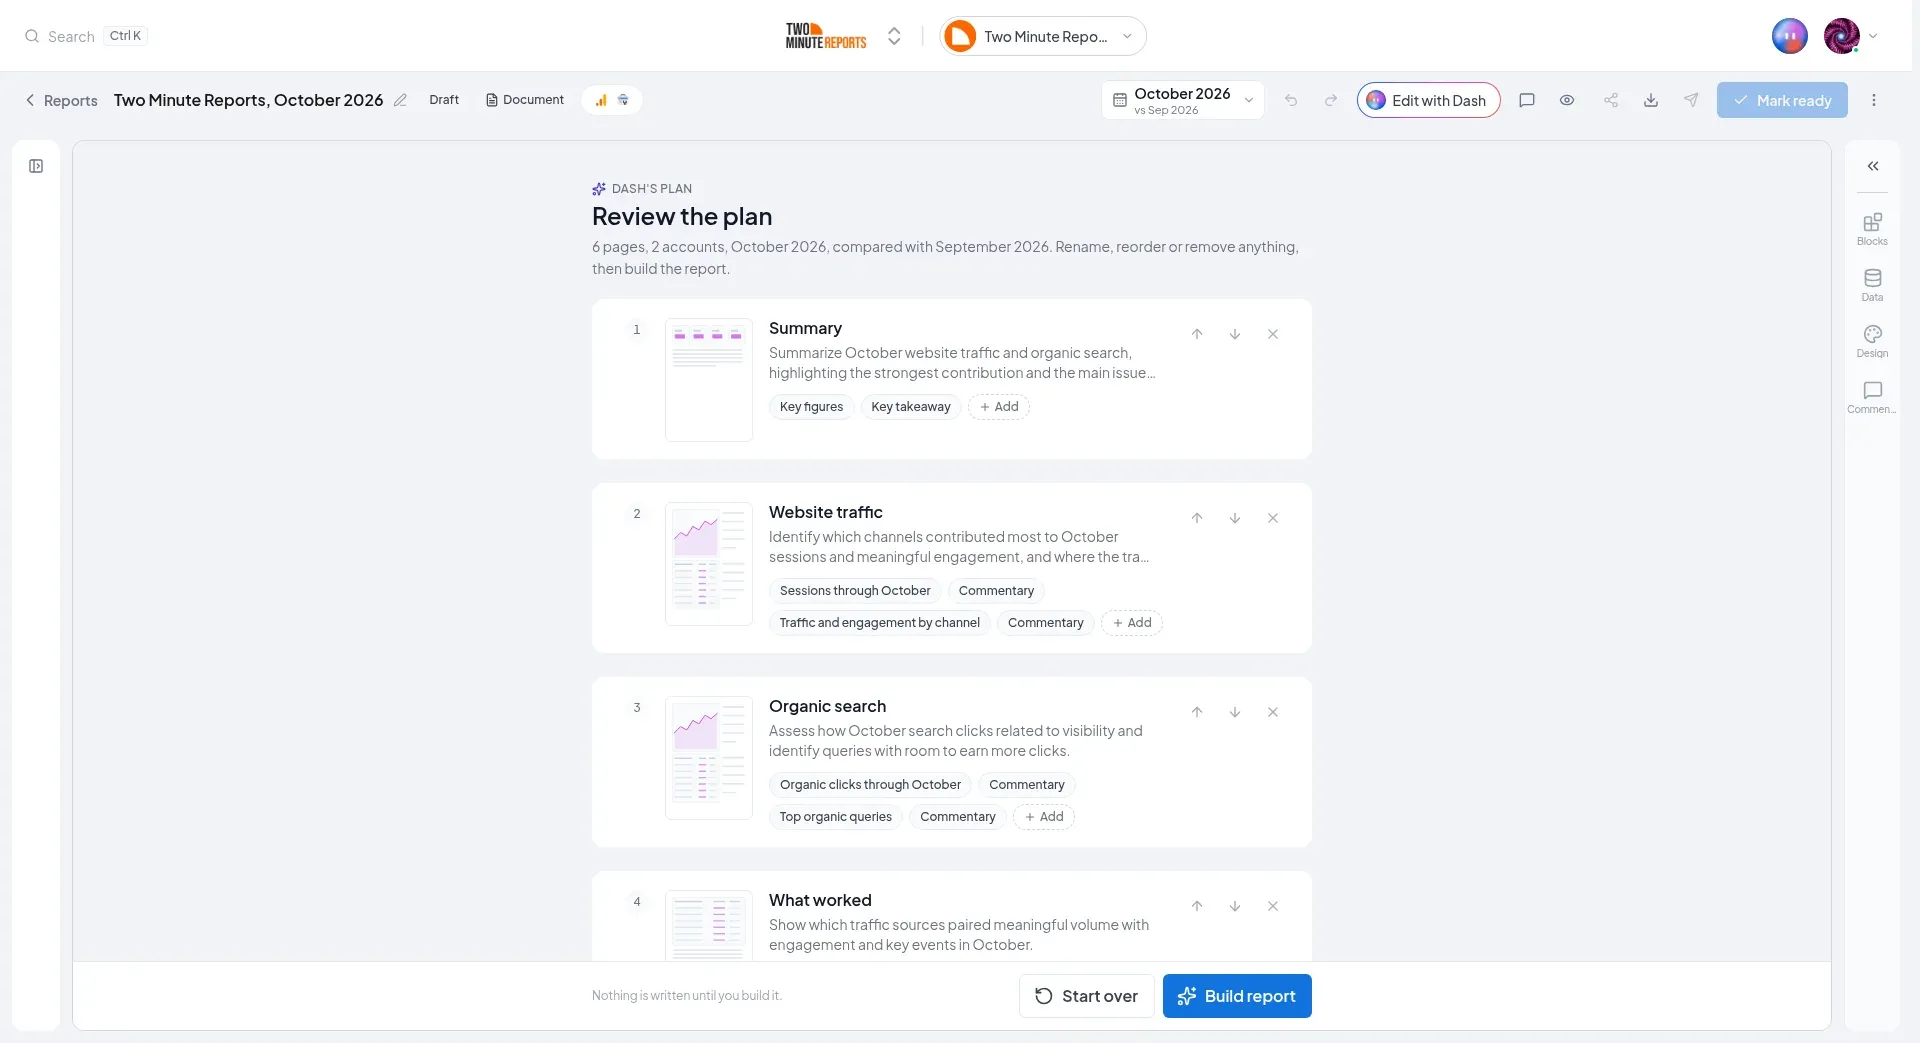
Select Build report to build it, or Start over for a new plan.
If Dash can't make a plan, select Try again, or Add blocks without Dash to build the report yourself.
While it builds
The report fills in on the page as Dash works: the blocks load their figures, then Dash writes the text, page by page. Dash checks every number it writes against the figures on the page.
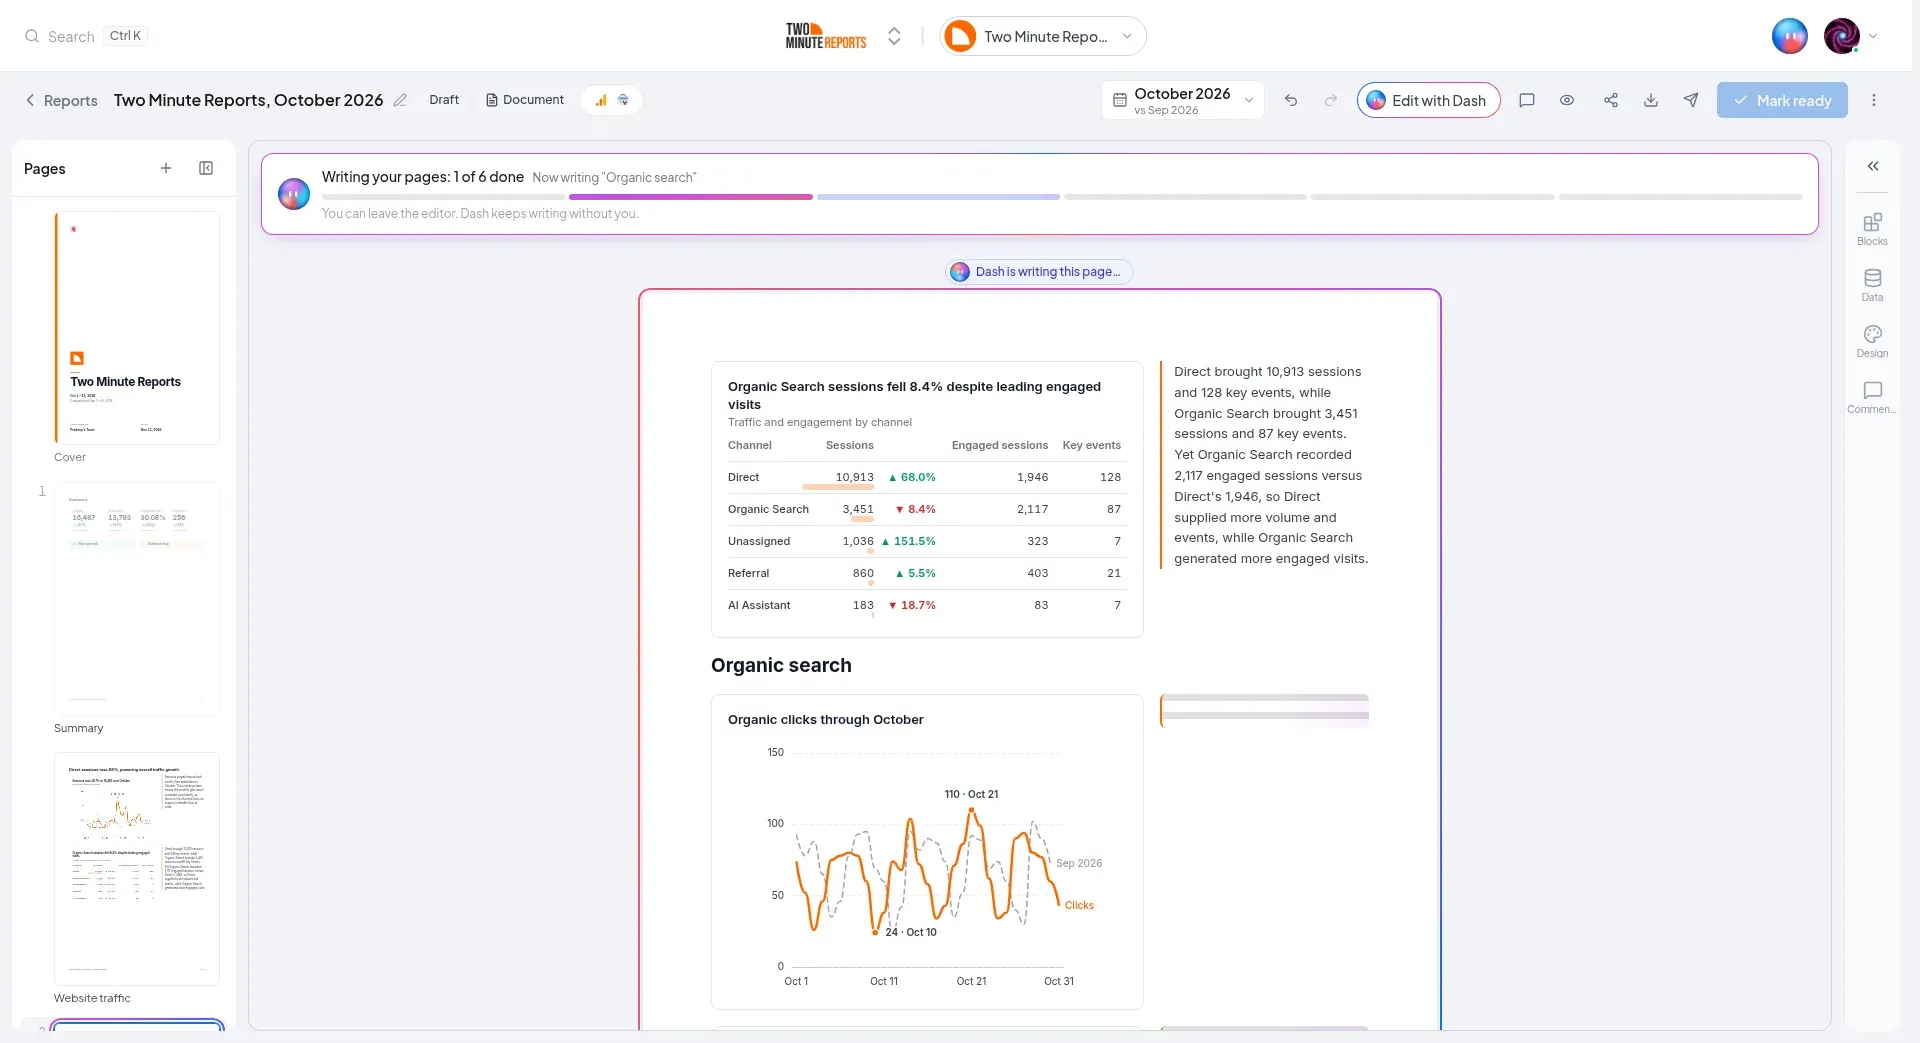
A banner at the top shows how far it is, for example Writing your pages: 2 of 6 done, with the page Dash is on, and a bar with a segment for each page.
- The page Dash is writing has a moving outline, in the editor and in the page list.
- The editor scrolls to follow Dash. Scroll, click or type in the report yourself, and it stops following.
- Mark ready waits until Dash is done. Point to it to see why.
When Dash finishes, the banner says Dash wrote your 6 pages (or slides). Writing takes about 20 to 30 seconds a page, so a Standard report is done in two to three minutes.
Then the editor shows what needs your attention, at the top of the report:
- An account with no data for the period. Change the period, or remove the account in Data.
- A block that couldn't load. Select Try again on it.
- Check a figure Dash wrote: Dash wrote a number that isn't in the data it was given. Select Show block to go to the block.
If you edit the report while Dash is still writing, Dash stops. The editor says Dash stopped because you edited the report, and the pages it already wrote stay.
Templates
There are 28 templates. A channel template reads one connector. A cross-channel template adds a section for each connected channel the client has, so it works for any mix of channels. Audits are documents only.
Channel
Each one is for the last month, compared with the month before, as a document or Slides.
| Template | Needs |
|---|---|
| Meta Ads performance | Facebook Ads |
| Google Ads performance | Google Ads |
| Microsoft Ads performance | Microsoft Ads |
| LinkedIn Ads performance | LinkedIn Ads |
| TikTok Ads performance | TikTok Ads |
| Amazon Ads performance | Amazon Ads |
| Website analytics | Google Analytics 4 |
| SEO performance | Google Search Console and Google Analytics 4 |
| Search rankings | Google Search Console |
| Instagram insights | Instagram Insights |
| Facebook Page insights | Facebook Insights |
| Local presence | Google My Business |
| Shopify store performance | Shopify |
Cross-channel
| Template | Needs | Period |
|---|---|---|
| Client monthly report: summary, headline figures, a section per channel, what you did, and next steps | Any one of the channels below | Last month |
| Paid media overview: every ad platform, and where the budget should go next | Any one ad platform: Facebook Ads, Google Ads, Microsoft Ads, LinkedIn Ads, TikTok Ads, Amazon Ads or Reddit Ads | Last month |
| Social media overview: reach, engagement and follower growth per network | Instagram Insights or Facebook Insights | Last month |
| Ecommerce performance: store sales beside the ads and traffic that drove them | Shopify, and Google Analytics 4 or an ad platform | Last month |
| Weekly snapshot: one or two pages, the headline figures and what moved | Any one of the channels below | Last 7 days |
| Quarterly business review: results channel by channel, and next quarter's plan. Slides by default | Any one of the channels below | Last quarter |
The channels a client monthly report, weekly snapshot or quarterly business review can include are Shopify, Google Analytics 4, the ad platforms above, Google Search Console, Google My Business, Instagram Insights and Facebook Insights.
Audits
Each one covers the last 90 days, compared with the 90 days before, as a document. An audit scores each area and ends with an action plan.
| Template | Needs | Uses if connected |
|---|---|---|
| Meta Ads audit | Facebook Ads | |
| Google Ads audit | Google Ads | |
| TikTok Ads audit | TikTok Ads | |
| LinkedIn Ads audit | LinkedIn Ads | |
| Reddit Ads audit | Reddit Ads | |
| Shopify store audit | Shopify | Google Analytics 4, for the checkout funnel and devices |
| Local SEO audit | Google My Business | Google Search Console and Google Analytics 4 |
| Content decay: the pages losing organic search traffic, with a fix for each | Google Search Console | Google Analytics 4 |
| AI traffic audit: traffic from ChatGPT, Gemini, Perplexity, Claude, and Copilot | Google Analytics 4 |
New report from this
Next month's report usually starts from this month's. Open the report, open the menu (⋮) and select New report from this. It's also in each report's menu on the Reports page.
- Name: the old name with the new period.
- Period: starts on the next period of the same length: November after October, the next quarter after a quarter.
- Accounts: starts with the same accounts as this report.
- Notes for Dash (optional): for example, "lead with the Black Friday results".
- Select Create report.
The new report continues this report's series, so a recurring send sends it once it is marked ready. It keeps this report's pages, blocks and design. It loads the new period's figures, and Dash rewrites the commentary. The text of your own sections, such as "What we did", is kept for you to update. A notice at the top says Carried over from the last report, how many blocks to update, and how many sentences quote figures that have changed. Select Show block to go to each one.
To copy a report with nothing rewritten, select Duplicate report instead. A copy starts a new series.
Next steps
Reports
Build the report you send a client, as a document or as Slides. Its figures freeze when you mark it ready, and next month's report starts from this one.
Blocks
A report page is a stack of rows, and a row holds up to four blocks side by side. Every block you can add, and the settings each one has.